Middle East And Africa Construction Chemicals Market Size and Share
Market Overview
| Study Period | 2020 - 2031 |
|---|---|
| Forecast Data Period | 2026 - 2031 |
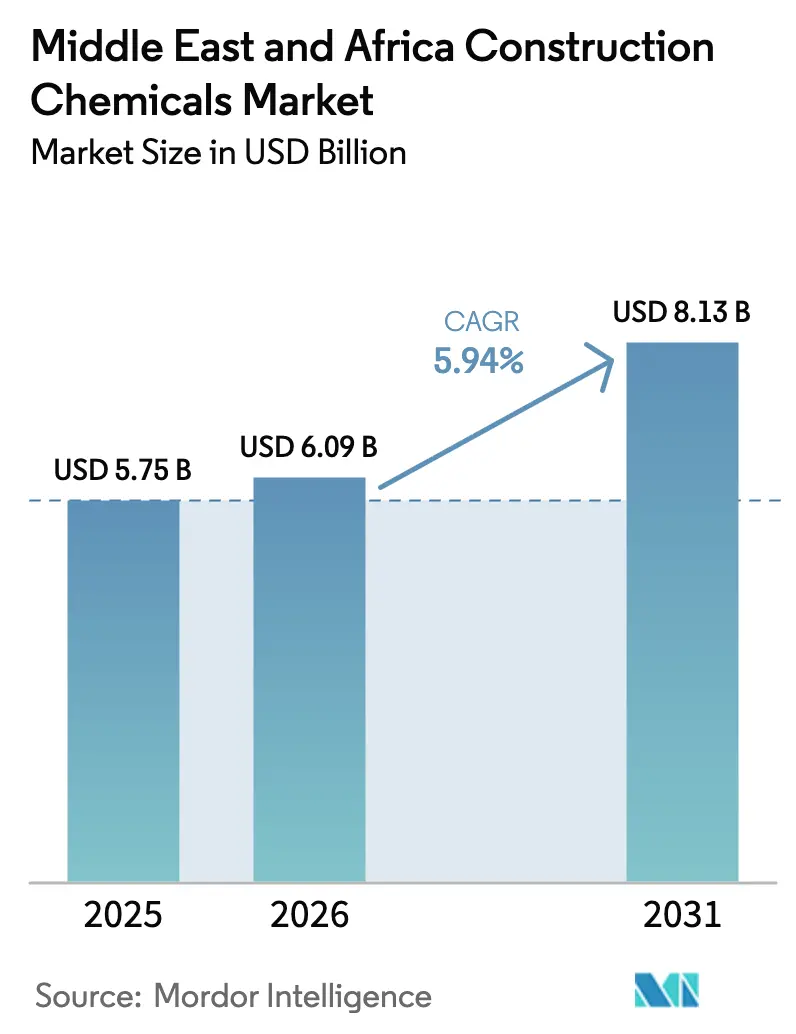
| Base Year Market Size (2025) | USD 5.75 Billion |
| Market Size (2026) | USD 6.09 Billion |
| Market Size (2031) | USD 8.13 Billion |
| Growth Rate (2026 - 2031) | 5.94% CAGR |
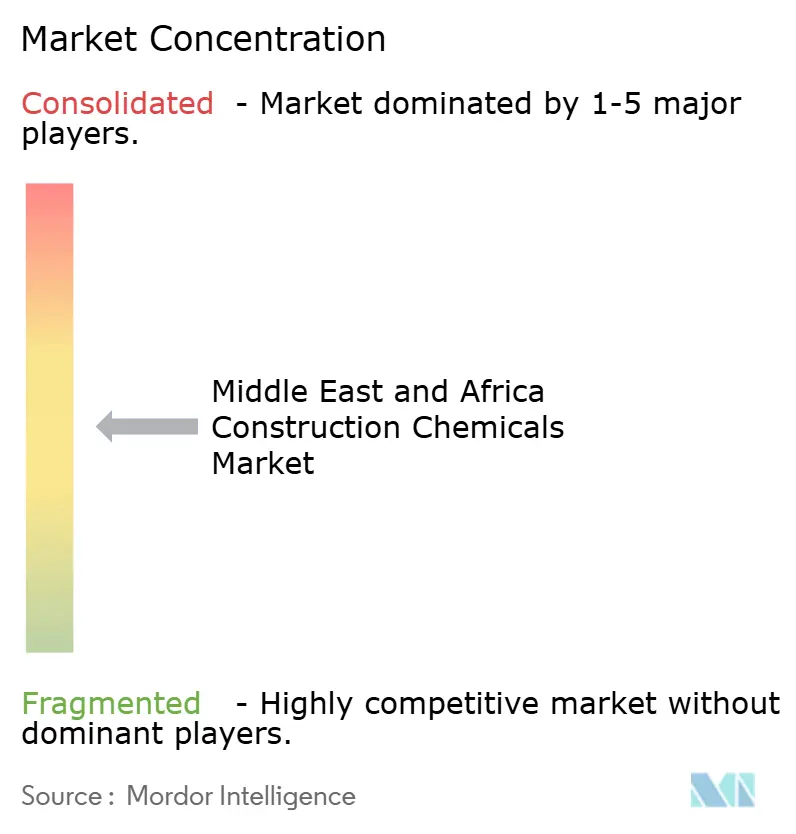
| Market Concentration | Medium |
Major Players *Disclaimer: Major Players sorted in no particular order Image © Mordor Intelligence. Reuse requires attribution under CC BY 4.0. | |
Middle East And Africa Construction Chemicals Market Analysis by Mordor Intelligence
Middle East and Africa Construction Chemicals Market size in 2026 is estimated at USD 6.09 billion, growing from 2025 value of USD 5.75 billion with 2031 projections showing USD 8.13 billion, growing at 5.94% CAGR over 2026-2031. Dominant growth drivers include Saudi Arabia’s USD 1.25 trillion Vision 2030 project pipeline, the UAE’s mandatory Estidama Pearl Rating System, expanding data center construction, and the rising adoption of off-site modular methods. Suppliers offering low-VOC, climate-adapted formulations gain a competitive advantage as green-building mandates tighten and end-users prioritize asset lifecycle extension. Local petrochemical capacity expansions offer partial insulation against price swings in crude-derived raw materials. Collectively, these factors underpin consistent procurement volumes for concrete admixtures, waterproofing systems, surface treatments, and repair chemicals across GCC and select African markets.
Key Report Takeaways
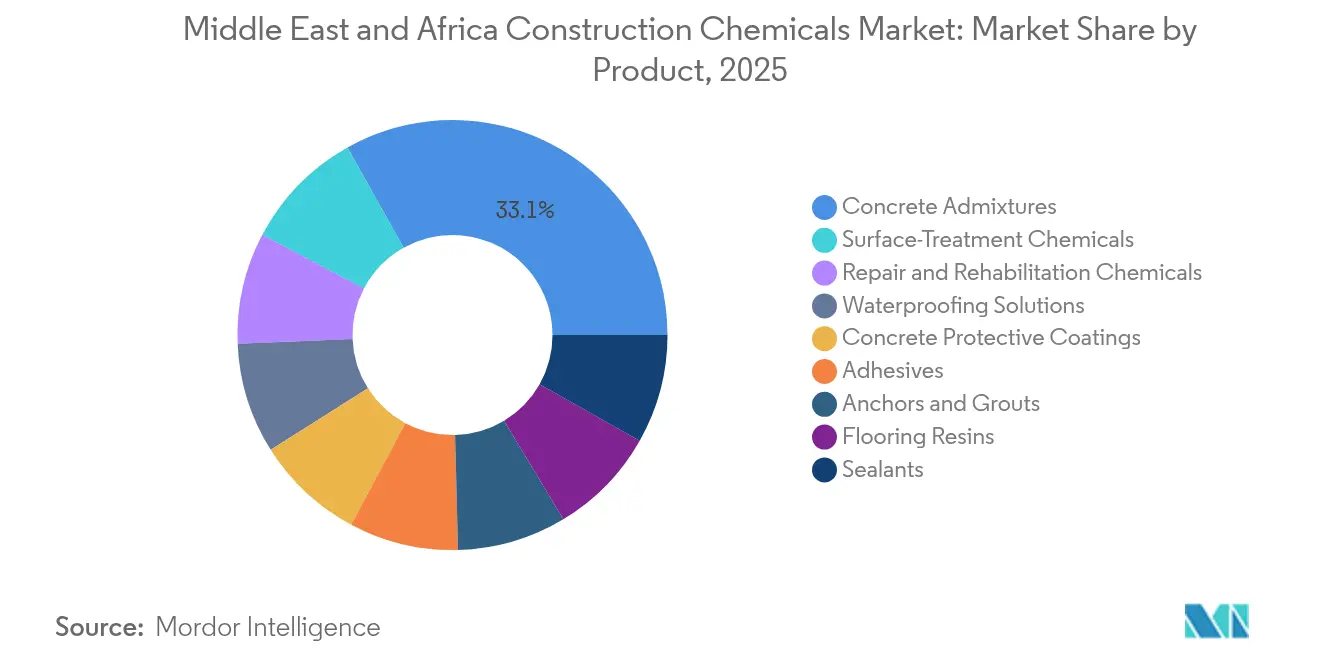
- By product, concrete admixtures commanded 33.12% of the Middle East and Africa construction chemicals market share in 2025, while surface treatment chemicals are projected to expand at a 6.55% CAGR through 2031.
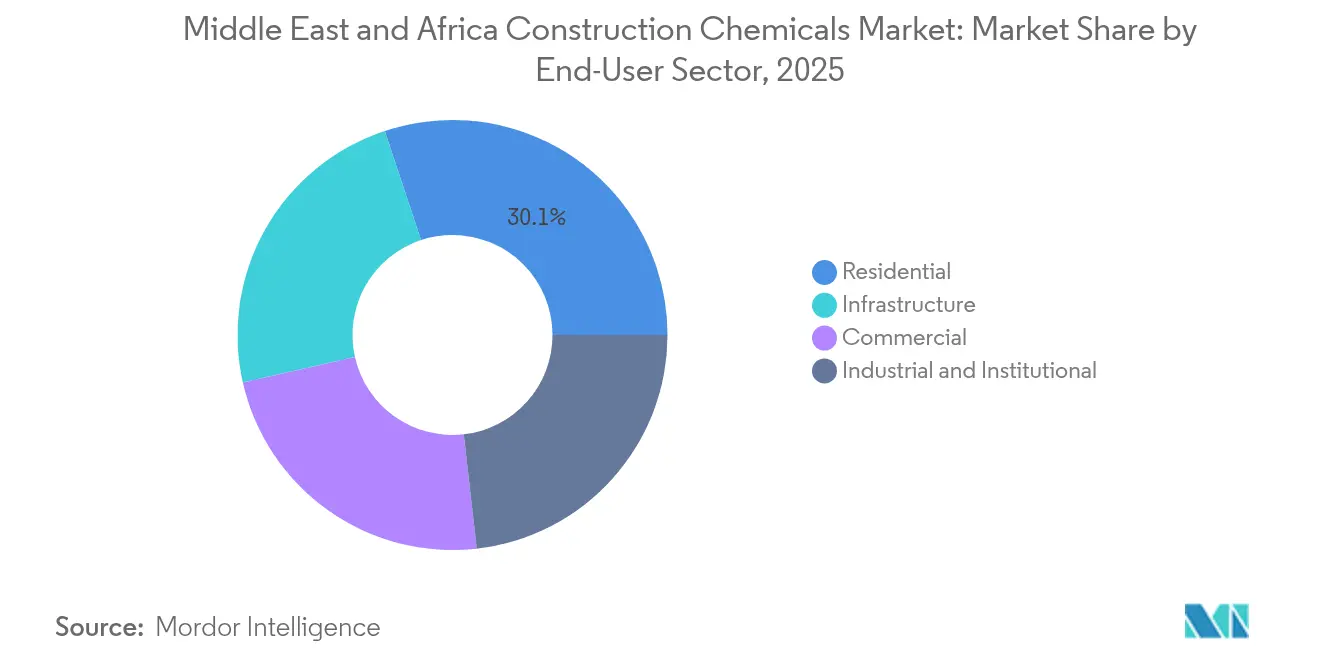
- By end-user, the residential segment accounted for 30.10% of the Middle East and Africa construction chemicals market size in 2025 and is forecast to lead growth at a 6.71% CAGR to 2031.
- By geography, Saudi Arabia held a 26.75% share of the Middle East and Africa construction chemicals market in 2025, whereas the UAE is poised for the fastest regional growth at a 6.85% CAGR between 2026 and 2031.
Note: Market size and forecast figures in this report are generated using Mordor Intelligence’s proprietary estimation framework, updated with the latest available data and insights as of 2026.
Market Trends and Insights
Drivers Impact Analysis of Middle East And Africa Construction Chemicals Market*
| Drivers | (~) % Impact on CAGR Forecast | Geographic Relevance | Impact Timeline |
|---|---|---|---|
| Accelerated mega-projects in Saudi Arabia and UAE | +2.1% | Saudi Arabia, UAE, spillover to Qatar and Oman | Medium term (2-4 years) |
| Shift toward green-certified buildings (LEED, Estidama) | +1.8% | UAE, Saudi Arabia, Qatar, Kuwait, Bahrain | Long term (≥ 4 years) |
| Rising concrete durability issues in hot-arid climates | +1.5% | GCC desert regions | Short term (≤ 2 years) |
| Boom in data-center construction across GCC | +1.2% | UAE, Saudi Arabia, Qatar, Oman, Bahrain | Medium term (2-4 years) |
| Off-site modular construction adoption | +0.8% | UAE, Saudi Arabia, Qatar, Kuwait | Long term (≥ 4 years) |
| Source: Mordor Intelligence | |||


Accelerated Mega-Projects in Saudi Arabia and UAE Drive Unprecedented Chemical Demand
Riyadh’s rapid transformation encompasses flagship developments such as NEOM, King Salman Park, and the Red Sea Project, each requiring high-performance admixtures, waterproofing, and sustainable adhesives to withstand the effects of coastal salinity and extreme heat. Similar momentum in the UAE stems from Dubai’s cluster of theme parks and Abu Dhabi’s Estidama-certified urban districts, which are scheduled for delivery by 2030, collectively amplifying regional demand for specialty construction chemicals that meet stringent durability and environmental criteria. Suppliers able to scale capacity and provide project-specific technical support secure preferred-supplier status across the region’s USD-trillion project pipeline.
Green Building Certification Requirements Reshape Product Specifications
Abu Dhabi mandates Estidama compliance across many active projects, enforcing VOC-free formulations and certified low-emission materials, a standard mirrored by LEED and the Emirates Green Building Council across the GCC[1]Gulf News, “Abu Dhabi Green Buildings to Improve Environment and Health,” gulfnews.com. Stringent indoor-air-quality limits—formaldehyde below 0.08 ppm and TVOC under 300 µg/m³—elevate demand for low-odor adhesives, sealants, and coatings. Innovative polymer platforms that meet these thresholds, while also enhancing mechanical properties, earn specification preference and capture premium pricing in the Middle East and Africa construction chemicals market.
Hot-Arid Climate Challenges Accelerate Advanced Admixture Adoption
Peak summer temperatures exceeding 50 °C can degrade conventional concrete, reducing its long-term compressive strength by up to 40% in desert microclimates. Research at Abu Dhabi University confirms that polycarboxylate-ether superplasticizers and binary fly-ash blends preserve workability and mitigate thermal cracking during extended mixing in conditions ranging from 25 to 40 °C. Contractors retrofitting concrete cooling systems and adopting climate-specific admixtures create steady growth for suppliers specializing in Middle East formulations.
Data-Center Construction Boom Creates Specialized Chemical Requirements
GCC cloud spending is projected to reach USD 2.5 billion in 2025 and USD 10 billion in Saudi Arabia alone by 2030, prompting aggressive data-center build-outs that require anti-static floorings, EMI-shield coatings, and intumescent fire-resistant systems. These facilities impose narrow tolerances for humidity and airborne particles, favoring high-purity sealants and low-fogging elastomers. Manufacturers offering certified systems tailored to critical-facility specifications are positioned to capture a niche yet fast-growing revenue stream within the Middle East and Africa construction chemicals market.
Restraints Impact Analysis of Middle East And Africa Construction Chemicals Market*
| Restraints | (~) % Impact on CAGR Forecast | Geographic Relevance | Impact Timeline |
|---|---|---|---|
| Volatility in crude-derived raw-material prices | −1.4% | Import-dependent African markets | Short term (≤ 2 years) |
| Project postponements amid fiscal tightening in Africa | −0.9% | Sub-Saharan and North Africa | Medium term (2-4 years) |
| Fragmented installer skill base limiting advanced admixture uptake | −0.7% | Africa and emerging GCC | Medium term (2-4 years) |
| Environmental scrutiny on VOC emissions in solvent-borne chemistries | −0.5% | UAE, Saudi Arabia, Qatar | Long term (≥ 4 years) |
| Source: Mordor Intelligence | |||
Raw Material Price Volatility Pressures Margin Sustainability
The Economist Intelligence Unit flags a potential Brent spike to USD 150/barrel under regional escalation scenarios, raising costs for ethylene, propylene, and other petrochemical feedstocks central to admixtures and coatings. Although Saudi Aramco’s 3 million tpa Sadara complex supplies regional demand for specialty resins, cross-border logistics and price pass-through lag still compress manufacturer margins during spikes[2]Saudi Aramco, “Sadara Petrochemicals Facility,” aramco.com.
Fragmented Installer Skill Base Constrains Advanced Chemical Adoption
Inconsistent application methods reduce concrete strength by up to 25% when high-performance admixtures are mis-dosed, discouraging contractors from specifying premium materials and hampering penetration of sophisticated solutions. Skill-gap pressures are most acute in Sub-Saharan Africa, where formal training programs remain limited. To counteract this restraint, Sika, Saint-Gobain, and Master Builders Solutions operate regional academies that provide hands-on certification to installers, gradually narrowing the competence deficit.
*Our forecasts treat driver/restraint impacts as directional, not additive. The impact forecasts reflect baseline growth, mix effects, and variable interactions.
Middle East And Africa Construction Chemicals Market Segment Analysis
By Product:
Concrete Admixtures Maintain Lead While Surface Treatments AccelerateConcrete admixtures represent the largest revenue pool, capturing 33.12% of the Middle East and Africa construction chemicals market share in 2025, underpinning the schedules of mega-projects that demand high slump retention, early strength, and heat mitigation. Over the forecast horizon, the segment grows in line with infrastructure outlays but cedes relative share to faster niches.
Surface treatment chemicals are projected to register the fastest 6.55% CAGR to 2031, driven by lifecycle-extension strategies in harsh climates. Curing compounds, mold-release agents, and breathable protective membranes improve abrasion resistance and reduce chloride ingress, a critical factor for coastal assets.
Waterproofing systems also expand steadily, leveraging hotel, resort, and basement construction across mixed-use projects. Polyurethane-based membranes with high solar-reflectance indexes (SRI ≥ 90) satisfy energy-efficiency codes. As regulatory agencies tighten building-envelope standards, demand shifts from commodity bituminous sheets toward liquid-applied, VOC-compliant chemistries.
Repair and rehabilitation chemicals gain visibility as transport corridors and utilities surpass mid-life milestones. Fiber-reinforced mortars and injected epoxy resins facilitate structural upgrades without extended shutdowns, complementing sustainability goals by maximizing existing asset value.


By End-User Sector:
Residential Dominance with Accelerating GrowthHousing initiatives across GCC create recurring orders for tile adhesives, grout, interior sealants, and decorative coatings. Saudi Arabia’s King Salman Park alone adds 12,000 units, underpinning a residential share of 30.10% in 2025 that rises at a 6.71% CAGR through 2031. Integrated township developments favor suppliers offering bundled solutions that speed interior fit-out while meeting VOC ceilings.
Infrastructure remains the backbone of regional budgets. Rail corridors, desalination plants, and heavy-haul ports specify sulfate-resisting cements blended with chemical admixtures to achieve 100-year design life. The USD 79 billion value of active Gulf rail projects positions this segment for sustained demand for superplasticizers, water-reducers, and high-build protective coatings.
Commercial construction, led by tourism and retail, demands specialty flooring, decorative facades, and fire-rated sealants. Dubai’s USD 6.8 billion Mall of the World and its 20 theme parks exemplify complex projects that integrate antimicrobial coatings and low-fogging elastomers to protect high-footfall spaces. Client preferences tend to favor system warranties and end-to-end support, thereby reinforcing vendor-client partnerships.
Industrial and institutional projects mirror manufacturing localization and healthcare expansion goals across Saudi Arabia, the UAE, and Kuwait. Hygienic wall coatings, antistatic floors, and chemical-resistant linings dominate bill-of-quantities, with product selection contingent on ISO 14644 cleanliness levels and GMP regulations for pharmaceuticals and food processing.
Geography Analysis
Saudi Arabia Construction Chemicals Market
Saudi Arabia continues to anchor demand, holding 26.75% of the Middle East and Africa construction chemicals market in 2025 as giga-projects convert design drawings into concrete pours at an unprecedented scale. Local admixture blenders align production with 24/7 site schedules, while specialty coating vendors support coastal resorts that are exposed to salt spray and humidity. Government transport corridors and 5 new economic cities further extend consumption across geographies within the kingdom.
United Arab Emirates Construction Chemicals Market
The UAE delivers the highest 6.85% CAGR, driven by Dubai’s USD 279.4 billion construction pipeline and Abu Dhabi’s Estidama enforcement. Stringent VOC limits elevate premium formulations, propelling suppliers with verified Environmental Product Declarations (EPDs) to leadership positions. Local ready-mix producers are adopting digital admixture-dosage control systems to ensure repeatability, reflecting a sophisticated customer base.
MEA Construction Chemicals Market
Rest-of-MEA exhibits heterogeneous prospects. Qatar capitalizes on World Cup legacy infrastructure and Sika’s new local factory to sustain demand. Sub-Saharan Africa lags GCC growth yet receives capital inflows for transport and energy projects from multilateral development banks, generating pockets of opportunity. Fiscal tightening in some African states delays certain schedules, but Gulf sovereign wealth entities continue to fund flagship developments that catalyze chemical demand.
Competitive Landscape
Technology innovation differentiates leaders. Saint-Gobain’s EnviroMix Impact App optimizes concrete formulations for cost and carbon reduction, while Sika’s reCO₂ver process binds 60 kg of CO₂ per ton of demolition waste, appealing to clients pursuing net-zero targets. Graphene-reinforced fibers hold promise for future high-strength, lightweight construction composites. Mid-tier and local players differentiate themselves by offering project-site technical services and quick-turn customization, although rising compliance costs and digitization requirements pressure those with limited scale.
Middle East And Africa Construction Chemicals Industry Leaders
Sika AG
Saint-Gobain
CMB
MAPEI S.p.A.
Conmix
- *Disclaimer: Major Players sorted in no particular order
Middle East And Africa Construction Chemicals Market Companies Covered in this Report
- Arkema (Bostik)
- Armorsil West Africa
- CIKO Middle East
- CMB
- CMCI (Construction Material Chemical Industries)
- Conmix
- INSUMAT
- Kenbro Industries Limited
- MAPEI S.p.A.
- Penetron International
- Pidilite Industries Limited
- RPM International Inc.
- Saint-Gobain
- Sika AG
- SOCHEM

Recent Industry Developments in Middle East And Africa Construction Chemicals Market
- June 2025: Sika AG has announced the acquisition of Gulf Additive Factory LLC (GAF), a well-established manufacturer of construction chemicals based in Qatar. This strategic move significantly enhances Sika’s footprint in the fast-growing Qatari construction market, opening new avenues for expansion across the Middle East and neighboring regions. GAF offers a diverse product portfolio that includes concrete admixtures, mortars, flooring systems, and waterproofing solutions.
- February 2025: Saint-Gobain has finalized its acquisition of Fosroc, a prominent global player in construction chemicals, significantly enhancing its presence across India, the Middle East, and the Asia-Pacific region. This strategic move, announced in June 2024 and completed in February 2025, marks a pivotal expansion of Saint-Gobain’s construction chemicals portfolio.


Middle East And Africa Construction Chemicals Market Report Scope
Commercial, Industrial and Institutional, Infrastructure, Residential are covered as segments by End Use Sector. Adhesives, Anchors and Grouts, Concrete Admixtures, Concrete Protective Coatings, Flooring Resins, Repair and Rehabilitation Chemicals, Sealants, Surface Treatment Chemicals, Waterproofing Solutions are covered as segments by Product. Saudi Arabia, United Arab Emirates are covered as segments by Country.Segmentation Overview
| Adhesives | Hot-Melt |
| Reactive | |
| Solvent-borne | |
| Water-borne | |
| Anchors and Grouts | Cementitious Fixing |
| Resin Fixing | |
| Concrete Admixtures | Accelerator |
| Air-Entraining | |
| Super-plasticizer | |
| Retarder | |
| Shrinkage-Reducer | |
| Viscosity-Modifier | |
| Plasticizer | |
| Other Types | |
| Concrete Protective Coatings | Acrylic |
| Alkyd | |
| Epoxy | |
| Polyurethane | |
| Other Resins | |
| Flooring Resins | Acrylic |
| Epoxy | |
| Polyaspartic | |
| Polyurethane | |
| Other Resins | |
| Repair and Rehabilitation Chemicals | Fiber-Wrapping Systems |
| Injection Grouting | |
| Micro-concrete Mortars | |
| Modified Mortars | |
| Rebar Protectors | |
| Sealants | Acrylic |
| Epoxy | |
| Polyurethane | |
| Silicone | |
| Other Resins | |
| Surface-Treatment Chemicals | Curing Compounds |
| Mold-Release Agents | |
| Other Types | |
| Waterproofing Solutions | Chemicals |
| Membranes |
| Commercial |
| Industrial and Institutional |
| Infrastructure |
| Residential |
| Saudi Arabia |
| United Arab Emirates |
| Rest of the Middle East and Africa |
| By Product | Adhesives | Hot-Melt |
| Reactive | ||
| Solvent-borne | ||
| Water-borne | ||
| Anchors and Grouts | Cementitious Fixing | |
| Resin Fixing | ||
| Concrete Admixtures | Accelerator | |
| Air-Entraining | ||
| Super-plasticizer | ||
| Retarder | ||
| Shrinkage-Reducer | ||
| Viscosity-Modifier | ||
| Plasticizer | ||
| Other Types | ||
| Concrete Protective Coatings | Acrylic | |
| Alkyd | ||
| Epoxy | ||
| Polyurethane | ||
| Other Resins | ||
| Flooring Resins | Acrylic | |
| Epoxy | ||
| Polyaspartic | ||
| Polyurethane | ||
| Other Resins | ||
| Repair and Rehabilitation Chemicals | Fiber-Wrapping Systems | |
| Injection Grouting | ||
| Micro-concrete Mortars | ||
| Modified Mortars | ||
| Rebar Protectors | ||
| Sealants | Acrylic | |
| Epoxy | ||
| Polyurethane | ||
| Silicone | ||
| Other Resins | ||
| Surface-Treatment Chemicals | Curing Compounds | |
| Mold-Release Agents | ||
| Other Types | ||
| Waterproofing Solutions | Chemicals | |
| Membranes | ||
| By End-User Sector | Commercial | |
| Industrial and Institutional | ||
| Infrastructure | ||
| Residential | ||
| By Geography | Saudi Arabia | |
| United Arab Emirates | ||
| Rest of the Middle East and Africa | ||


Market Definition
- END-USE SECTOR - Construction chemicals consumed in the construction sectors such as commercial, residential, industrial, institutional, and infrastructure are considered under the scope of the study.
- PRODUCT/APPLICATION - Under the scope of the study, the consumption of construction chemical products such as concrete admixtures, repair and rehabilitation chemicals, flooring resins, waterproofing solutions, anchors and grouts, adhesives and sealants, and surface treatment chemicals is considered.
| Keyword | Definition |
|---|---|
| Accelerator | Accelerators are admixtures used to fasten the setting time of concrete by increasing the initial rate and speeding up the chemical reaction between cement and the mixing water. These are used to harden and increase the strength of concrete quickly. |
| Acrylic | This synthetic resin is a derivative of acrylic acid. It forms a smooth surface and is mainly used for various indoor applications. The material can also be used for outdoor applications with a special formulation. |
| Adhesives | Adhesives are bonding agents used to join materials by gluing. Adhesives can be used in construction for many applications, such as carpet laying, ceramic tiles, countertop lamination, etc. |
| Air Entraining Admixture | Air-entraining admixtures are used to improve the performance and durability of concrete. Once added, they create uniformly distributed small air bubbles to impart enhanced properties to the fresh and hardened concrete. |
| Alkyd | Alkyds are used in solvent-based paints such as construction and automotive paints, traffic paints, flooring resins, protective coatings for concrete, etc. Alkyd resins are formed by the reaction of an oil (fatty acid), a polyunsaturated alcohol (Polyol), and a polyunsaturated acid or anhydride. |
| Anchors and Grouts | Anchors and grouts are construction chemicals that stabilize and improve the strength and durability of foundations and structures like buildings, bridges, dams, etc. |
| Cementitious Fixing | Cementitious fixing is a process in which a cement-based grout is pumped under pressure to fill forms, voids, and cracks. It can be used in several settings, including bridges, marine applications, dams, and rock anchors. |
| Commercial Construction | Commercial construction comprises new construction of warehouses, malls, shops, offices, hotels, restaurants, cinemas, theatres, etc. |
| Concrete Admixtures | Concrete admixtures comprise water reducers, air entrainers, retarders, accelerators, superplasticizers, etc., added to concrete before or during mixing to modify its properties. |
| Concrete Protective Coatings | To provide specific protection, such as anti-carbonation or chemical resistance, a film-forming protective coat can be applied on the surface. Depending on the applications, different resins like epoxy, polyurethane, and acrylic can be used for concrete protective coatings. |
| Curing Compounds | Curing compounds are used to cure the surface of concrete structures, including columns, beams, slabs, and others. These curing compounds keep the moisture inside the concrete to give maximum strength and durability. |
| Epoxy | Epoxy is known for its strong adhesive qualities, making it a versatile product in many industries. It resists heat and chemical applications, making it an ideal product for anyone needing a stronghold under pressure. It is widely used in adhesives, electrical and electronics, paints, etc. |
| Fiber Wrapping Systems | Fiber Wrapping Systems are a part of construction repair and rehabilitation chemicals. It involves the strengthening of existing structures by wrapping structural members like beams and columns with glass or carbon fiber sheets. |
| Flooring Resins | Flooring resins are synthetic materials applied to floors to enhance their appearance, increase their resistance to wear and tear or provide protection from chemicals, moisture, and stains. Depending on the desired properties and the specific application, flooring resins are available in distinct types, such as epoxy, polyurethane, and acrylic. |
| High-Range Water Reducer (Super Plasticizer) | High-range water reducers are a type of concrete admixture that provides enhanced and improved properties when added to concrete. These are also called superplasticizers and are used to decrease the water-to-cement ratio in concrete. |
| Hot Melt Adhesives | Hot-melt adhesives are thermoplastic bonding materials applied as melts that achieve a solid state and resultant strength on cooling. They are commonly used for packaging, coatings, sanitary products, and tapes. |
| Industrial and Institutional Construction | Industrial and institutional construction includes new construction of hospitals, schools, manufacturing units, energy and power plants, etc. |
| Infrastructure Construction | Infrastructure construction includes new construction of railways, roads, seaways, airports, bridges, highways, etc. |
| Injection Grouting | The process of injecting grout into open joints, cracks, voids, or honeycombs in concrete or masonry structural members is known as injection grouting. It offers several benefits, such as strengthening a structure and preventing water infiltration. |
| Liquid-Applied Waterproofing Membranes | Liquid-Applied membrane is a monolithic, fully bonded, liquid-based coating suitable for many waterproofing applications. The coating cures to form a rubber-like elastomeric waterproof membrane and may be applied over many substrates, including asphalt, bitumen, and concrete. |
| Micro-concrete Mortars | Micro-concrete mortar is made up of cement, water-based resin, additives, mineral pigments, and polymers and can be applied on both horizontal and vertical surfaces. It can be used to refurbish residential complexes, commercial spaces, etc. |
| Modified Mortars | Modified Mortars include Portland cement and sand along with latex/polymer additives. The additives increase adhesion, strength, and shock resistance while also reducing water absorption. |
| Mold Release Agents | Mold release agents are sprayed or coated on the surface of molds to prevent a substrate from bonding to a molding surface. Several types of mold release agents, including silicone, lubricant, wax, fluorocarbons, and others, are used based on the type of substrates, including metals, steel, wood, rubber, plastic, and others. |
| Polyaspartic | Polyaspartic is a subset of polyurea. Polyaspartic floor coatings are typically two-part systems that consist of a resin and a catalyst to ease the curing process. It offers high durability and can withstand harsh environments. |
| Polyurethane | Polyurethane is a plastic material that exists in various forms. It can be tailored to be either rigid or flexible and is the material of choice for a broad range of end-user applications, such as adhesives, coatings, building insulation, etc. |
| Reactive Adhesives | A reactive adhesive is made of monomers that react in the adhesive curing process and do not evaporate from the film during use. Instead, these volatile components become chemically incorporated into the adhesive. |
| Rebar Protectors | In concrete structures, rebar is one of the important components, and its deterioration due to corrosion is a major issue that affects the safety, durability, and life span of buildings and structures. For this reason, rebar protectors are used to protect against degrading effects, especially in infrastructure and industrial construction. |
| Repair and Rehabilitation Chemicals | Repair and Rehabilitation Chemicals include repair mortars, injection grouting materials, fiber wrapping systems, micro-concrete mortars, etc., used to repair and restore existing buildings and structures. |
| Residential Construction | Residential construction involves constructing new houses or spaces like condominiums, villas, and landed homes. |
| Resin Fixing | The process of using resins like epoxy and polyurethane for grouting applications is called resin fixing. Resin fixing offers several advantages, such as high compressive and tensile strength, negligible shrinkage, and greater chemical resistance compared to cementitious fixing. |
| Retarder | Retarders are admixtures used to slow down the setting time of concrete. These are usually added with a dosage rate of around 0.2% -0.6% by weight of cement. These admixtures slow down hydration or lower the rate at which water penetrates the cement particles by making concrete workable for a long time. |
| Sealants | A sealant is a viscous material that has little or no flow qualities, which causes it to remain on surfaces where they are applied. Sealants can also be thinner, enabling penetration to a certain substance through capillary action. |
| Sheet Waterproofing Membranes | Sheet membrane systems are reliable and durable thermoplastic waterproofing solutions that are used for waterproofing applications even in the most demanding below-ground structures, including those exposed to highly aggressive ground conditions and stress. |
| Shrinkage Reducing Admixture | Shrinkage-reducing admixtures are used to reduce concrete shrinkage, whether from drying or self-desiccation. |
| Silicone | Silicone is a polymer that contains silicon combined with carbon, hydrogen, oxygen, and, in some cases, other elements. It is an inert synthetic compound that comes in various forms, such as oil, rubber, and resin. Due to its heat-resistant properties, it finds applications in sealants, adhesives, lubricants, etc. |
| Solvent-borne Adhesives | Solvent-borne adhesives are mixtures of solvents and thermoplastic or slightly cross-linked polymers such as polychloroprene, polyurethane, acrylic, silicone, and natural and synthetic rubbers. |
| Surface Treatment Chemicals | Surface treatment chemicals are chemicals used to treat concrete surfaces, including roofs, vertical surfaces, and others. They act as curing compounds, demolding agents, rust removers, and others. They are cost-effective and can be used on roadways, pavements, parking lots, and others. |
| Viscosity Modifier | Viscosity Modifiers are concrete admixtures used to change various properties of admixtures, including viscosity, workability, cohesiveness, and others. These are usually added with a dosage of around 0.01% to 0.1% by weight of cement. |
| Water Reducer | Water reducers, also called plasticizers, are a type of admixture used to decrease the water-to-cement ratio in the concrete, thereby increasing the durability and strength of concrete. Various water reducers include refined lignosulfonates, gluconates, hydroxycarboxylic acids, sugar acids, and others. |
| Water-borne Adhesives | Water-borne adhesives use water as a carrier or diluting medium to disperse resin. They are set by allowing the water to evaporate or be absorbed by the substrate. These adhesives are compounded with water as a dilutant rather than a volatile organic solvent. |
| Waterproofing Chemicals | Waterproofing chemicals are designed to protect a surface from the perils of leakage. A waterproofing chemical is a protective coating or primer applied to a structure's roof, retaining walls, or basement. |
| Waterproofing Membranes | Waterproofing membranes are liquid-applied or self-adhering layers of water-tight materials that prevent water from penetrating or damaging a structure when applied to roofs, walls, foundations, basements, bathrooms, and other areas exposed to moisture or water. |


Research Methodology
Mordor Intelligence follows a four-step methodology in all our reports.
- Step-1: Identify Key Variables: The quantifiable key variables (industry and extraneous) pertaining to the specific product segment and country are selected from a group of relevant variables & factors based on desk research & literature review; along with primary expert inputs. These variables are further confirmed through regression modeling (wherever required).
- Step-2: Build a Market Model: In order to build a robust forecasting methodology, the variables and factors identified in Step-1 are tested against available historical market numbers. Through an iterative process, the variables required for market forecast are set and the model is built on the basis of these variables.
- Step-3: Validate and Finalize: In this important step, all market numbers, variables and analyst calls are validated through an extensive network of primary research experts from the market studied. The respondents are selected across levels and functions to generate a holistic picture of the market studied.
- Step-4: Research Outputs: Syndicated Reports, Custom Consulting Assignments, Databases & Subscription Platforms


