Malaysia Construction Chemicals Market Size and Share
Market Overview
| Study Period | 2021 - 2031 |
|---|---|
| Forecast Data Period | 2026 - 2031 |
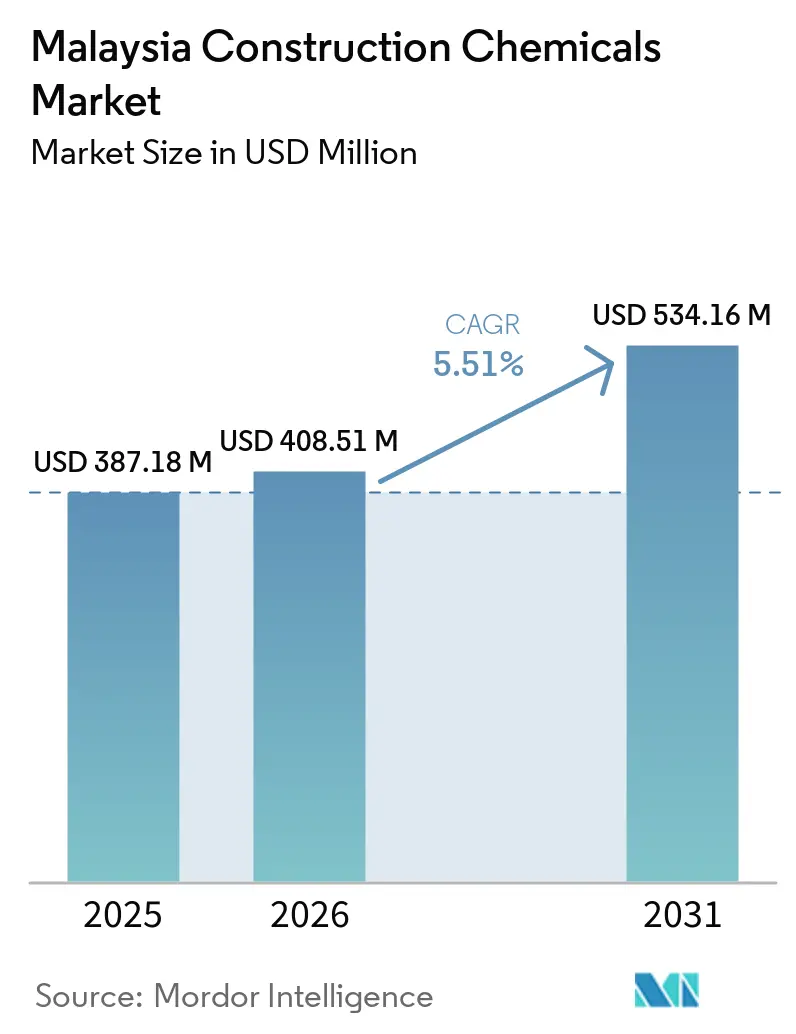
| Base Year Market Size (2025) | USD 387.18 Million |
| Market Size (2026) | USD 408.51 Million |
| Market Size (2031) | USD 534.16 Million |
| Growth Rate (2026 - 2031) | 5.51% CAGR |
| Market Concentration | Medium |
Major Players *Disclaimer: Major Players sorted in no particular order Image © Mordor Intelligence. Reuse requires attribution under CC BY 4.0. | |
Malaysia Construction Chemicals Market Analysis by Mordor Intelligence
The Malaysia Construction Chemicals Market size is expected to grow from USD 387.18 million in 2025 to USD 408.51 million in 2026 and is forecast to reach USD 534.16 million by 2031 at a 5.51% CAGR over 2026-2031. Key growth drivers include a bolstered federal infrastructure pipeline, ongoing investments in data centers, and a consistent move toward prefabrication. The Malaysian government's allocation for public development in 2026 is fueling a surge in demand for admixtures, sealants, and repair mortars, as it supports an extensive lineup of highways, rail links, and water projects. During the first and second halves of 2024, private investors made significant investments in data-center campuses, emphasizing the need for high-performance flooring resins and fire-resistant coatings. Contractors are increasingly opting for locally sourced materials to avoid shipment delays, enabling domestic formulators to capture market share previously held by importers. Simultaneously, Malaysia's Standard MS 2514:2014 tightened regulations on volatile organic compound emissions, prompting a shift in product specifications from solvent-borne to water-borne chemistries.
Key Report Takeaways
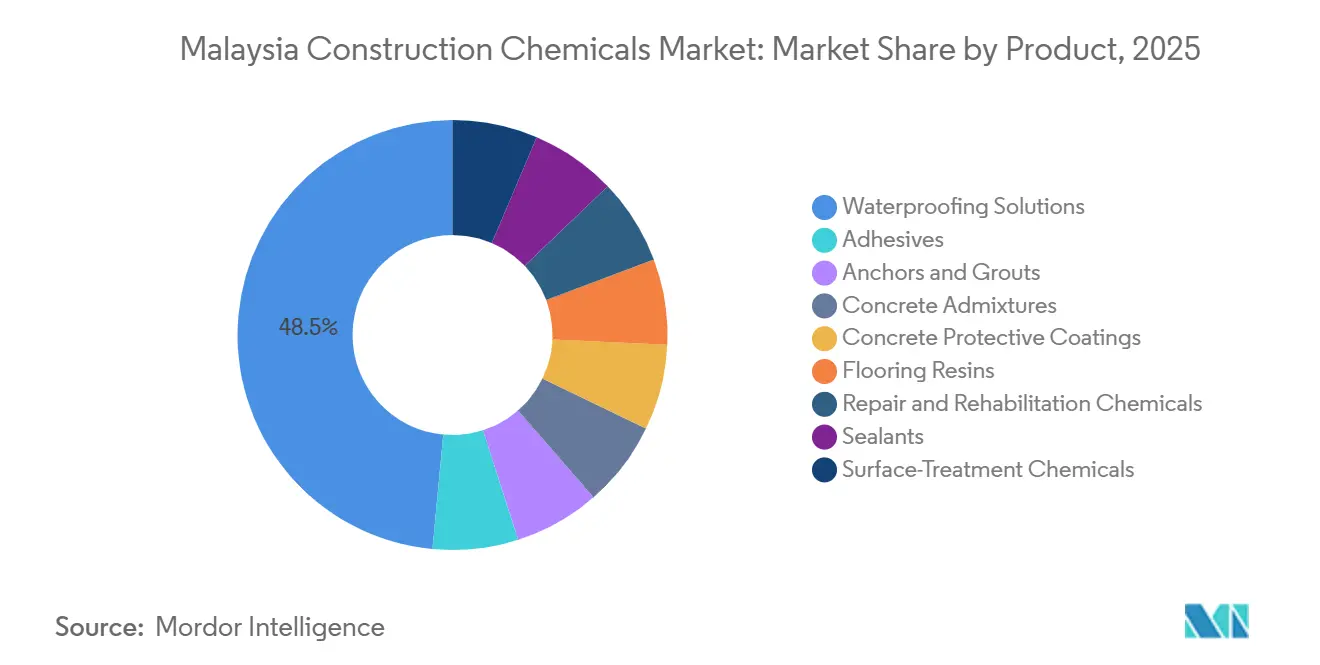
- By product type, waterproofing solutions led with 48.51% revenue share of the Malaysia construction chemicals market in 2025. Surface-treatment chemicals are forecast to expand at a 7.12% CAGR through 2031.
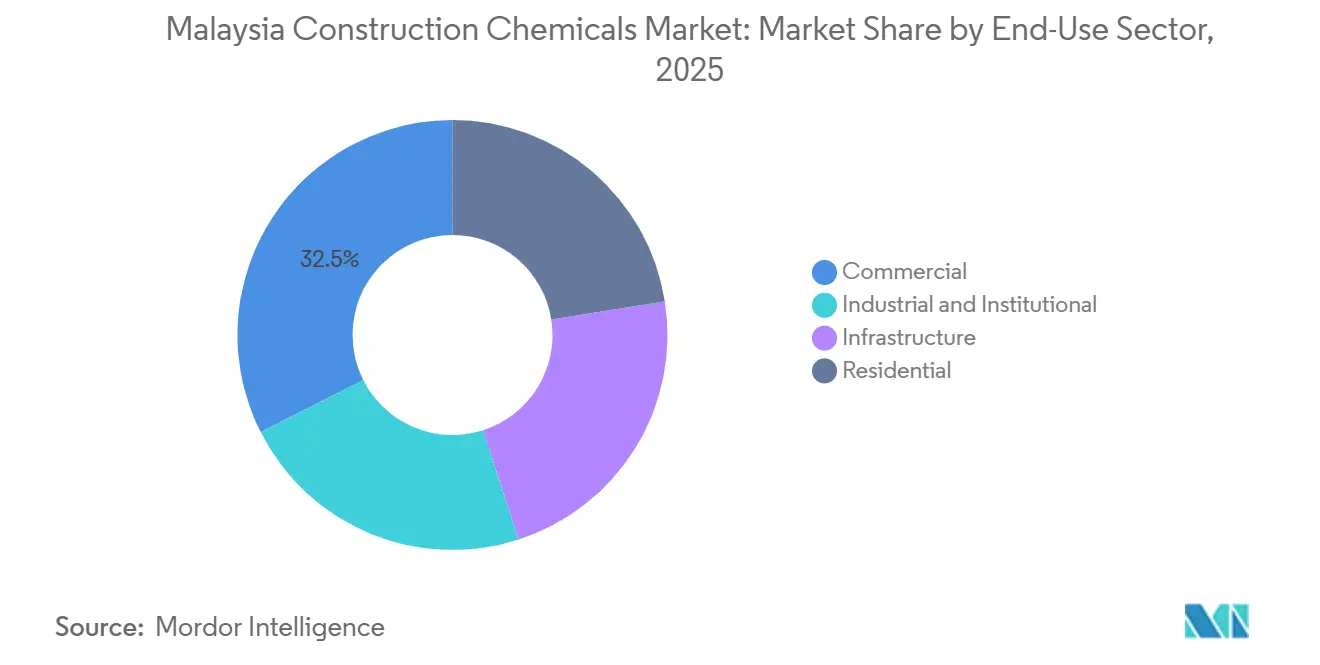
- By end-use sector, the commercial segment accounted for a 32.45% share of the Malaysia construction chemicals market size in 2025. Industrial and institutional applications are advancing at a 6.22% CAGR through 2031.
Note: Market size and forecast figures in this report are generated using Mordor Intelligence’s proprietary estimation framework, updated with the latest available data and insights as of 2026.
Malaysia Construction Chemicals Market Trends and Insights
Drivers Impact Analysis*
| Drivers | (~) % Impact on CAGR Forecast | Geographic Relevance | Impact Timeline |
|---|---|---|---|
| Sustainable public and private infrastructure outlay | +1.8% | Peninsular Malaysia corridors including ECRL, Pan Borneo Highway and urban rail extensions | Medium term (2-4 years) |
| Affordable-housing push expanding residential starts | +1.2% | Selangor, Johor and Penang under Bakat Baru Madani and PR1MA schemes | Short term (≤ 2 years) |
| Green-building certification boosting low-VOC and durable chemistries | +0.9% | Kuala Lumpur, Penang and Johor Bahru projects pursuing GBI and LEED labels | Long term (≥ 4 years) |
| Rapid uptake of ready-mix and prefab systems raising admixture penetration | +1.1% | National, led by Industrialised Building System adoption in public housing and commercial developments | Medium term (2-4 years) |
| SEZ tax breaks localising specialty-chemical production | +0.7% | Johor-Singapore SEZ and free-trade zones in Penang and Johor | Long term (≥ 4 years) |
| Source: Mordor Intelligence | |||
Sustainable Public and Private Infrastructure Outlay
In 2026, federal and state agencies allocated a significant amount of funds for development projects. This budget not only includes funding for federal road maintenance but also channels additional resources through the Malaysian Road Records Information System for state road upgrades. These financial commitments lead highway and bridge contractors to prioritize materials such as concrete protective coatings, crack-injection resins, and polymer-modified overlays. In January 2025, the East Coast Rail Link was nearing completion and actively utilizing epoxy anchoring systems and shrinkage-reducing admixtures for its tunnel linings[1]Malaysia Rail Link, “East Coast Rail Link Project Progress Update,” MRL.COM.MY. In Johor, upgrades to the Kulai-Sedenak highway have driven increased demand for hot-melt adhesives in pavement markings and acrylic sealants for expansion joints[2]Public Works Department Malaysia, “Highway Upgrade Contracts,” JKR.GOV.MY. The Pengurusan Aset Air program, focused on modernizing water infrastructure, is currently replacing outdated pipes. This effort is boosting the use of cementitious grouts and polyurethane injection systems to address non-revenue water losses. On the private side, data-center operators emphasize the importance of high early-strength flooring mixes, fire-resistant coatings, and ESD flooring to maintain seamless 24-hour operations.
Affordable-Housing Push Expanding Residential Starts
Targeting affordable units, the Bakat Baru Madani initiative is driving up demand for water-borne adhesives, tile grouts, and waterproofing membranes in multi-story blocks. In Selangor and Johor, PR1MA projects are turning to Industrialized Building System precast panels. These panels, reliant on rapid-setting mortars and epoxy bonding agents, are crucial for meeting tight handover schedules. Recent years have seen a surge in construction work value, fueled by stamp duty exemptions and relaxed loan-to-value ratios that invigorated residential launches. While prefabricated bathroom pods and kitchen modules streamline on-site labor, they also amplify the demand for polyurethane sealants. This is essential, as joints must resist mold in the region's humid, tropical climate. The rising adoption of IBS panels is concurrently boosting the demand for admixtures in ready-mix concrete. Notably, superplasticizers are in demand to ensure consistent slump retention during prolonged transport.
Green-Building Certification Boosting Low-VOC and Durable Chemistries
In 2024, MAPEI Malaysia launched its ZERO Line, which offsets embodied carbon while attracting developers aiming for GBI Gold labels for their offices and mixed-use towers. In Negeri Sembilan, SPD Tech Valley, a sprawling park boasting a LEED Gold certification, mandates the use of low-emitting flooring resins and bio-based curing compounds for its warehouse slabs. With Phase 2 set to commence in the third quarter of 2026, the park is making significant progress in sustainable development. The COMPASS@KSL township in Selangor has adopted cool-roof coatings and reflective sealants. These innovations not only lower surface temperatures but also reduce cooling loads, leading to decreased operating costs throughout the asset's lifespan. Hilti Malaysia has taken a significant step by offering Environmental Product Declarations for its anchor systems. This initiative allows contractors to obtain GBI Materials and Resources credits without the need for additional testing. Meanwhile, Malaysia's Standard MS 2514:2014 has set a VOC emission cap for interior finishes. This regulation is driving manufacturers to transition from traditional solvent-borne products to more eco-friendly water-borne coatings and reactive systems.
Rapid Uptake of Ready-Mix and Prefab Systems Raising Admixture Penetration
In 2024, Polycarboxylate-ether superplasticizers dominated the global admixture landscape, a trend that was mirrored in Malaysia. Malaysian ready-mix suppliers are setting their sights on achieving 28-day strengths surpassing 50 MPa, especially for data-center mats and high-rise cores. Sika Malaysia highlights a sustained demand in data-center constructions. Operators are opting for self-consolidating concrete, augmented with viscosity-modifying agents and shrinkage reducers, to curb cracking in expansive slabs. MAPEI introduced Mapecube, a low-carbon admixture, in March 2025. This groundbreaking product reduces clinker usage without compromising workability, aligning with contractors' sustainability aspirations in public tenders. Precast plants serving Bakat Baru Madani are utilizing accelerators for 18-hour demold cycles. This approach facilitates two daily pours and significantly expedites project timelines. Air-entraining agents, which were once rare in tropical locales, are now being adopted for highland tunnels and bridge decks above 1,000 meters. Given their vulnerability to freeze-thaw cycles, these regions are prioritizing concrete integrity.
Restraints Impact Analysis*
| Restraints | (~) % Impact on CAGR Forecast | Geographic Relevance | Impact Timeline |
|---|---|---|---|
| Feedstock price volatility squeezing producer margins | -0.8% | National, affecting formulators dependent on imported resins and polymers | Short term (≤ 2 years) |
| Escalating EHS compliance costs | -0.6% | Urban centres enforcing MS 2514:2014 and Department of Environment air-quality standards | Medium term (2-4 years) |
| Shortage of trained applicators for advanced chemistries | -0.6% | Nationwide, with sharper gaps in Sabah, Sarawak and secondary cities without CIDB-certified training hubs | Medium term (2-4 years) |
| Source: Mordor Intelligence | |||
Feedstock Price Volatility Squeezing Producer Margins
By February 2026, cement wholesale prices rose, reducing blended-mortar margins for producers without long-term supply contracts. Epoxy resin precursors, closely tied to crude oil, experienced significant quarterly fluctuations during 2024–2025, complicating price quotations for multi-year rail and road packages. Investigations into the dumping of polycarboxylate-ether in neighboring markets increased import costs. As a result, local brands such as Dribond and Cemseal took advantage of price declines to build inventories, which strained their cash flows. Although calcium carbonate fillers remained stable, the congestion at Port Klang and Penang Port extended lead times for premium grades to several weeks. Despite plans for future resin plants in the Johor-Singapore Special Economic Zone, the uncertain timelines leave formulators exposed to currency fluctuations and freight surcharges, a situation likely to persist until 2027.
Escalating EHS Compliance Costs
In 2024, SIRIM QAS introduced a new indoor air-quality certification, which can delay product launches by several weeks. The Department of Environment, enforcing fines for VOC breaches, has prompted mid-tier manufacturers to adopt vapor-recovery systems and low-emission spray booths. Rules under the Occupational Safety and Health Act mandate closed-loop mixing for MEK and toluene blends, compelling SMEs to invest in automated equipment. In 2025, new 16-hour Green Card modules were introduced to teach site applicators low-VOC handling. However, with enrollment still low, approvals for green projects are being postponed. Local players should prepare for increased testing costs in the coming years, as continuous updates to MS ISO 16000 indoor air-quality protocols are expected to stretch compliance budgets during the forecast period of 2026–2031.
*Our forecasts treat driver/restraint impacts as directional, not additive. The impact forecasts reflect baseline growth, mix effects, and variable interactions.
Segment Analysis
By Product: Waterproofing Dominance Meets Surface-Treatment Acceleration
In 2025, Waterproofing Solutions captured a 48.51% share of the revenue, underscoring Malaysia's vulnerability to monsoons and the Pengurusan Aset Air initiative, which targets seepage issues in aging pipelines. While bituminous membranes and cementitious slurries dominate basements and tunnels, polyurethane liquid-applied systems are becoming increasingly popular in data centers. Their seamless coverage and ability to return to service in just one day help mitigate rental losses. Surface-Treatment Chemicals are projected to grow at the fastest 7.12% CAGR through the forecast period of 2026–2031. This surge is attributed to precast yards utilizing curing compounds and mold-release agents, expediting turnover for IBS panels in affordable housing projects. Concrete Admixtures, vital for ready-mix suppliers, are capturing a larger market share. As contractors aim for higher strengths within 28 days, the Malaysia construction chemicals market size for these admixtures in high-rise projects is set to represent a significant portion of the overall value by 2031. Following the MS 2514:2014 standard, adhesives are transitioning to water-borne grades. Meanwhile, Flooring Resins are witnessing strong growth in cleanrooms and pharmaceutical suites, where static control is paramount. Silicones, a type of sealant, remain steadfast in façade glazing due to their non-negotiable ultraviolet stability. Although Repair and Rehabilitation Chemicals face challenges, primarily a shortage of CIDB-certified applicators, they present the most significant untapped potential in the Malaysian construction chemicals market.
Despite the diverse product range, the Malaysian construction chemicals market heavily relies on imported polycarboxylate-ether and epoxy feedstocks. This dependency exposes formulators to freight volatility, squeezing their profit margins. Establishing resin plants within the Johor-Singapore SEZ might reshape cost dynamics, but any significant change is anticipated after 2028. In the interim, producers are mitigating risks through multi-currency contracts, diversifying their supplier base, and implementing dynamic pricing clauses. These strategies enable them to transfer a portion of cost spikes to project owners. Contractors are willing to absorb these escalated costs, recognizing that service life and warranty terms play a pivotal role in total-cost-of-ownership assessments. This is especially true for lucrative data-center projects, where any downtime is unacceptable.


By End-Use Sector: Industrial Surge Outpaces Commercial Stability
In 2025, the commercial sector, supported by malls, hotels, and office towers in Kuala Lumpur, Johor Bahru, and Penang, secured a 32.45% share of the revenue. At the same time, investments in data centers and green-certified parks, such as SPD Tech Valley, are accelerating industrial and institutional demand at a 6.22% CAGR in the forecast period (2026-2031). SPD Tech Valley, spanning a vast area, emphasizes features such as low-VOC flooring and high-early-strength admixtures. Facilities in this park prioritize rapid hardening, ESD compliance, and ISO-class cleanroom coatings, all of which command premium prices in Malaysia's construction chemicals market. Infrastructure projects, including the East Coast Rail Link, Pan Borneo Highway, and various dam rehabilitations, are driving consistent demand for crack-injection resins and protective coatings during the forecast period of 2026–2031.
Residential construction has gained momentum from Bakat Baru Madani’s affordable housing initiative and PR1MA’s apartment pipeline. Both projects rely on IBS panels, which, in turn, amplify the demand for admixture in Malaysia's construction chemicals market. Contractors are increasingly opting for accelerators and self-compacting mixes, achieving 18-hour demold cycles and enabling two daily pours. Furthermore, stringent green rating regulations channel waterproofing tasks to suppliers certified for low-VOC membranes. Consequently, even as commercial towers face challenges from remote work trends, Malaysia's construction chemicals industry continues to thrive, driven by industrial campuses and prefab housing.
Geography Analysis
In 2025, Peninsular Malaysia emerged as the frontrunner in the construction chemicals market, capturing a significant share. Key regions such as Selangor, Johor, and Penang led this surge, bolstered by their dense populations, strategic port access, and favorable federal allocations. The 665-kilometer East Coast Rail Link (ECRL), stretching from Port Klang to Kota Bharu, has been actively employing epoxy anchors and shrinkage reducers on its viaducts, significantly enhancing east-west logistics. Johor is witnessing a surge in prominence, largely due to the Johor-Singapore Special Economic Zone, which is rolling out enticing investment allowances. These incentives hint at the potential establishment of resin plants, bringing the construction chemicals market in closer proximity to its end-users.
Sabah and Sarawak, having secured a federal fund for 2026, are witnessing a heightened demand for bituminous membranes, admixtures, and pavement sealants along the Pan Borneo Highway. Notably, logistics mark-ups in this region often surpass those in Peninsular Malaysia. Penang's Mutiara Light Rail Transit, slated for completion by 2027, is driving up the demand for tunnel grouting and fire-resistant coatings. Additionally, the Air Itam Dam upgrade is gearing up to employ polymer repair mortars until late 2026. With data centers increasingly clustering in Cyberjaya, Shah Alam, and Iskandar Malaysia, suppliers are finding it essential to maintain buffer stocks. Sika Malaysia, boasting six plants and a robust local production capacity, is strategically positioned to ensure swift site deliveries, reinforcing its dominance in the Malaysian construction chemicals market during the forecast period of 2026–2031.
Competitive Landscape
The Malaysia construction chemicals market is moderately fragmented. Multinational firms leverage global research and Environmental Product Declarations. However, they face margin pressures from agile local players. Local competitors tailor manuals in Bahasa Malaysia and provide flexible minimum order quantities. While Penang, Malacca, and Kuala Lumpur grapple with a clear maintenance backlog, the demand for repair chemicals is stifled by a shortage of CIDB-certified applicators. However, with rising technology adoption, MAPEI’s ZERO Line integrates carbon offsets with solar arrays. At the same time, Sika’s self-consolidating mixes deliver crack-free slabs for major clients. These innovations highlight the seamless integration of sustainability and performance in Malaysia's construction chemicals sector.
Malaysia Construction Chemicals Industry Leaders
Sika AG
MAPEI S.p.A.
RPM International
Saint-Gobain
Ducon Construction Chemicals
- *Disclaimer: Major Players sorted in no particular order

Recent Industry Developments
- March 2026: Ducol Organics & Colours Limited announced a strategic partnership with Malaysia-based Qualibit Chemicals & Industries to expand its waterproofing and construction chemicals portfolio. Under this collaboration, Ducol supplied waterproofing systems, manufactured through its subsidiary Bitumag, to Qualibit’s established manufacturing and market network.
- February 2025: Saint-Gobain has finalized its acquisition of Fosroc, a prominent global player in construction chemicals, significantly enhancing its presence across India, the Middle East, and the Asia-Pacific region. This strategic move, announced in June 2024 and completed in February 2025, marks a pivotal expansion of Saint-Gobain’s construction chemicals portfolio.


Malaysia Construction Chemicals Market Report Scope
Construction chemicals are specialized chemical formulations added to or applied on masonry materials, cement, or concrete to enhance their performance, durability, workability, and, in many cases, to provide waterproof properties. They are crucial for improving the longevity and structural integrity of modern construction projects, often preventing long-term structural degradation.
The Malaysia construction chemicals market is segmented by product and end-use sector. By product type, the market is segmented into adhesives, anchors and grouts, concrete admixtures, concrete protective coatings, flooring resins, repair and rehabilitation chemicals, sealants, surface-treatment chemicals, and waterproofing solutions. By end-use sector, the market is segmented into commercial, industrial and institutional, infrastructure, and residential. For each segment, the market sizing and forecasts are done based on value (USD).
| Adhesives | Hot-Melt |
| Reactive | |
| Solvent-borne | |
| Water-borne | |
| Anchors and Grouts | Cementitious Fixing |
| Resin Fixing | |
| Concrete Admixtures | Accelerator |
| Air-Entraining | |
| Super-plasticizer | |
| Retarder | |
| Shrinkage-Reducer | |
| Viscosity-Modifier | |
| Plasticizer | |
| Other Types | |
| Concrete Protective Coatings | Acrylic |
| Alkyd | |
| Epoxy | |
| Polyurethane | |
| Other Resins | |
| Flooring Resins | Acrylic |
| Epoxy | |
| Polyaspartic | |
| Polyurethane | |
| Other Resins | |
| Repair and Rehabilitation Chemicals | Fiber-Wrapping Systems |
| Injection Grouting | |
| Micro-concrete Mortars | |
| Modified Mortars | |
| Rebar Protectors | |
| Sealants | Acrylic |
| Epoxy | |
| Polyurethane | |
| Silicone | |
| Other Resins | |
| Surface-Treatment Chemicals | Curing Compounds |
| Mold-Release Agents | |
| Other Types | |
| Waterproofing Solutions | Chemicals |
| Membranes |
| Commercial |
| Industrial and Institutional |
| Infrastructure |
| Residential |
| By Product | Adhesives | Hot-Melt |
| Reactive | ||
| Solvent-borne | ||
| Water-borne | ||
| Anchors and Grouts | Cementitious Fixing | |
| Resin Fixing | ||
| Concrete Admixtures | Accelerator | |
| Air-Entraining | ||
| Super-plasticizer | ||
| Retarder | ||
| Shrinkage-Reducer | ||
| Viscosity-Modifier | ||
| Plasticizer | ||
| Other Types | ||
| Concrete Protective Coatings | Acrylic | |
| Alkyd | ||
| Epoxy | ||
| Polyurethane | ||
| Other Resins | ||
| Flooring Resins | Acrylic | |
| Epoxy | ||
| Polyaspartic | ||
| Polyurethane | ||
| Other Resins | ||
| Repair and Rehabilitation Chemicals | Fiber-Wrapping Systems | |
| Injection Grouting | ||
| Micro-concrete Mortars | ||
| Modified Mortars | ||
| Rebar Protectors | ||
| Sealants | Acrylic | |
| Epoxy | ||
| Polyurethane | ||
| Silicone | ||
| Other Resins | ||
| Surface-Treatment Chemicals | Curing Compounds | |
| Mold-Release Agents | ||
| Other Types | ||
| Waterproofing Solutions | Chemicals | |
| Membranes | ||
| By End-Use Sector | Commercial | |
| Industrial and Institutional | ||
| Infrastructure | ||
| Residential | ||


Market Definition
- END-USE SECTOR - Construction chemicals consumed in the construction sectors such as commercial, residential, industrial, institutional, and infrastructure are considered under the scope of the study.
- PRODUCT/APPLICATION - Under the scope of the study, the consumption of construction chemical products such as concrete admixtures, repair and rehabilitation chemicals, flooring resins, waterproofing solutions, anchors and grouts, adhesives and sealants, and surface treatment chemicals is considered.
| Keyword | Definition |
|---|---|
| Accelerator | Accelerators are admixtures used to fasten the setting time of concrete by increasing the initial rate and speeding up the chemical reaction between cement and the mixing water. These are used to harden and increase the strength of concrete quickly. |
| Acrylic | This synthetic resin is a derivative of acrylic acid. It forms a smooth surface and is mainly used for various indoor applications. The material can also be used for outdoor applications with a special formulation. |
| Adhesives | Adhesives are bonding agents used to join materials by gluing. Adhesives can be used in construction for many applications, such as carpet laying, ceramic tiles, countertop lamination, etc. |
| Air Entraining Admixture | Air-entraining admixtures are used to improve the performance and durability of concrete. Once added, they create uniformly distributed small air bubbles to impart enhanced properties to the fresh and hardened concrete. |
| Alkyd | Alkyds are used in solvent-based paints such as construction and automotive paints, traffic paints, flooring resins, protective coatings for concrete, etc. Alkyd resins are formed by the reaction of an oil (fatty acid), a polyunsaturated alcohol (Polyol), and a polyunsaturated acid or anhydride. |
| Anchors and Grouts | Anchors and grouts are construction chemicals that stabilize and improve the strength and durability of foundations and structures like buildings, bridges, dams, etc. |
| Cementitious Fixing | Cementitious fixing is a process in which a cement-based grout is pumped under pressure to fill forms, voids, and cracks. It can be used in several settings, including bridges, marine applications, dams, and rock anchors. |
| Commercial Construction | Commercial construction comprises new construction of warehouses, malls, shops, offices, hotels, restaurants, cinemas, theatres, etc. |
| Concrete Admixtures | Concrete admixtures comprise water reducers, air entrainers, retarders, accelerators, superplasticizers, etc., added to concrete before or during mixing to modify its properties. |
| Concrete Protective Coatings | To provide specific protection, such as anti-carbonation or chemical resistance, a film-forming protective coat can be applied on the surface. Depending on the applications, different resins like epoxy, polyurethane, and acrylic can be used for concrete protective coatings. |
| Curing Compounds | Curing compounds are used to cure the surface of concrete structures, including columns, beams, slabs, and others. These curing compounds keep the moisture inside the concrete to give maximum strength and durability. |
| Epoxy | Epoxy is known for its strong adhesive qualities, making it a versatile product in many industries. It resists heat and chemical applications, making it an ideal product for anyone needing a stronghold under pressure. It is widely used in adhesives, electrical and electronics, paints, etc. |
| Fiber Wrapping Systems | Fiber Wrapping Systems are a part of construction repair and rehabilitation chemicals. It involves the strengthening of existing structures by wrapping structural members like beams and columns with glass or carbon fiber sheets. |
| Flooring Resins | Flooring resins are synthetic materials applied to floors to enhance their appearance, increase their resistance to wear and tear or provide protection from chemicals, moisture, and stains. Depending on the desired properties and the specific application, flooring resins are available in distinct types, such as epoxy, polyurethane, and acrylic. |
| High-Range Water Reducer (Super Plasticizer) | High-range water reducers are a type of concrete admixture that provides enhanced and improved properties when added to concrete. These are also called superplasticizers and are used to decrease the water-to-cement ratio in concrete. |
| Hot Melt Adhesives | Hot-melt adhesives are thermoplastic bonding materials applied as melts that achieve a solid state and resultant strength on cooling. They are commonly used for packaging, coatings, sanitary products, and tapes. |
| Industrial and Institutional Construction | Industrial and institutional construction includes new construction of hospitals, schools, manufacturing units, energy and power plants, etc. |
| Infrastructure Construction | Infrastructure construction includes new construction of railways, roads, seaways, airports, bridges, highways, etc. |
| Injection Grouting | The process of injecting grout into open joints, cracks, voids, or honeycombs in concrete or masonry structural members is known as injection grouting. It offers several benefits, such as strengthening a structure and preventing water infiltration. |
| Liquid-Applied Waterproofing Membranes | Liquid-Applied membrane is a monolithic, fully bonded, liquid-based coating suitable for many waterproofing applications. The coating cures to form a rubber-like elastomeric waterproof membrane and may be applied over many substrates, including asphalt, bitumen, and concrete. |
| Micro-concrete Mortars | Micro-concrete mortar is made up of cement, water-based resin, additives, mineral pigments, and polymers and can be applied on both horizontal and vertical surfaces. It can be used to refurbish residential complexes, commercial spaces, etc. |
| Modified Mortars | Modified Mortars include Portland cement and sand along with latex/polymer additives. The additives increase adhesion, strength, and shock resistance while also reducing water absorption. |
| Mold Release Agents | Mold release agents are sprayed or coated on the surface of molds to prevent a substrate from bonding to a molding surface. Several types of mold release agents, including silicone, lubricant, wax, fluorocarbons, and others, are used based on the type of substrates, including metals, steel, wood, rubber, plastic, and others. |
| Polyaspartic | Polyaspartic is a subset of polyurea. Polyaspartic floor coatings are typically two-part systems that consist of a resin and a catalyst to ease the curing process. It offers high durability and can withstand harsh environments. |
| Polyurethane | Polyurethane is a plastic material that exists in various forms. It can be tailored to be either rigid or flexible and is the material of choice for a broad range of end-user applications, such as adhesives, coatings, building insulation, etc. |
| Reactive Adhesives | A reactive adhesive is made of monomers that react in the adhesive curing process and do not evaporate from the film during use. Instead, these volatile components become chemically incorporated into the adhesive. |
| Rebar Protectors | In concrete structures, rebar is one of the important components, and its deterioration due to corrosion is a major issue that affects the safety, durability, and life span of buildings and structures. For this reason, rebar protectors are used to protect against degrading effects, especially in infrastructure and industrial construction. |
| Repair and Rehabilitation Chemicals | Repair and Rehabilitation Chemicals include repair mortars, injection grouting materials, fiber wrapping systems, micro-concrete mortars, etc., used to repair and restore existing buildings and structures. |
| Residential Construction | Residential construction involves constructing new houses or spaces like condominiums, villas, and landed homes. |
| Resin Fixing | The process of using resins like epoxy and polyurethane for grouting applications is called resin fixing. Resin fixing offers several advantages, such as high compressive and tensile strength, negligible shrinkage, and greater chemical resistance compared to cementitious fixing. |
| Retarder | Retarders are admixtures used to slow down the setting time of concrete. These are usually added with a dosage rate of around 0.2% -0.6% by weight of cement. These admixtures slow down hydration or lower the rate at which water penetrates the cement particles by making concrete workable for a long time. |
| Sealants | A sealant is a viscous material that has little or no flow qualities, which causes it to remain on surfaces where they are applied. Sealants can also be thinner, enabling penetration to a certain substance through capillary action. |
| Sheet Waterproofing Membranes | Sheet membrane systems are reliable and durable thermoplastic waterproofing solutions that are used for waterproofing applications even in the most demanding below-ground structures, including those exposed to highly aggressive ground conditions and stress. |
| Shrinkage Reducing Admixture | Shrinkage-reducing admixtures are used to reduce concrete shrinkage, whether from drying or self-desiccation. |
| Silicone | Silicone is a polymer that contains silicon combined with carbon, hydrogen, oxygen, and, in some cases, other elements. It is an inert synthetic compound that comes in various forms, such as oil, rubber, and resin. Due to its heat-resistant properties, it finds applications in sealants, adhesives, lubricants, etc. |
| Solvent-borne Adhesives | Solvent-borne adhesives are mixtures of solvents and thermoplastic or slightly cross-linked polymers such as polychloroprene, polyurethane, acrylic, silicone, and natural and synthetic rubbers. |
| Surface Treatment Chemicals | Surface treatment chemicals are chemicals used to treat concrete surfaces, including roofs, vertical surfaces, and others. They act as curing compounds, demolding agents, rust removers, and others. They are cost-effective and can be used on roadways, pavements, parking lots, and others. |
| Viscosity Modifier | Viscosity Modifiers are concrete admixtures used to change various properties of admixtures, including viscosity, workability, cohesiveness, and others. These are usually added with a dosage of around 0.01% to 0.1% by weight of cement. |
| Water Reducer | Water reducers, also called plasticizers, are a type of admixture used to decrease the water-to-cement ratio in the concrete, thereby increasing the durability and strength of concrete. Various water reducers include refined lignosulfonates, gluconates, hydroxycarboxylic acids, sugar acids, and others. |
| Water-borne Adhesives | Water-borne adhesives use water as a carrier or diluting medium to disperse resin. They are set by allowing the water to evaporate or be absorbed by the substrate. These adhesives are compounded with water as a dilutant rather than a volatile organic solvent. |
| Waterproofing Chemicals | Waterproofing chemicals are designed to protect a surface from the perils of leakage. A waterproofing chemical is a protective coating or primer applied to a structure's roof, retaining walls, or basement. |
| Waterproofing Membranes | Waterproofing membranes are liquid-applied or self-adhering layers of water-tight materials that prevent water from penetrating or damaging a structure when applied to roofs, walls, foundations, basements, bathrooms, and other areas exposed to moisture or water. |


Research Methodology
Mordor Intelligence follows a four-step methodology in all our reports.
- Step-1: Identify Key Variables: The quantifiable key variables (industry and extraneous) pertaining to the specific product segment and country are selected from a group of relevant variables & factors based on desk research & literature review; along with primary expert inputs. These variables are further confirmed through regression modeling (wherever required).
- Step-2: Build a Market Model: In order to build a robust forecasting methodology, the variables and factors identified in Step-1 are tested against available historical market numbers. Through an iterative process, the variables required for market forecast are set and the model is built on the basis of these variables.
- Step-3: Validate and Finalize: In this important step, all market numbers, variables and analyst calls are validated through an extensive network of primary research experts from the market studied. The respondents are selected across levels and functions to generate a holistic picture of the market studied.
- Step-4: Research Outputs: Syndicated Reports, Custom Consulting Assignments, Databases & Subscription Platforms


