South America Construction Chemicals Market Size and Share
Market Overview
| Study Period | 2020 - 2031 |
|---|---|
| Forecast Data Period | 2026 - 2031 |
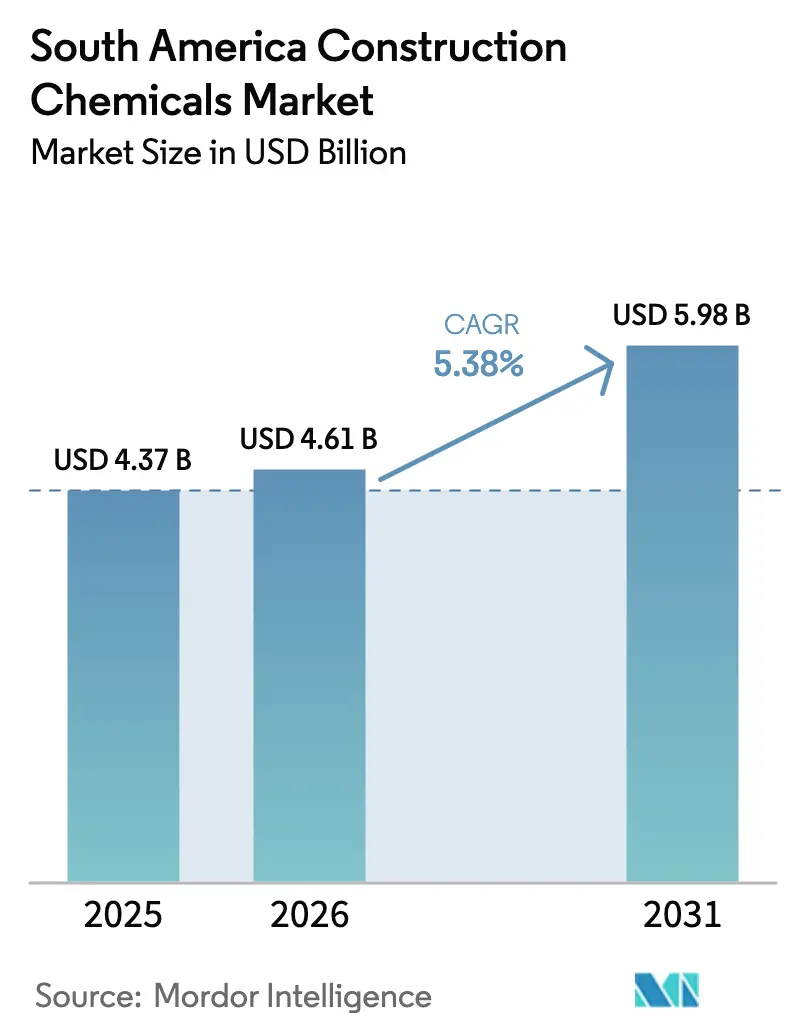
| Base Year Market Size (2025) | USD 4.37 Billion |
| Market Size (2026) | USD 4.61 Billion |
| Market Size (2031) | USD 5.98 Billion |
| Growth Rate (2026 - 2031) | 5.38% CAGR |
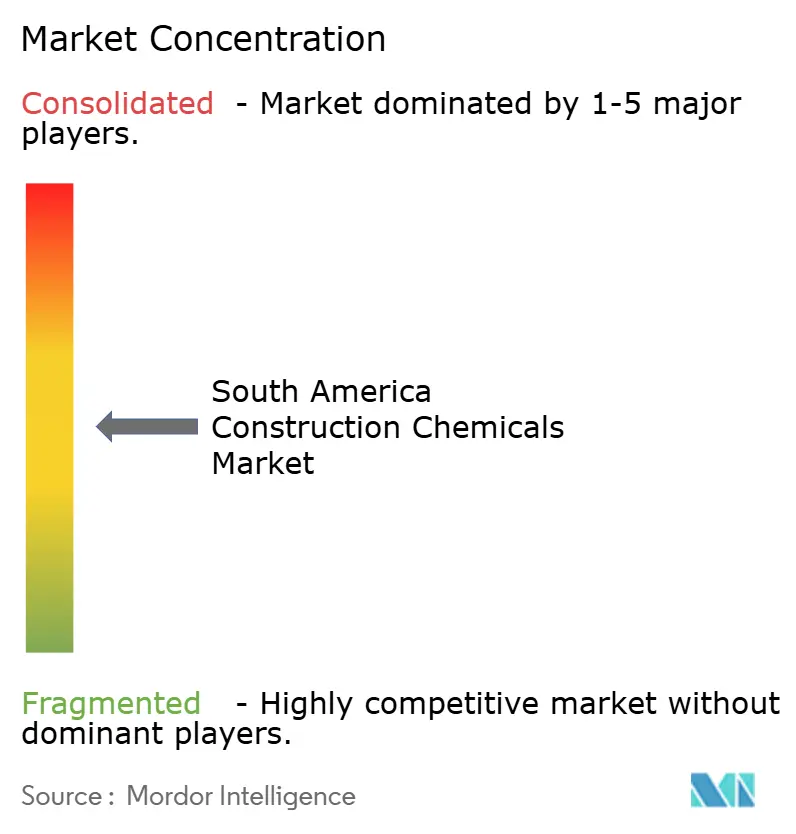
| Market Concentration | Medium |
Major Players *Disclaimer: Major Players sorted in no particular order Image © Mordor Intelligence. Reuse requires attribution under CC BY 4.0. | |
South America Construction Chemicals Market Analysis by Mordor Intelligence
The South America Construction Chemicals Market size was valued at USD 4.37 billion in 2025 and estimated to grow from USD 4.61 billion in 2026 to reach USD 5.98 billion by 2031, at a CAGR of 5.38% during the forecast period (2026-2031). Robust public–private infrastructure pipelines, wider mortgage availability, and a swift transition toward ready-mix concrete across the region underpin steady gains. Brazil’s scale advantage in cement production, growing adoption of low-carbon admixtures, and rising specification of premium waterproofing membranes reinforce demand resilience despite currency headwinds. Global suppliers are localizing production and research and development to counter freight costs and deliver tailored solutions for diverse climatic zones, while ESG mandates are accelerating uptake of performance-enhancing, low-VOC formulations. Renewable-energy construction, particularly utility-scale solar, has created a niche but rapidly growing market for specialty anchors, sealants, and protective coatings, as project developers require 25-year service life guarantees.
Key Report Takeaways
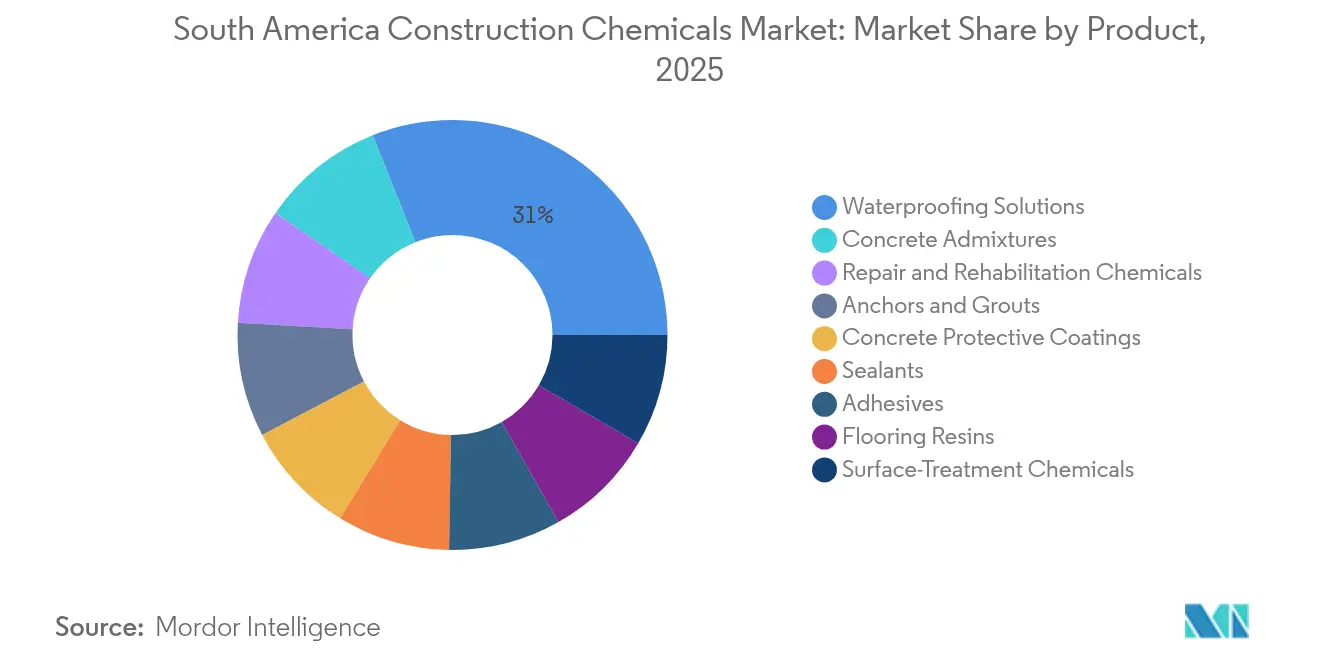
- By product type, waterproofing solutions led the South American construction chemicals market, accounting for a 31.05% share in 2025. Concrete admixtures are projected to record the fastest 6.32% CAGR through 2031.
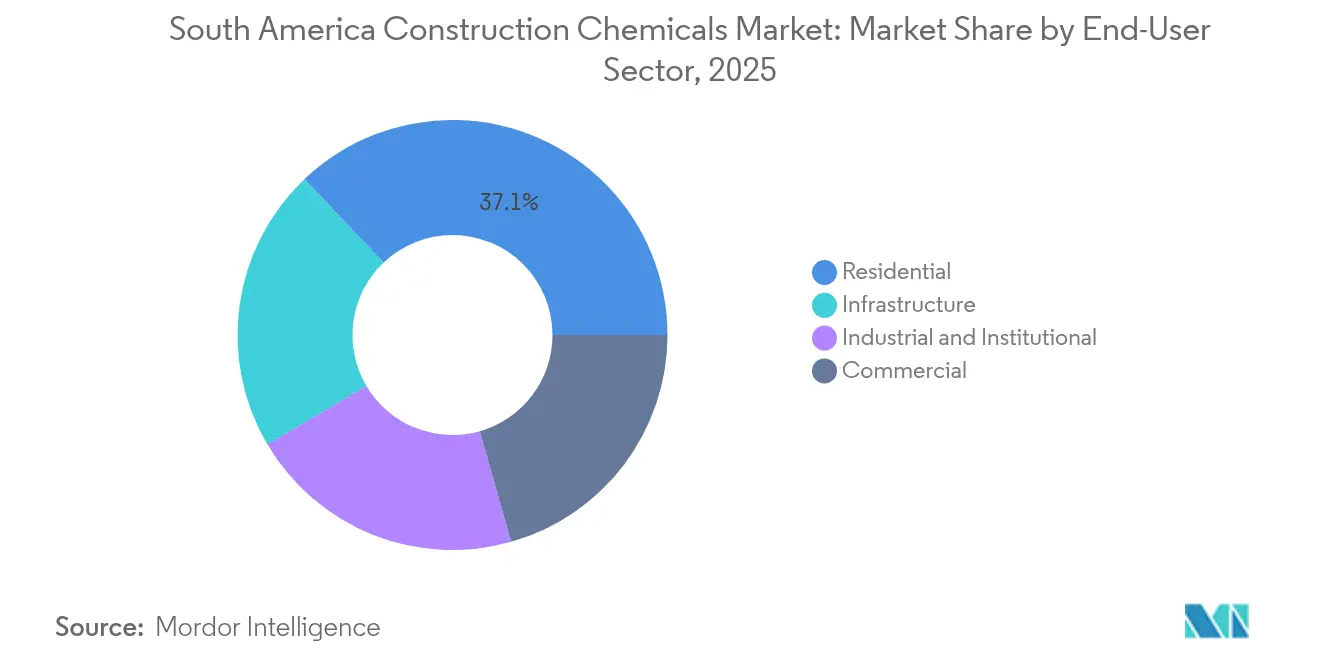
- By end-user sector, the residential construction sector accounted for 37.10% of the South American construction chemicals market size in 2025 and is expected to grow at a 6.05% CAGR to 2031.
- By geography, Brazil captured 62.10% revenue share in 2025; the country is anticipated to post a 5.82% CAGR between 2026 and 2031.
Note: Market size and forecast figures in this report are generated using Mordor Intelligence’s proprietary estimation framework, updated with the latest available data and insights as of 2026.
South America Construction Chemicals Market Trends and Insights
Drivers Impact Analysis*
| Drivers | (~) % Impact on CAGR Forecast | Geographic Relevance | Impact Timeline |
|---|---|---|---|
| Infrastructure stimulus via PPP mega-projects pipeline | +1.8% | Brazil, Colombia, Peru | Medium term (2-4 years) |
| Housing-finance programs expanding affordable mortgages | +1.5% | Brazil, Argentina, Colombia | Short term (≤ 2 years) |
| Rapid penetration of ready-mix and precast ecosystems | +1.2% | São Paulo, Buenos Aires, Bogotá | Medium term (2-4 years) |
| ESG-linked cement credits pushing high-performance admixtures | +0.9% | Brazil, Chile | Long term (≥ 4 years) |
| Turnkey solar-plus-storage farms driving chemical anchoring demand | +0.4% | Brazil, Chile, Argentina | Long term (≥ 4 years) |
| Source: Mordor Intelligence | |||


Infrastructure Stimulus via PPP Mega-Projects Pipeline
The South America construction chemicals market is benefiting from a multi-year infrastructure build-out financed through PPP frameworks that specify premium formulations for metro tunnels, bridges, and highways. São Paulo’s USD 6 billion 2025 public works program allocates significant funding to urban-mobility corridors, which require high-performance waterproofing membranes and crack-resistant admixtures. Brazil’s USD 27 billion highway concession round amplifies demand for expansion-joint sealants and protective deck coatings. Peru is advancing a USD 1 billion transport modernization package, further propelling region-wide consumption of specialty grouts and bonding agents. These projects often bundle long-term maintenance contracts that favor durable, value-added chemical solutions, enhancing average selling prices. As a result, manufacturers that can validate life-cycle cost benefits are consolidating specifications across multiple jurisdictions, securing repeat orders and enhancing market value beyond mere volumetric growth.
Housing-Finance Programs Expanding Affordable Mortgages
Easier mortgage qualification criteria and subsidized lending schemes are re-energizing residential construction starts. Brazil’s Casa Verde e Amarela program continues to funnel low-interest loans into starter homes, leading to a 5.9% year-over-year rise in Q1 2025 cement sales[1]SNIC, “Vendas de Cimento Crescem 5,9% no 1º Trimestre de 2025,” snic.org.br . New builds and renovations alike favor acrylic waterproofing coatings, tile adhesives, and eco-friendly interior sealants as homeowners invest in longevity and energy efficiency. Argentina’s national mortgage fund has reopened fixed-rate lines to middle-income buyers, stimulating pent-up demand for cementitious grouts and polymer flooring resins even amid macro-volatility. Colombian policymakers have capped variable mortgage rates, enabling developers to resume mid-rise apartment projects that specify ready-mix concrete enhanced with superplasticizers. In tandem, regional retailers are expanding do-it-yourself product ranges, nudging small contractors toward branded chemical solutions with technical after-sales support.
Rapid Penetration of Ready-Mix and Precast Ecosystems
Industrialized concrete production is a major structural driver for the South America construction chemicals market. More than 70% of urban concrete in Brazil is now batch-produced, lifting chemical dosage rates from 3% to around 6% of cement weight. Automated mixing plants require precise control of the water-cement ratio, which in turn accelerates the uptake of polycarboxylate superplasticizers and set-retarding admixtures. Argentina’s precast sector has adopted 3D-printed molds and IoT-enabled curing chambers, both of which demand consistent chemical performance to meet dimensional tolerances. Bogotá’s builders are embracing modular bathroom pods that rely on high-bond epoxies and fast-setting grouts to meet compressed schedules. Standardization is prompting contractors to favor multinational brands that can guarantee product homogeneity across job sites, thus reinforcing market share for incumbents with regional supply chains.
ESG-Linked Cement Credits Pushing High-Performance Admixtures
Carbon-abatement targets are rewriting cement chemistry and, by extension, construction chemical demand patterns. Brazil’s cement producers are substituting slag, fly ash, and limestone filler to reduce clinker ratios, a move that necessitates the use of compatibility agents and strength-enhancing admixtures. MAPEI’s C-ADD line demonstrates that tailored polycarboxylate dispersants can trim clinker by 4-6% without sacrificing 28-day compressive strength. Chilean regulators are increasingly requiring Environmental Product Declarations for public projects, making low-carbon admixture packages a prerequisite during the tendering process. ESG-linked project financing offers interest-rate step-downs when lower embodied CO₂ thresholds are achieved, providing direct monetary incentives for chemical adoption. Suppliers able to validate carbon reductions with third-party data are capturing price premiums and gaining specification priority in high-visibility projects.
Restraints Impact Analysis*
| Restraints | (~) % Impact on CAGR Forecast | Geographic Relevance | Impact Timeline |
|---|---|---|---|
| Currency volatility inflating imported raw-material costs | -1.4% | Argentina, Brazil | Short term (≤ 2 years) |
| Fragmented contractor base with low specification discipline | -0.8% | Region-wide, smaller markets | Medium term (2-4 years) |
| Compliance burden from evolving VOC and waste-water norms | -0.5% | Brazil, Chile | Long term (≥ 4 years) |
| Source: Mordor Intelligence | |||
Currency Volatility Inflating Imported Raw-Material Costs
Sharp exchange-rate swings increase landed costs for polymers, epoxies, and specialty additives, which are largely sourced from Asia or the United States. Argentine producers have raised list prices multiple times since 2024 to offset peso depreciation, but pass-through is limited in public tenders governed by fixed-price contracts. Brazilian manufacturers hedge dollar-denominated feedstock purchases, yet volatility complicates inventory planning and extends working-capital cycles. Local substitution remains limited due to scale constraints and a lack of precursor chemicals, leaving the South American construction chemicals market vulnerable to foreign exchange risk. Firms with regional production footprints are therefore rationalizing their SKUs toward higher-margin formulations to preserve profitability during import cost spikes.
Fragmented Contractor Base with Low Specification Discipline
Roughly half of all housing units built in South America each year rely on micro-contractors employing fewer than five workers. Many lack formal training on admixture dosage or the application of waterproofing membranes, leading to the underuse or misuse of chemicals. Field studies indicate that less than 60% of concrete used in small residential projects in Colombia contains any admixture[2]Camacol, “Perspectivas Económicas del Sector Constructor 2025,” camacol.co. Multinational vendors have responded with simplified, all-in-one formulations and mobile training labs; however, adoption still lags behind developed-market benchmarks. The resulting inconsistent performance sometimes erodes trust in advanced products, slowing repeat purchases and compressing potential market volume.
*Our forecasts treat driver/restraint impacts as directional, not additive. The impact forecasts reflect baseline growth, mix effects, and variable interactions.
Segment Analysis
By Product: Growth Momentum From Admixtures and Waterproofing Solutions
Waterproofing Solutions accounted for 31.05% of the South America construction chemicals market share in 2025, anchored by mandatory basement tanking in downtown São Paulo and widespread roof-leak remediation across tropical zones. Persistent rainfall patterns in the Amazon basin have made liquid-applied membranes and crystalline capillary systems a contractor staple. Conversely, Concrete Admixtures are projected to expand at a 6.32% CAGR over 2026-2031, thus outpacing all other product families. This acceleration reflects stricter strength-gain requirements in ready-mix operations and the proliferation of blended-cement protocols aimed at cutting clinker emissions. Superplasticizers, leveraging third-generation polycarboxylate ethers, are gaining traction because they deliver 25 MPa compressive strength within 48 hours, allowing for faster formwork reuse. Anchors and Grouts, though smaller in absolute terms, are enjoying an uptick aligned with utility-scale solar installations, while Repair and Rehabilitation Chemicals find a steady niche in bridge-deck overlay programs across Brazil’s federal highway network.
Contractors continue to value multi-functional adhesives that combine high shear strength with extended open time, driving incremental upgrades in tile-setting compounds across Argentina’s mid-rise residential projects. Surface-Treatment Chemicals, including water-repellent silanes and anti-graffiti coatings, are seeing adoption in revitalization programs for historic city centers, particularly in Peru and Chile. Flooring Resins, dominated by epoxy self-leveling systems, capture demand from food-processing plants and logistics warehouses that require hygienic, abrasion-resistant floors. Collectively, these trends underscore the product-diversity advantage enjoyed by full-line suppliers within the South America construction chemicals market.


By End-User Sector: Residential Construction Retains the Growth Lead
The residential segment accounted for 37.10% of the South American construction chemicals market size in 2025 and is projected to grow at a 6.05% CAGR through 2031. Mortgage-driven greenfield development in Brazil’s north-eastern cities and incremental self-build upgrades in peri-urban Argentina both stimulate demand for waterproofing tapes, tile adhesives, and acrylic wall putties. Energy-efficient retrofits are also expanding, with Brazil’s national energy agency subsidizing cool-roof coatings that cut cooling loads by 20%. Infrastructure stood as the next-largest outlet, buoyed by concessions in toll roads, ports, and mass-transit lines that specify long-life admixtures and protective coatings. Commercial construction is experiencing moderate momentum, driven by e-commerce warehousing and healthcare facility expansion. Industrial and institutional buildings, including lithium-processing plants in northern Chile and university campus additions in Colombia, require chemical-resistant flooring and linings that can withstand aggressive chemicals. Across all sectors, contractors are increasingly incorporating digital project-management tools that integrate chemical dosage data, enabling traceability and reinforcing performance-based procurement.
Geography Analysis
Brazil sustained a commanding 62.10% share of the South America construction chemicals market in 2025, supported by the world’s sixth-largest cement industry, and is experiencing a growth of 5.82%. Federal highway upgrade contracts mandate epoxy expansion joint systems that extend service intervals to 15 years, generating consistent demand. Large-scale residential programs under the Minha Casa Minha Vida banner are driving acrylic waterproofing volumes, while industrial parks in Minas Gerais adopt self-leveling epoxy floors to meet HACCP standards. São Paulo’s infrastructure budget is earmarked for metro extensions that specify crystalline admixtures for tunnel linings, further consolidating Brazil’s leadership.
Argentina ranks second in value but experienced a downturn in overall construction output in 2024, as reflected in a 24% decline in cement consumption, as reported by INDEC. Nevertheless, urban refurbishment projects in Buenos Aires have boosted sales of elastomeric coatings, and oil-pipeline upgrades in Neuquén continue to require anti-corrosion linings. Argentina’s manufacturers mitigate currency risk by increasing local resin integration, thereby reducing their reliance on imported epoxy precursors. The rest of South America, which includes Colombia, Chile, Peru, Ecuador, and Uruguay, delivers growth diversification. Chile’s updated timber-preservation guidelines are accelerating shifts to copper-organic preservatives, a sub-category with higher value density. Peru’s emphasis on transport corridors is synchronized with local manufacturing investments by multinational vendors, shortening lead times for water-borne membrane systems. Across these markets, policy frameworks that encourage low-carbon construction amplify the adoption of high-performance chemical solutions.
Competitive Landscape
The South America construction chemicals market exhibits moderate fragmentation. Competitive strategy centers on regional manufacturing footprints to circumvent import tariffs and currency shocks. Technology differentiation leans heavily on low-carbon formulations, with suppliers introducing bio-based polyols, lower-clinker cements, and water-borne coatings. Digital application-support tools, including dosage-calculation apps and QR-coded tech sheets, help bridge knowledge gaps within fragmented contractor ecosystems. Local players leverage proximity and relationships to capture small-batch orders, while multinationals command specification preferences on flagship projects due to their documented performance histories.
South America Construction Chemicals Industry Leaders
Sika AG
MAPEI S.p.A.
Saint-Gobain
Arkema
Votorantim Cimentos
- *Disclaimer: Major Players sorted in no particular order

Recent Industry Developments
- June 2025: Sika AG announced a strategic expansion of its manufacturing footprint in Brazil, reinforcing its commitment to the South American construction chemicals market. The company has extended its site near Belo Horizonte, located in Minas Gerais. The upgraded facility now includes admixture production, enabling Sika to better serve regional demand for high-performance concrete solutions across ready-mix, cement, and mining applications.
- November 2024: Mapei Colombia has expanded its operations since launching a plant in Sábana Grande, Barranquilla. Furthermore, the company has announced support for exports to Guyana, reinforcing Mapei’s regional growth strategy.


South America Construction Chemicals Market Report Scope
Commercial, Industrial and Institutional, Infrastructure, Residential are covered as segments by End Use Sector. Adhesives, Anchors and Grouts, Concrete Admixtures, Concrete Protective Coatings, Flooring Resins, Repair and Rehabilitation Chemicals, Sealants, Surface Treatment Chemicals, Waterproofing Solutions are covered as segments by Product. Argentina, Brazil are covered as segments by Country.| Adhesives | Hot-Melt |
| Reactive | |
| Solvent-borne | |
| Water-borne | |
| Anchors and Grouts | Cementitious Fixing |
| Resin Fixing | |
| Concrete Admixtures | Accelerator |
| Air-Entraining | |
| Super-plasticizer | |
| Retarder | |
| Shrinkage-Reducer | |
| Viscosity-Modifier | |
| Plasticizer | |
| Other Types | |
| Concrete Protective Coatings | Acrylic |
| Alkyd | |
| Epoxy | |
| Polyurethane | |
| Other Resins | |
| Flooring Resins | Acrylic |
| Epoxy | |
| Polyaspartic | |
| Polyurethane | |
| Other Resins | |
| Repair and Rehabilitation Chemicals | Fiber-Wrapping Systems |
| Injection Grouting | |
| Micro-concrete Mortars | |
| Modified Mortars | |
| Rebar Protectors | |
| Sealants | Acrylic |
| Epoxy | |
| Polyurethane | |
| Silicone | |
| Other Resins | |
| Surface-Treatment Chemicals | Curing Compounds |
| Mold-Release Agents | |
| Other Types | |
| Waterproofing Solutions | Chemicals |
| Membranes |
| Commercial |
| Industrial and Institutional |
| Infrastructure |
| Residential |
| Brazil |
| Argentina |
| Rest of South America |
| By Product | Adhesives | Hot-Melt |
| Reactive | ||
| Solvent-borne | ||
| Water-borne | ||
| Anchors and Grouts | Cementitious Fixing | |
| Resin Fixing | ||
| Concrete Admixtures | Accelerator | |
| Air-Entraining | ||
| Super-plasticizer | ||
| Retarder | ||
| Shrinkage-Reducer | ||
| Viscosity-Modifier | ||
| Plasticizer | ||
| Other Types | ||
| Concrete Protective Coatings | Acrylic | |
| Alkyd | ||
| Epoxy | ||
| Polyurethane | ||
| Other Resins | ||
| Flooring Resins | Acrylic | |
| Epoxy | ||
| Polyaspartic | ||
| Polyurethane | ||
| Other Resins | ||
| Repair and Rehabilitation Chemicals | Fiber-Wrapping Systems | |
| Injection Grouting | ||
| Micro-concrete Mortars | ||
| Modified Mortars | ||
| Rebar Protectors | ||
| Sealants | Acrylic | |
| Epoxy | ||
| Polyurethane | ||
| Silicone | ||
| Other Resins | ||
| Surface-Treatment Chemicals | Curing Compounds | |
| Mold-Release Agents | ||
| Other Types | ||
| Waterproofing Solutions | Chemicals | |
| Membranes | ||
| By End-User Sector | Commercial | |
| Industrial and Institutional | ||
| Infrastructure | ||
| Residential | ||
| By Geography | Brazil | |
| Argentina | ||
| Rest of South America | ||


Market Definition
- END-USE SECTOR - Construction chemicals consumed in the construction sectors such as commercial, residential, industrial, institutional, and infrastructure are considered under the scope of the study.
- PRODUCT/APPLICATION - Under the scope of the study, the consumption of construction chemical products such as concrete admixtures, repair and rehabilitation chemicals, flooring resins, waterproofing solutions, anchors and grouts, adhesives and sealants, and surface treatment chemicals is considered.
| Keyword | Definition |
|---|---|
| Accelerator | Accelerators are admixtures used to fasten the setting time of concrete by increasing the initial rate and speeding up the chemical reaction between cement and the mixing water. These are used to harden and increase the strength of concrete quickly. |
| Acrylic | This synthetic resin is a derivative of acrylic acid. It forms a smooth surface and is mainly used for various indoor applications. The material can also be used for outdoor applications with a special formulation. |
| Adhesives | Adhesives are bonding agents used to join materials by gluing. Adhesives can be used in construction for many applications, such as carpet laying, ceramic tiles, countertop lamination, etc. |
| Air Entraining Admixture | Air-entraining admixtures are used to improve the performance and durability of concrete. Once added, they create uniformly distributed small air bubbles to impart enhanced properties to the fresh and hardened concrete. |
| Alkyd | Alkyds are used in solvent-based paints such as construction and automotive paints, traffic paints, flooring resins, protective coatings for concrete, etc. Alkyd resins are formed by the reaction of an oil (fatty acid), a polyunsaturated alcohol (Polyol), and a polyunsaturated acid or anhydride. |
| Anchors and Grouts | Anchors and grouts are construction chemicals that stabilize and improve the strength and durability of foundations and structures like buildings, bridges, dams, etc. |
| Cementitious Fixing | Cementitious fixing is a process in which a cement-based grout is pumped under pressure to fill forms, voids, and cracks. It can be used in several settings, including bridges, marine applications, dams, and rock anchors. |
| Commercial Construction | Commercial construction comprises new construction of warehouses, malls, shops, offices, hotels, restaurants, cinemas, theatres, etc. |
| Concrete Admixtures | Concrete admixtures comprise water reducers, air entrainers, retarders, accelerators, superplasticizers, etc., added to concrete before or during mixing to modify its properties. |
| Concrete Protective Coatings | To provide specific protection, such as anti-carbonation or chemical resistance, a film-forming protective coat can be applied on the surface. Depending on the applications, different resins like epoxy, polyurethane, and acrylic can be used for concrete protective coatings. |
| Curing Compounds | Curing compounds are used to cure the surface of concrete structures, including columns, beams, slabs, and others. These curing compounds keep the moisture inside the concrete to give maximum strength and durability. |
| Epoxy | Epoxy is known for its strong adhesive qualities, making it a versatile product in many industries. It resists heat and chemical applications, making it an ideal product for anyone needing a stronghold under pressure. It is widely used in adhesives, electrical and electronics, paints, etc. |
| Fiber Wrapping Systems | Fiber Wrapping Systems are a part of construction repair and rehabilitation chemicals. It involves the strengthening of existing structures by wrapping structural members like beams and columns with glass or carbon fiber sheets. |
| Flooring Resins | Flooring resins are synthetic materials applied to floors to enhance their appearance, increase their resistance to wear and tear or provide protection from chemicals, moisture, and stains. Depending on the desired properties and the specific application, flooring resins are available in distinct types, such as epoxy, polyurethane, and acrylic. |
| High-Range Water Reducer (Super Plasticizer) | High-range water reducers are a type of concrete admixture that provides enhanced and improved properties when added to concrete. These are also called superplasticizers and are used to decrease the water-to-cement ratio in concrete. |
| Hot Melt Adhesives | Hot-melt adhesives are thermoplastic bonding materials applied as melts that achieve a solid state and resultant strength on cooling. They are commonly used for packaging, coatings, sanitary products, and tapes. |
| Industrial and Institutional Construction | Industrial and institutional construction includes new construction of hospitals, schools, manufacturing units, energy and power plants, etc. |
| Infrastructure Construction | Infrastructure construction includes new construction of railways, roads, seaways, airports, bridges, highways, etc. |
| Injection Grouting | The process of injecting grout into open joints, cracks, voids, or honeycombs in concrete or masonry structural members is known as injection grouting. It offers several benefits, such as strengthening a structure and preventing water infiltration. |
| Liquid-Applied Waterproofing Membranes | Liquid-Applied membrane is a monolithic, fully bonded, liquid-based coating suitable for many waterproofing applications. The coating cures to form a rubber-like elastomeric waterproof membrane and may be applied over many substrates, including asphalt, bitumen, and concrete. |
| Micro-concrete Mortars | Micro-concrete mortar is made up of cement, water-based resin, additives, mineral pigments, and polymers and can be applied on both horizontal and vertical surfaces. It can be used to refurbish residential complexes, commercial spaces, etc. |
| Modified Mortars | Modified Mortars include Portland cement and sand along with latex/polymer additives. The additives increase adhesion, strength, and shock resistance while also reducing water absorption. |
| Mold Release Agents | Mold release agents are sprayed or coated on the surface of molds to prevent a substrate from bonding to a molding surface. Several types of mold release agents, including silicone, lubricant, wax, fluorocarbons, and others, are used based on the type of substrates, including metals, steel, wood, rubber, plastic, and others. |
| Polyaspartic | Polyaspartic is a subset of polyurea. Polyaspartic floor coatings are typically two-part systems that consist of a resin and a catalyst to ease the curing process. It offers high durability and can withstand harsh environments. |
| Polyurethane | Polyurethane is a plastic material that exists in various forms. It can be tailored to be either rigid or flexible and is the material of choice for a broad range of end-user applications, such as adhesives, coatings, building insulation, etc. |
| Reactive Adhesives | A reactive adhesive is made of monomers that react in the adhesive curing process and do not evaporate from the film during use. Instead, these volatile components become chemically incorporated into the adhesive. |
| Rebar Protectors | In concrete structures, rebar is one of the important components, and its deterioration due to corrosion is a major issue that affects the safety, durability, and life span of buildings and structures. For this reason, rebar protectors are used to protect against degrading effects, especially in infrastructure and industrial construction. |
| Repair and Rehabilitation Chemicals | Repair and Rehabilitation Chemicals include repair mortars, injection grouting materials, fiber wrapping systems, micro-concrete mortars, etc., used to repair and restore existing buildings and structures. |
| Residential Construction | Residential construction involves constructing new houses or spaces like condominiums, villas, and landed homes. |
| Resin Fixing | The process of using resins like epoxy and polyurethane for grouting applications is called resin fixing. Resin fixing offers several advantages, such as high compressive and tensile strength, negligible shrinkage, and greater chemical resistance compared to cementitious fixing. |
| Retarder | Retarders are admixtures used to slow down the setting time of concrete. These are usually added with a dosage rate of around 0.2% -0.6% by weight of cement. These admixtures slow down hydration or lower the rate at which water penetrates the cement particles by making concrete workable for a long time. |
| Sealants | A sealant is a viscous material that has little or no flow qualities, which causes it to remain on surfaces where they are applied. Sealants can also be thinner, enabling penetration to a certain substance through capillary action. |
| Sheet Waterproofing Membranes | Sheet membrane systems are reliable and durable thermoplastic waterproofing solutions that are used for waterproofing applications even in the most demanding below-ground structures, including those exposed to highly aggressive ground conditions and stress. |
| Shrinkage Reducing Admixture | Shrinkage-reducing admixtures are used to reduce concrete shrinkage, whether from drying or self-desiccation. |
| Silicone | Silicone is a polymer that contains silicon combined with carbon, hydrogen, oxygen, and, in some cases, other elements. It is an inert synthetic compound that comes in various forms, such as oil, rubber, and resin. Due to its heat-resistant properties, it finds applications in sealants, adhesives, lubricants, etc. |
| Solvent-borne Adhesives | Solvent-borne adhesives are mixtures of solvents and thermoplastic or slightly cross-linked polymers such as polychloroprene, polyurethane, acrylic, silicone, and natural and synthetic rubbers. |
| Surface Treatment Chemicals | Surface treatment chemicals are chemicals used to treat concrete surfaces, including roofs, vertical surfaces, and others. They act as curing compounds, demolding agents, rust removers, and others. They are cost-effective and can be used on roadways, pavements, parking lots, and others. |
| Viscosity Modifier | Viscosity Modifiers are concrete admixtures used to change various properties of admixtures, including viscosity, workability, cohesiveness, and others. These are usually added with a dosage of around 0.01% to 0.1% by weight of cement. |
| Water Reducer | Water reducers, also called plasticizers, are a type of admixture used to decrease the water-to-cement ratio in the concrete, thereby increasing the durability and strength of concrete. Various water reducers include refined lignosulfonates, gluconates, hydroxycarboxylic acids, sugar acids, and others. |
| Water-borne Adhesives | Water-borne adhesives use water as a carrier or diluting medium to disperse resin. They are set by allowing the water to evaporate or be absorbed by the substrate. These adhesives are compounded with water as a dilutant rather than a volatile organic solvent. |
| Waterproofing Chemicals | Waterproofing chemicals are designed to protect a surface from the perils of leakage. A waterproofing chemical is a protective coating or primer applied to a structure's roof, retaining walls, or basement. |
| Waterproofing Membranes | Waterproofing membranes are liquid-applied or self-adhering layers of water-tight materials that prevent water from penetrating or damaging a structure when applied to roofs, walls, foundations, basements, bathrooms, and other areas exposed to moisture or water. |


Research Methodology
Mordor Intelligence follows a four-step methodology in all our reports.
- Step-1: Identify Key Variables: The quantifiable key variables (industry and extraneous) pertaining to the specific product segment and country are selected from a group of relevant variables & factors based on desk research & literature review; along with primary expert inputs. These variables are further confirmed through regression modeling (wherever required).
- Step-2: Build a Market Model: In order to build a robust forecasting methodology, the variables and factors identified in Step-1 are tested against available historical market numbers. Through an iterative process, the variables required for market forecast are set and the model is built on the basis of these variables.
- Step-3: Validate and Finalize: In this important step, all market numbers, variables and analyst calls are validated through an extensive network of primary research experts from the market studied. The respondents are selected across levels and functions to generate a holistic picture of the market studied.
- Step-4: Research Outputs: Syndicated Reports, Custom Consulting Assignments, Databases & Subscription Platforms


