Market Overview
| Study Period | 2018 - 2031 |
|---|---|
| Forecast Data Period | 2026 - 2031 |
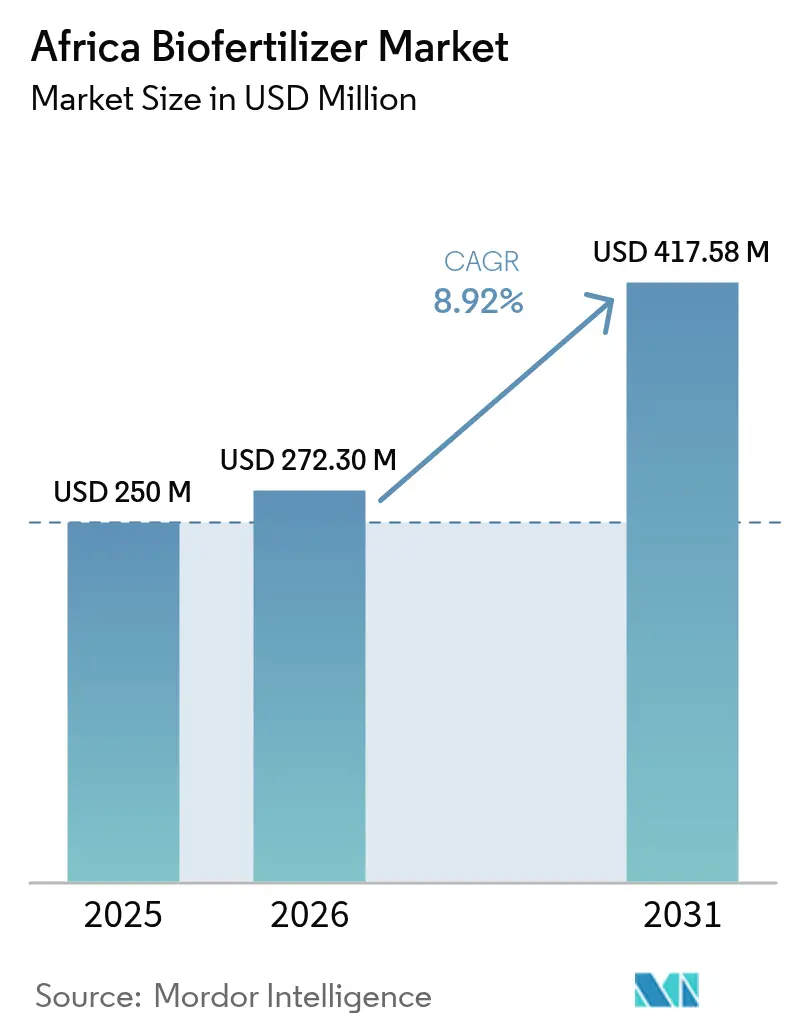
| Base Year Market Size (2025) | USD 250 Million |
| Market Size (2026) | USD 272.3 Million |
| Market Size (2031) | USD 417.58 Million |
| Growth Rate (2026 - 2031) | 8.92% CAGR |
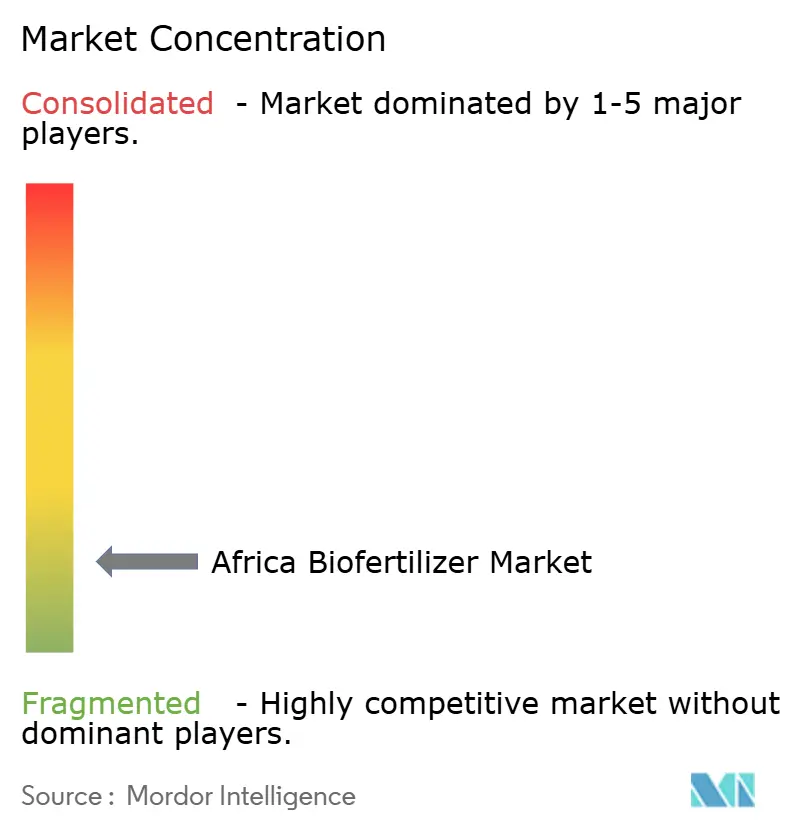
| Market Concentration | Low |
Major Players *Disclaimer: Major Players sorted in no particular order Image © Mordor Intelligence. Reuse requires attribution under CC BY 4.0. | |
Africa Biofertilizer Market Analysis by Mordor Intelligence
The Africa biofertilizer market size is expected to grow from USD 250 million in 2025 to USD 272.3 million in 2026 and is forecast to reach USD 417.58 million by 2031 at 8.92% CAGR over 2026-2031. Rapid policy alignment under the Nairobi Declaration, fast-rising fertilizer prices, and ESG-linked finance packages are steering growers toward microbial solutions that cut synthetic nutrient costs, sustain soil health, and open premium organic export channels. Major countries' dominance mirrors the continent’s dispersed smallholder systems, yet Egypt’s controlled irrigation zones and export focus drive the fastest uptake. Rhizobium remains pivotal because legume rotations cover wide acreages, while cash crops such as cotton and cocoa amplify growth by linking biofertilizer use to certification premiums. On the supply side, multinationals are pairing R&D with local distributors, limited cold-chain capacity, and counterfeit infiltration create sizable white-space opportunities for firms that can bundle quality assurance with extension support. Overall, the Africa biofertilizer market is set for durable double-digit expansion as regulatory fast-track schemes and climate finance de-risk farmer adoption.
Key Report Takeaways
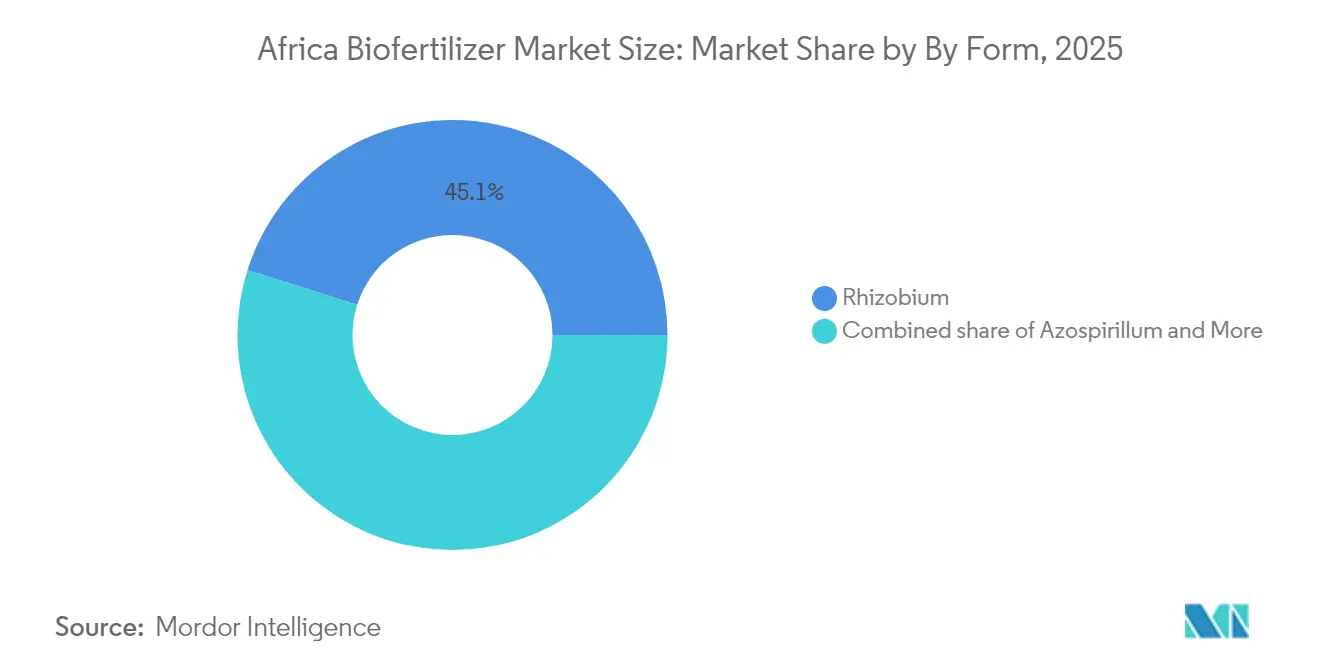
- By form, Rhizobium captured 45.12% of the Africa biofertilizer market share in 2025. At the same time, it is projected to record the fastest 9.02% CAGR through 2031.
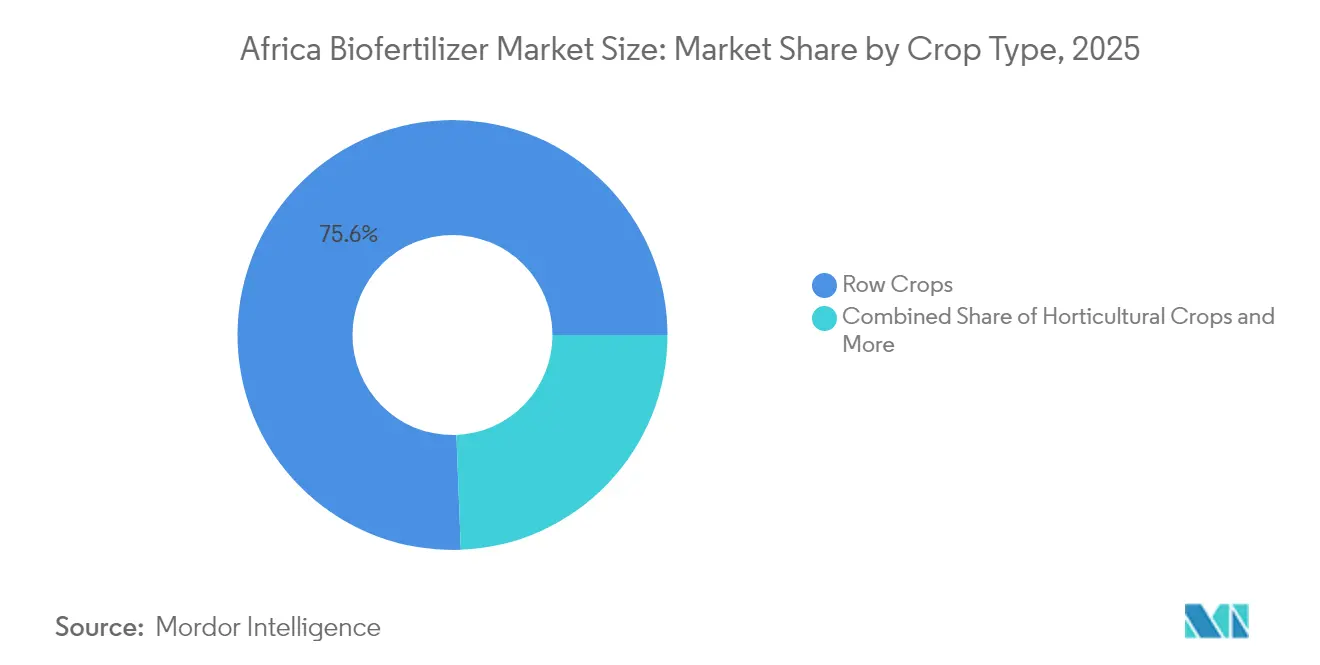
- By crop type, row crops accounted for a 75.62% share of the Africa biofertilizer market size in 2025, and cash crops are forecast to expand at a 9.07% CAGR to 2031.
- By geography, Egypt led with 4.36% revenue share in 2025 and posts the highest 10.52% CAGR to 2031.
Note: Market size and forecast figures in this report are generated using Mordor Intelligence’s proprietary estimation framework, updated with the latest available data and insights as of 2026.
Africa Biofertilizer Market Trends and Insights
Drivers Impact Analysis*
| Driver | (~) % Impact on CAGR Forecast | Geographic Relevance | Impact Timeline |
|---|---|---|---|
| Subsidy-linked national soil-health programs | +1.8% | East, West, and Southern Africa | Medium term (2-4 years) |
| High fertilizer prices push growers to bio-alternatives | +2.1% | Sub-Saharan Africa | Short term (≤ 2 years) |
| Growth of regenerative cotton initiatives | +1.2% | West Africa | Long term (≥ 4 years) |
| Rising organic export certifications | +1.6% | North and East Africa export corridors | Medium term (2-4 years) |
| Expansion of ESG-driven agri-fintech lending packages | +1.4% | East Africa peri-urban farming zones | Long term (≥ 4 years) |
| Government bio-input registration fast-track schemes | +1.4% | Southern Africa (SADC) and Nigeria | Medium term (2-4 years) |
| Source: Mordor Intelligence | |||


Subsidy-Linked National Soil-Health Programs
Continental frameworks such as the Soil Initiative for Africa guide member states to embed biological inputs in fertilizer subsidies. Nigeria’s Agricultural Transformation Agenda, Kenya’s Inclusive Growth Project, and Ethiopia’s Productive Safety Net Programme allocate funds for microbial inoculants, creating a predictable demand and facilitating coordinated farmer training. Public procurement lowers retail prices, while verification protocols in subsidy channels deter counterfeit penetration. The alignment with CAADP (Comprehensive Africa Agriculture Development Programme) targets elevating soil health to a policy priority, ensuring that biofertilizers remain central to closing the yield gaps[1]Source: African Union Commission, “Official Launch of the 4th CAADP Biennial Review Report,” AU.INT.
High Fertilizer Prices Push Growers to Bio-Alternatives
Urea and DAP (Di-ammonium Phosphate) prices remained 40-60% above pre-2020 averages in 2024, widening the economic gap between chemical and biological nutrients[2]Source: International Fertilizer Association, “Reflecting on the 2024 Africa Fertilizer and Soil Health Summit,” fertilizer.org. For legumes, Rhizobium inoculants cut synthetic nitrogen need by as much as half, generating immediate cash savings that outweigh the microbial input cost. Extension programs in Ghana, Nigeria, and Kenya feature side-by-side plots that demonstrate yield gains persisting over multiple seasons, thereby reinforcing farmer confidence. The price shock has shifted input planning from solely cost-per-bag to total nutrient efficiency, propelling the penetration of the African biofertilizer market among both commercial estates and smallholders.
Growth of Regenerative Cotton Initiatives in West Africa
Cotton made in Africa verified 30% of the continent’s lint output in 2023, binding 900,000 farming families to sustainability standards that mandate soil-health practices. Projects in Benin apply phosphate-solubilizing bacteria and mycorrhiza to boost phosphorus availability on degraded sandy soils, while Chad’s landscape restoration partnership with LVMH (Louis Vuitton Moët Hennessy) funds microbial amendments in rotation crops. Regenerative protocols enhance lint quality and increase farmer income, transforming cotton zones into early adopters of microbial blends. Spillover effects extend to cereals and legumes planted in rotation, expanding the addressable acreage of the African biofertilizer market.
Rising Organic Export Certifications
The USD 50 million ADAPTA Climate Finance Facility channels concessional debt to regenerative agriculture, bundling biofertilizer purchases with working-capital loans. Digital lenders like Farmcrowdy integrate input catalogs with mobile money, allowing collateral-free repayments linked to harvest cycles. European Investment Bank (EIB) EUR 50 million (USD 54 million) credit line to the Bank of Kigali earmarks funds for biological supply chains, encouraging private co-financiers. By lowering cash-flow barriers, fintech models expand the Africa biofertilizer market among first-time adopters.
Restraints Impact Analysis*
| Restraint | (~) % Impact on CAGR Forecast | Geographic Relevance | Impact Timeline |
|---|---|---|---|
| Limited cold-chain logistics for liquid inoculants | -1.9% | Rural Sub-Saharan Africa | Short term (≤ 2 years) |
| Low farmer awareness outside commercial farms | -2.1% | Smallholder regions across Africa | Medium term (2-4 years) |
| Counterfeit microbial consortia in informal markets | -1.6% | West and Central Africa | Short term (≤ 2 years) |
| Stricter microbial release regulations | -1.2% | Egypt and South Africa | Long term (≥ 4 years) |
| Source: Mordor Intelligence | |||
Limited Cold-Chain Logistics for Liquid Inoculants
Only 15% of African value chains benefit from refrigerated storage, forcing suppliers to favor dry formulations that may deliver lower field efficacy. Temperature-controlled logistics add up to 40% to delivered costs in remote areas, shrinking uptake among price-sensitive farmers. Firms like Del Monte Kenya now produce 5,000 metric tons of fresh inoculants on site to bypass distribution risks. Scaling on-farm production remains capital-intensive, making broad coverage elusive in the short term.
Low Farmer Awareness Outside Nucleus Commercial Farms
The 2023 Seed Sector Performance Index revealed that only 0.33% of Kenyan growers utilized microbial inputs, highlighting a significant knowledge gap. Many rural extension agents lack training on biofertilizer handling, leading to variable application rates and inconsistent yields. Digital tools like iCow and Farmerline deliver tutorials in local languages, but smartphone penetration is uneven. Without sustained training, perceptions of product performance remain mixed, hindering the growth of the Africa biofertilizer market among dispersed smallholders.
*Our forecasts treat driver/restraint impacts as directional, not additive. The impact forecasts reflect baseline growth, mix effects, and variable interactions.
Segment Analysis
By Form: Rhizobium Dominance Reflects Legume-centric Agriculture
Rhizobium accounted for 45.12% of the African biofertilizer market share in 2025 and is set to widen its lead at a 9.02% CAGR through 2031. This supremacy stems from extensive plantings of groundnuts, cowpeas, soybeans, and beans, where biological nitrogen fixation replaces the costly use of urea. Novonesis and Andermatt rolled out Cell-Tech soy inoculant across Eastern and Southern Africa, highlighting strain innovation that enhances soil fertility for subsequent crops .
Azospirillum is highly valued by maize and sorghum growers for its benefits in drought tolerance. Mycorrhiza adoption accelerates in fruit orchards and greenhouse vegetables because enhanced phosphorus uptake improves quality grades, which command export premiums. Phosphate-solubilizing bacteria gain traction on West African acid soils rich in immature rock phosphate deposits. Complex consortia combining nitrogen fixers with phosphorus and potassium mobilizers represent the frontier of product development, appealing to commercial estates that seek one-pass biological solutions. As cold-chain gaps narrow and liquid formulations become viable, high-concentration inoculants promise further yield increases, keeping the form segment in flux within the African biofertilizer market.


By Crop Type: Row Crops Dominance Driven by Staple Food Security
Row crops accounted for 75.62% of Africa's biofertilizer market size in 2025, reflecting the public policy focus on maize, rice, and millet self-sufficiency. Governments channel subsidies and extension agents toward these staples, ensuring microbial inputs reach the widest possible acreage. Although row crops dominate in volume, cash crops lead the momentum. Cotton, coffee, cocoa, and tobacco are projected to drive a 9.07% CAGR through 2031, as export premiums justify microbial investments that meet certification norms. Regenerative cotton programs alone are bringing nearly 1 million farmers into structured biofertilizer workflows, intensifying demand density in West Africa.
Horticultural crops, though smaller in share, illustrate rapid value growth. Kenya’s floriculture firms use mycorrhiza to meet European residue thresholds, while Ghana’s pineapple exporters leverage Azospirillum for sweetness consistency. The integration of biofertilizers with biological pest control strategies points toward holistic crop management models. Across crop types, bundled advisory services are emerging, where suppliers embed smartphone agronomy tips that unlock maximum microbial performance, reinforcing the narrative of the Africa biofertilizer market.
Geography Analysis
Egypt accounted for 4.36% of Africa biofertilizer market size in 2025, the largest among individually reported country segments, underpinned by intensive horticulture and field-crop systems concentrated in the Nile Delta. Government incentives to curb synthetic nutrient imports and fast-track microbial registration have fostered early adoption, while proximity to European organic buyers strengthens demand for certified inputs. The Agricultural Research Center’s nationwide extension network provides hands-on inoculation guidance, ensuring high field success rates and cementing Egypt’s leadership in both volume and innovation.
The country’s 10.52% CAGR through 2031 outpaces every other segment as producers seek yield gains that comply with EU Farm to Fork residue limits, especially in citrus, strawberries, and greenhouse vegetables. Large commercial estates integrate liquid Rhizobium and mycorrhiza blends with precision irrigation to maximize nutrient efficiency under water scarcity pressures. Finance programs such as the European Investment Bank’s credit lines for green agriculture lower capital constraints, widening access for medium-scale growers and accelerating penetration beyond export-oriented farms.
While Egypt leads the region, Nigeria, South Africa, and the broader Rest of Africa still represent substantial acreage opportunities for microbial inputs especially as harmonized biosafety regulations help lower cross-border registration hurdles. Nigeria’s smallholder density and subsidy vouchers create volume upside, while South Africa’s commercial estates favor multi-strain liquid consortia despite higher cold-chain costs. The Rest of Africa cluster shows steady uptake in cotton, coffee, and maize systems but remains fragmented by infrastructure gaps and uneven farmer awareness. Collectively, these segments contribute robust incremental demand yet are set to be eclipsed by Egypt’s accelerated growth and coordinated policy-research ecosystem that positions it as the continental bellwether for biofertilizer adoption.
Competitive Landscape
The Africa biofertilizer market is highly fragmented. Hundreds of local blenders and regional distributors dominate last-mile delivery, leveraging deep relationships with farmers but often lacking robust quality control labs. Multinational firms are now pairing proprietary strains with local partners to bridge this gap. Rizobacter operates distribution hubs in nine African countries and trains agronomists to oversee field demonstrations.
Technology competition centers on formulation stability and multi-function blends. Koppert and Acadian Plant Health expanded their alliance to integrate biocontrol and biostimulant portfolios, enabling combined pest and nutrient packages suited for large estates. Beyond scientific differentiation, service quality is crucial for companies to bundle mobile advisory apps, QR code authenticity checks, and performance guarantees. Players investing in cold-chain depots gain an edge in liquid inoculants, a segment projected to outpace powders once distribution hurdles ease.
Consolidation interest is emerging among private equity funds targeting regional champions capable of scaling their African footprints. Firms with regulatory expertise will likely outpace informal competitors as biosafety laws tighten. Public-private partnerships are underwriting pilot plants in Ghana and Kenya, giving technology leaders early production footholds. With counterfeit enforcement strengthening and awareness rising, the field is poised for strategic mergers that will push the African biofertilizer market toward moderate concentration over the next decade.
Africa Biofertilizer Industry Leaders
IPL Biologicals Limited
Microbial Biological Fertilizers International
T. Stanes and Company Limited
Biolchim SpA (J. M. Huber Corporation)
Rizobacter (Bioceres Crop Solutions)
- *Disclaimer: Major Players sorted in no particular order

Recent Industry Developments
- January 2025: Koppert Biological Systems and Acadian Plant Health extended their distribution alliance to Europe, the Middle East, and Africa, packaging microbial pest control with plant growth biostimulants for integrated soil health solutions.
- July 2024: Novonesis and Andermatt Biocontrol launched Cell-Tech soy inoculant across Southern and Eastern Africa after entering a strategic growth partnership.
- May 2024: Del Monte Kenya began biofertilizer production at its Thika site, adding 5,000 metric tons of annual capacity for fresh inoculants aimed at nearby pineapple and vegetable farms.


Africa Biofertilizer Market Report Scope
Azospirillum, Azotobacter, Mycorrhiza, Phosphate Solubilizing Bacteria, Rhizobium are covered as segments by Form. Cash Crops, Horticultural Crops, Row Crops are covered as segments by Crop Type. Egypt, Nigeria, South Africa are covered as segments by Country.Form
| Azospirillum |
| Azotobacter |
| Mycorrhiza |
| Phosphate Solubilizing Bacteria |
| Rhizobium |
| Other Biofertilizers |
Crop Type
| Cash Crops |
| Horticultural Crops |
| Row Crops |
Country
| Egypt |
| Nigeria |
| South Africa |
| Rest of Africa |
| Form | Azospirillum |
| Azotobacter | |
| Mycorrhiza | |
| Phosphate Solubilizing Bacteria | |
| Rhizobium | |
| Other Biofertilizers | |
| Crop Type | Cash Crops |
| Horticultural Crops | |
| Row Crops | |
| Country | Egypt |
| Nigeria | |
| South Africa | |
| Rest of Africa |


Market Definition
- AVERAGE DOSAGE RATE - The average application rate is the average volume of biofertilizers applied per hectare of farmland in the respective region/country.
- CROP TYPE - Crop type includes Row crops (Cereals, Pulses, Oilseeds), Horticultural Crops (Fruits and vegetables) and Cash Crops (Plantation Crops, Fibre Crops and Other Industrial Crops)
- FUNCTION - The crop nutrition function of agricultural biological consists of various products that provide essential plant nutrients and enhance soil quality.
- TYPE - Biofertilizers enhance soil quality by increasing the population of beneficial microorganisms. They help crops absorb nutrients from the environment.
| Keyword | Definition |
|---|---|
| Cash Crops | Cash crops are non-consumable crops sold as a whole or part of the crop to manufacture end-products to make a profit. |
| Integrated Pest Management (IPM) | IPM is an environment-friendly and sustainable approach to control pests in various crops. It involves a combination of methods, including biological controls, cultural practices, and selective use of pesticides. |
| Bacterial biocontrol agents | Bacteria used to control pests and diseases in crops. They work by producing toxins harmful to the target pests or competing with them for nutrients and space in the growing environment. Some examples of commonly used bacterial biocontrol agents include Bacillus thuringiensis (Bt), Pseudomonas fluorescens, and Streptomyces spp. |
| Plant Protection Product (PPP) | A plant protection product is a formulation applied to crops to protect from pests, such as weeds, diseases, or insects. They contain one or more active substances with other co-formulants such as solvents, carriers, inert material, wetting agents or adjuvants formulated to give optimum product efficacy. |
| Pathogen | A pathogen is an organism causing disease to its host, with the severity of the disease symptoms. |
| Parasitoids | Parasitoids are insects that lay their eggs on or within the host insect, with their larvae feeding on the host insect. In agriculture, parasitoids can be used as a form of biological pest control, as they help to control pest damage to crops and decrease the need for chemical pesticides. |
| Entomopathogenic Nematodes (EPN) | Entomopathogenic nematodes are parasitic roundworms that infect and kill pests by releasing bacteria from their gut. Entomopathogenic nematodes are a form of biocontrol agents used in agriculture. |
| Vesicular-arbuscular mycorrhiza (VAM) | VAM fungi are mycorrhizal species of fungus. They live in the roots of different higher-order plants. They develop a symbiotic relationship with the plants in the roots of these plants. |
| Fungal biocontrol agents | Fungal biocontrol agents are the beneficial fungi that control plant pests and diseases. They are an alternative to chemical pesticides. They infect and kill the pests or compete with pathogenic fungi for nutrients and space. |
| Biofertilizers | Biofertilizers contain beneficial microorganisms that enhance soil fertility and promote plant growth. |
| Biopesticides | Biopesticides are natural/bio-based compounds used to manage agricultural pests using specific biological effects. |
| Predators | Predators in agriculture are the organisms that feed on pests and help control pest damage to the crops. Some common predator species used in agriculture include ladybugs, lacewings, and predatory mites. |
| Biocontrol agents | Biocontrol agents are living organisms used to control pests and diseases in agriculture. They are alternatives to chemical pesticides and are known for their lesser impact on the environment and human health. |
| Organic Fertilizers | Organic fertilizer is composed of animal or vegetable matter used alone or in combination with one or more non-synthetically derived elements or compounds used for soil fertility and plant growth. |
| Protein hydrolysates (PHs) | Protein hydrolysate-based biostimulants contain free amino acids, oligopeptides, and polypeptides produced by enzymatic or chemical hydrolysis of proteins, primarily from vegetal or animal sources. |
| Biostimulants/Plant Growth Regulators (PGR) | Biostimulants/Plant Growth Regulators (PGR) are substances derived from natural resources to enhance plant growth and health by stimulating plant processes (metabolism). |
| Soil Amendments | Soil Amendments are substances applied to soil that improve soil health, such as soil fertility and soil structure. |
| Seaweed Extract | Seaweed extracts are rich in micro and macronutrients, proteins, polysaccharides, polyphenols, phytohormones, and osmolytes. These substances boost seed germination and crop establishment, total plant growth and productivity. |
| Compounds related to biocontrol and/or promoting growth (CRBPG) | Compounds related to biocontrol or promoting growth (CRBPG) are the ability of a bacteria to produce compounds for phytopathogen biocontrol and plant growth promotion. |
| Symbiotic Nitrogen-Fixing Bacteria | Symbiotic nitrogen-fixing bacteria such as Rhizobium obtain food and shelter from the host, and in return, they help by providing fixed nitrogen to the plants. |
| Nitrogen Fixation | Nitrogen fixation is a chemical process in soil which converts molecular nitrogen into ammonia or related nitrogenous compounds. |
| ARS (Agricultural Research Service) | ARS is the U.S. Department of Agriculture's chief scientific in-house research agency. It aims to find solutions to agricultural problems faced by the farmers in the country. |
| Phytosanitary Regulations | Phytosanitary regulations imposed by the respective government bodies check or prohibit the importation and marketing of certain insects, plant species, or products of these plants to prevent the introduction or spread of new plant pests or pathogens. |
| Ectomycorrhizae (ECM) | Ectomycorrhiza (ECM) is a symbiotic interaction of fungi with the feeder roots of higher plants in which both the plant and the fungi benefit through the association for survival. |


Research Methodology
Mordor Intelligence follows a four-step methodology in all our reports.
- Step-1: Identify Key Variables: In order to build a robust forecasting methodology, the variables and factors identified in Step-1 are tested against available historical market numbers. Through an iterative process, the variables required for market forecast are set and the model is built on the basis of these variables.
- Step-2: Build a Market Model: Market-size estimations for the forecast years are in nominal terms. Inflation is not a part of the pricing, and the average selling price (ASP) is kept constant throughout the forecast period.
- Step-3: Validate and Finalize: In this important step, all market numbers, variables and analyst calls are validated through an extensive network of primary research experts from the market studied. The respondents are selected across levels and functions to generate a holistic picture of the market studied.
- Step-4: Research Outputs: Syndicated Reports, Custom Consulting Assignments, Databases & Subscription Platforms.


