Acoustic Emission Testing Market Size and Share
Market Overview
| Study Period | 2020 - 2031 |
|---|---|
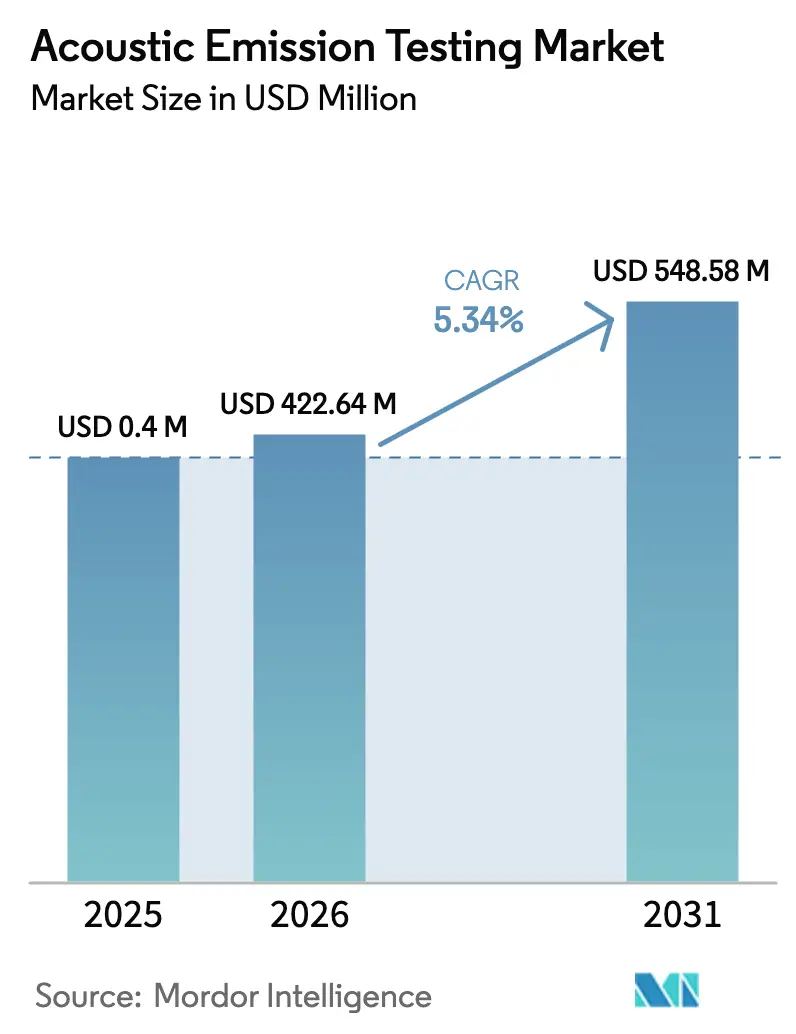
| Market Size (2026) | USD 422.64 Million |
| Market Size (2031) | USD 548.58 Million |
| Growth Rate (2026 - 2031) | 5.34% CAGR |
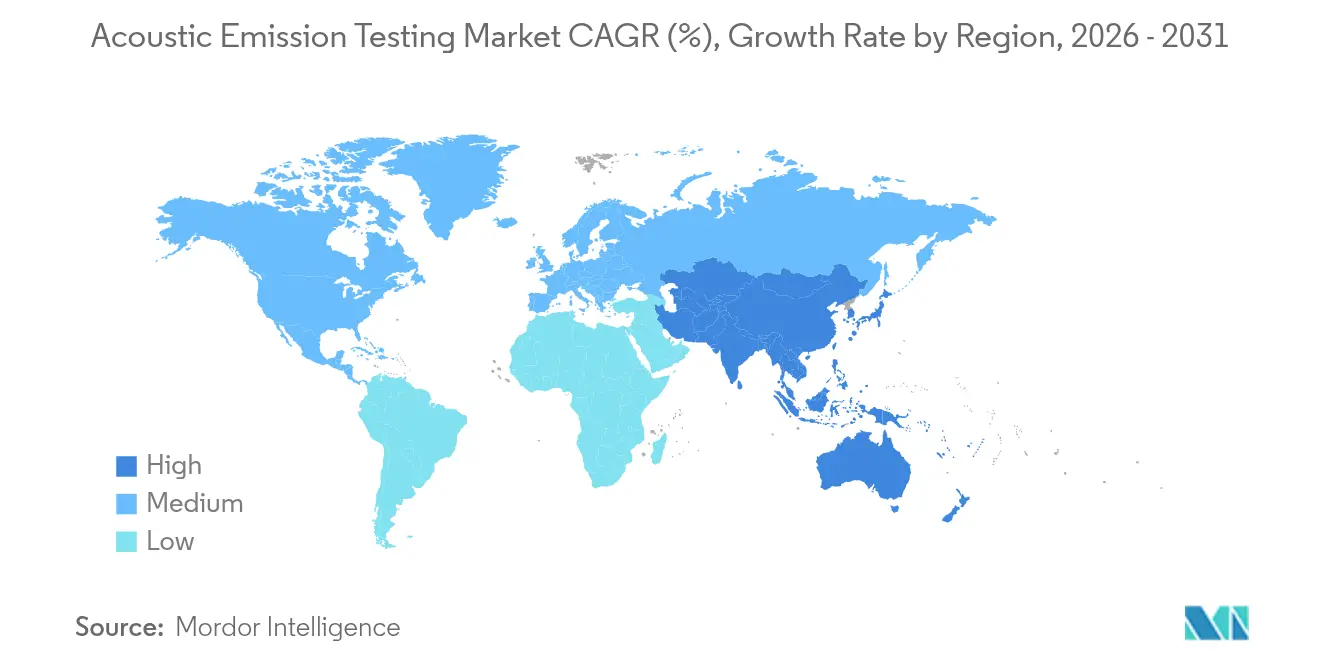
| Fastest Growing Market | Asia Pacific |
| Largest Market | Asia Pacific |
| Market Concentration | Medium |
Major Players *Disclaimer: Major Players sorted in no particular order Image © Mordor Intelligence. Reuse requires attribution under CC BY 4.0. | |
Acoustic Emission Testing Market Analysis by Mordor Intelligence
The acoustic emission testing market size was valued at USD 0.40 billion in 2025 and estimated to grow from USD 0.42 billion in 2026 to reach USD 0.55 billion by 2031, at a CAGR of 5.34% during the forecast period (2026-2031). Accelerating infrastructure renewal programs, safety-centric regulations, and the broader shift toward predictive maintenance are continuing to expand the market footprint of acoustic emission testing. Energy pipeline operators face mounting integrity challenges, manufacturers are embedding continuous monitoring into industrial Internet of Things initiatives, and aerospace OEMs rely on micro-crack detection to safeguard composite structures. Competitive dynamics are evolving as cloud analytics, MEMS sensor innovations, and autonomous inspection robots expand the capabilities of solutions. As digital transformation deepens, the acoustic emission testing market is becoming a staple across high-risk sectors rather than an exotic laboratory tool.
Key Report Takeaways
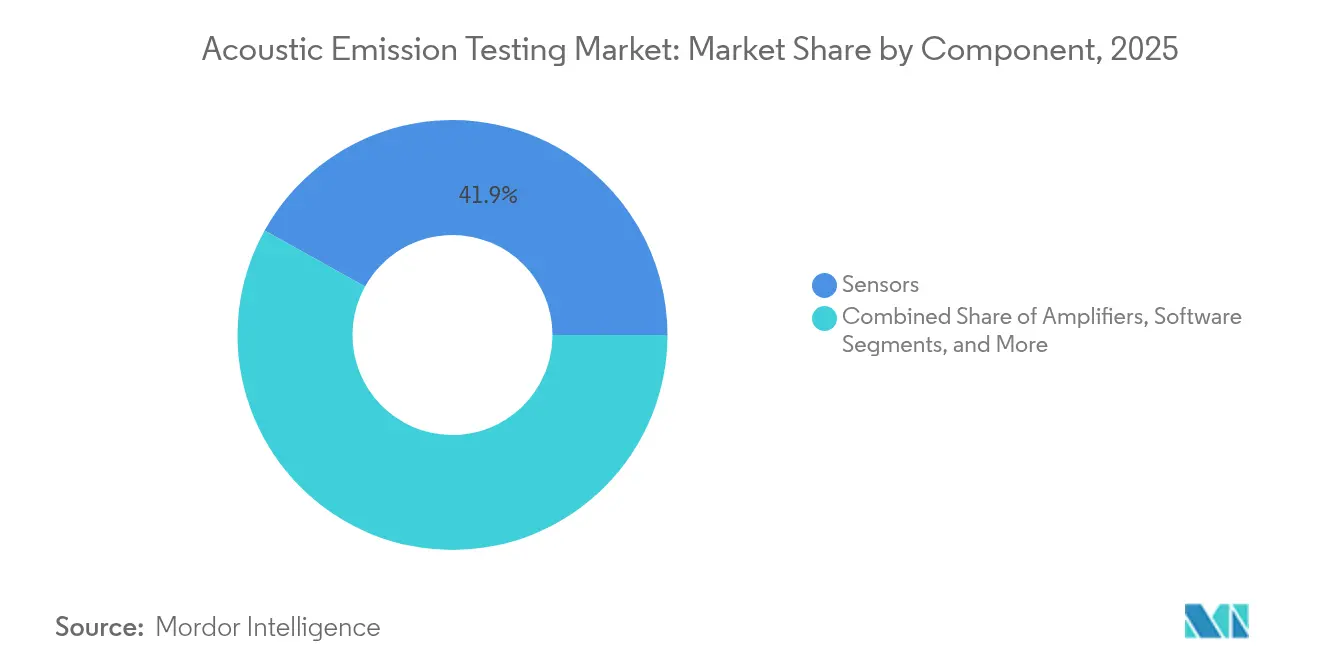
- By component, sensors led with 41.92% revenue share in 2025, while software is advancing at an 8.45% CAGR through 2031.
- By portability, portable and handheld systems held 45.15% of the acoustic emission testing market share in 2025, whereas automated and robotic systems are projected to expand at a 11.4% CAGR through 2031.
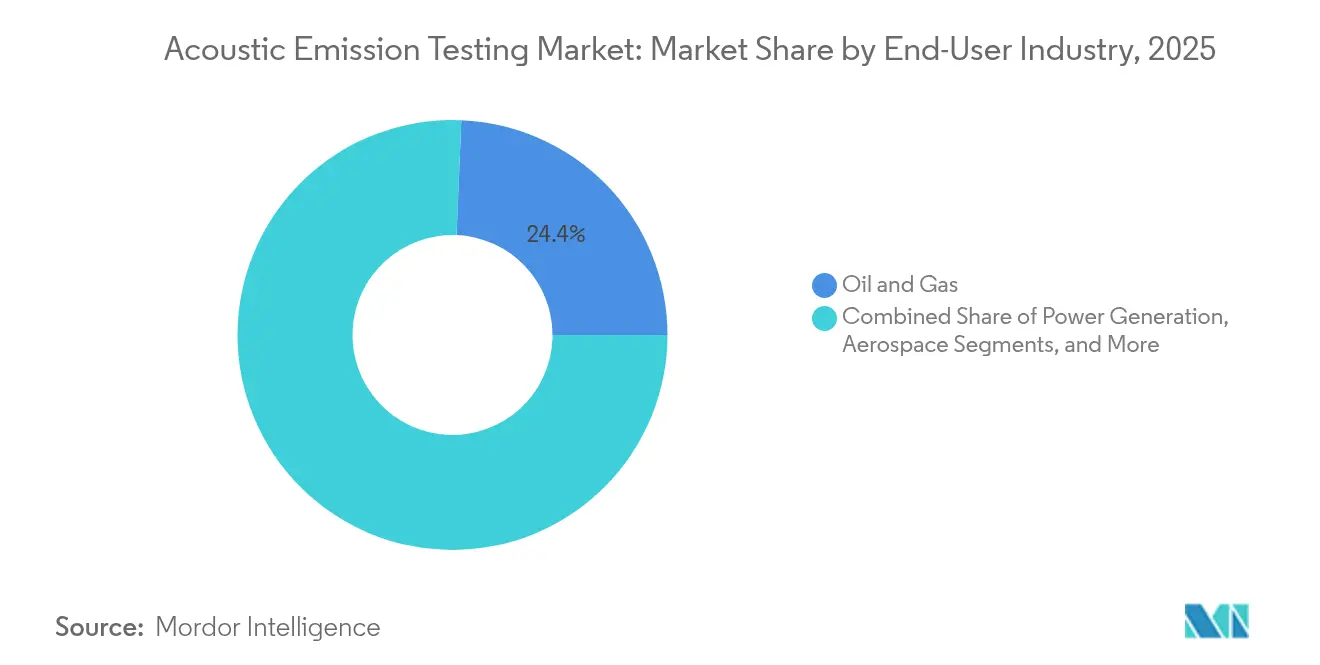
- By end-user industry, the oil and gas sector accounted for 24.35% of the acoustic emission testing market size in 2025; however, the automotive and transportation sectors are growing at the fastest rate, with a 9.85% CAGR through 2031.
- By geography, the Asia-Pacific region accounted for 34.05% of 2025 revenue and is also leading the field at a 6.95% CAGR through 2031.
Note: Market size and forecast figures in this report are generated using Mordor Intelligence’s proprietary estimation framework, updated with the latest available data and insights as of 2026.
Global Acoustic Emission Testing Market Trends and Insights
Drivers Impact Analysis*
| Driver | (~) % Impact on CAGR Forecast | Geographic Relevance | Impact Timeline |
|---|---|---|---|
| Aging infrastructure in oil and gas pipelines | +1.8% | Global, concentrated in North America and the Middle East | Long term (≥ 4 years) |
| Rising adoption of asset integrity management programs | +1.2% | Global, led by APAC and North America | Medium term (2-4 years) |
| Stringent safety regulations for high-risk industries | +0.9% | Global, strongest in the EU and North America | Short term (≤ 2 years) |
| Growing demand for micro-crack detection in composite aerospace parts | +0.7% | North America, Europe, APAC aerospace hubs | Medium term (2-4 years) |
| Integration of AE data with digital twins for predictive maintenance | +0.6% | Global, early adoption in developed markets | Long term (≥ 4 years) |
| Increasing availability of low-cost MEMS acoustic sensors | +0.5% | Global, manufacturing concentrated in APAC | Short term (≤ 2 years) |
| Source: Mordor Intelligence | |||
Aging Pipeline Infrastructure
Global operators manage more than 2.7 million miles of transmission lines, with 60% of these lines laid before 1980, prompting them to adopt real-time monitoring technologies to meet the requirements of 49 CFR Part 195.[1]Pipeline and Hazardous Materials Safety Administration, “Pipeline Safety Regulations,” phmsa.dot.gov Acoustic emission systems detect stress corrosion cracking and fatigue events that legacy interval inspections miss, averting unplanned shutdowns that can cost USD 1-3 million per day. As a result, the acoustic emission testing market now underpins most new integrity programs in North America and the Middle East. Service providers also bundle data analytics to automate compliance reporting, further embedding the technology.
Rising Adoption of Asset Integrity Management Programs
Process industries have documented 15-25% cuts in unplanned downtime after layering acoustic emission analytics onto rotating and static assets. Software dashboards convert raw waveforms into actionable diagnostics, enabling operators to schedule interventions only when defect growth indicators breach threshold levels. Predictive triggers feed directly into enterprise asset management suites, closing the loop between inspection and maintenance. These operational wins account for 1.2 percentage points of the acoustic emission testing market's CAGR.
Stringent Safety Regulations for High-Risk Industries
The EU Pressure Equipment Directive 2014/68/EU and similar codes in North America now reference acoustic emission testing as an accepted in-service inspection technique.[2]European Commission, “Pressure Equipment Directive 2014/68/EU,” ec.europa.eu Nuclear standards, notably ASME BPVC Section XI, reinforce its role for pressure boundary components. Because compliance schedules are statutory, spending on acoustic emission hardware, calibration, and analyst services remains recession-resistant, providing a steady market baseline.
Demand for Micro-Crack Detection in Aerospace Composites
Composite airframes can comprise up to 60% of the weight of modern aircraft, necessitating continuous in-flight and ground inspections. Multi-channel acoustic emission arrays pinpoint ply delamination and fiber fracture during fatigue cycles, thereby extending service intervals without compromising safety. Aircraft OEMs have begun embedding fixed sensor networks in wing and fuselage skins, creating a high-margin niche in the acoustic emission testing market that aligns with passenger safety imperatives.
Restraints Impact Analysis*
| Restraint | (~) % Impact on CAGR Forecast | Geographic Relevance | Impact Timeline |
|---|---|---|---|
| Limited field expertise for interpreting AE signals | -0.8% | Global, most acute in emerging markets | Medium term (2-4 years) |
| High initial equipment and calibration cost | -0.6% | Global, particularly affecting SMEs | Short term (≤ 2 years) |
| False-positive rates in noisy industrial environments | -0.4% | Global, concentrated in heavy industry | Medium term (2-4 years) |
| Lack of standardized testing protocols for new composite materials | -0.3% | Global, affecting aerospace and automotive | Long term (≥ 4 years) |
| Source: Mordor Intelligence | |||
Limited Field Expertise for Interpreting AE Signals
Fewer than 5,000 Level III technicians hold globally recognized credentials, creating scheduling bottlenecks, especially in emerging economies.[3]American Society for Nondestructive Testing, “Personnel Qualification and Certification,” asnt.org Automated pattern-recognition algorithms are improving; however, most pipelines and refineries still require human verification of critical waveforms, which slows project rollouts and reduces the CAGR of the acoustic emission testing market by 0.8 percentage points.
High Initial Equipment and Calibration Cost
A full eight-channel system with advanced analytics routinely exceeds USD 100,000, deterring small operators. Mandatory annual sensor calibration adds a recurring expense. MEMS-based platforms promise 60-70% hardware savings but are still in the early stages of commercial deployment. Until costs fall, some firms postpone projects, shaving 0.6 percentage points off growth.
*Our forecasts treat driver/restraint impacts as directional, not additive. The impact forecasts reflect baseline growth, mix effects, and variable interactions.
Segment Analysis
By Component – Software Accelerates Intelligence Integration
The segment captured a 41.92% market share of the acoustic emission testing market for sensors in 2025, underpinning every deployment with piezoelectric or emerging MEMS transducers. Amplifiers and data acquisition units supply the traditional stack; however, revenue growth is shifting toward software, forecasted to grow at an 8.45% CAGR through 2031. Artificial-intelligence-driven platforms now automatically classify waveform modes and track defect growth trends, significantly reducing the time required for interpretation by certified analysts. Cloud variants pool multi-site data to benchmark asset health and streamline regulatory submissions. Many operators now allocate more funds for licenses than for hardware, indicating a significant shift in the acoustic emission testing market.
Integration momentum also stems from open APIs that channel acoustic streams into digital-twin models. Industrial software ecosystems such as OSIsoft PI and IBM Maximo now accept acoustic emission tags, enabling closed-loop maintenance orchestration. Vendors that started as sensor specialists are acquiring code bases or partnering with analytics houses to stay relevant, reflecting the broader convergence sweeping the acoustic emission testing industry.


By Portability – Automation Redefines Inspection
Portable kits retained a 45.15% share in 2025 because field crews still rely on handheld probes for spot checks on tanks and pressure vessels. The acoustic emission testing market size attached to these kits is stable but growing modestly as replacement cycles mature. Stationary racks serve continuous monitoring roles in petrochemical units and laboratories, offering superior signal-to-noise performance.
The real momentum lies with automated and robotic platforms, advancing at an 11.4% CAGR. Autonomous crawlers fitted with ring-type transducers now patrol pipelines and tank floors, transmitting encrypted data over LTE links to cloud dashboards. Drone-borne sensors inspect flare stacks without the need for scaffolding. This hands-off model reduces confined-space entry risk and minimizes labor overhead, making automation a central pillar of the acoustic emission testing market's expansion.
By End-User Industry – Automotive Upshift
Oil and gas accounted for 24.35% of the acoustic emission testing market size in 2025, anchored by mandatory integrity programs and high consequence failure costs. Nuclear power plants and refineries remain steady adopters as well. Yet, the automotive and transportation sector is racing ahead at a 9.85% CAGR. Electric-vehicle battery packs generate high-frequency acoustic signatures during lithium plating and gas generation; monitoring those waveforms yields early alarms on thermal runaway. Automakers also use acoustic emission arrays to qualify lightweight aluminum and carbon-fiber chassis parts. As electrification targets become increasingly stringent, this sector will exert a growing influence over the acoustic emission testing market.
Manufacturing, heavy engineering, and construction continue to adopt technology for monitoring rotating equipment and bridge health surveillance, respectively. Meanwhile, semiconductor fabs are piloting wafer-level acoustic emission checks to detect micro-cracks in advanced packages, hinting at a new frontier for the acoustic emission testing industry.
Geography Analysis
The Asia-Pacific region held 34.05% of the acoustic emission testing market in 2025 and is projected to grow at a 6.95% CAGR through 2031. China’s oil and gas pipeline build-out, along with its aggressive refinery upgrades, fuels bulk demand, while Japan applies this method to precision manufacturing and composite aerospace parts. India’s public-sector power utilities are embedding continuous monitoring on high-pressure boilers to reduce forced outages. Regional governments now reference acoustic emission in safety codes, creating structural demand for insulation.
North America ranks second by value, propelled by the U.S. integrity-management rule that mandates continuous monitoring of hazardous-liquid pipelines. Aging bridges and wind turbines add incremental pull for fixed sensor arrays. Canada’s oil sands and natural-gas liquids pipelines offer lucrative opportunities; Mexico’s emerging automotive corridor is also adopting battery-pack monitoring as it scales up electric-vehicle exports.
Europe maintains a mature yet innovation-oriented footprint. The Pressure Equipment Directive promotes compliance-driven purchasing, while aerospace clusters in France and Germany integrate multi-channel systems into factory acceptance tests. European initiatives surrounding Industry 4.0 are driving the adoption of cloud analytics, providing software vendors with a premium foothold in the acoustic emission testing market.

Competitive Landscape
The acoustic emission testing market remains moderately fragmented. MISTRAS Group and Parker Hannifin head the traditional service-plus-hardware segment, leveraging global service crews and turnkey project credentials. Mid-tier firms, such as TÜV Rheinland Sonovation, position themselves on domain expertise and regulatory advisory services. New entrants with no legacy hardware burden are differentiating via AI-first cloud platforms, sometimes bundling white-label MEMS sensor modules from Asian foundries.
Strategic moves are increasingly centered on bolt-on acquisitions that fill gaps in software or robotics. MISTRAS’s purchase of Tectus added subsea capability, while Parker Hannifin’s expansion invested USD 15 million to localize MEMS sensor lines. Patent-filing trends confirm the shift, as the share of claims covering automated signal interpretation rose sharply in 2025.[4]United States Patent and Trademark Office, “Patent Database Search Results,” uspto.gov White-space opportunities persist in additive manufacturing, hydrogen pipelines, and offshore wind, where acoustic emission phenomena differ from legacy metals, encouraging specialized startups to emerge.
Looking ahead, integration with plant digital twins and remote operations centers will determine market share. Vendors that can seamlessly embed acoustic streams into enterprise analytics stacks will capture disproportionate value in the acoustic emission testing market, even if their hardware footprint is small.
Acoustic Emission Testing Industry Leaders
MISTRAS Group Inc.
TÜV Rheinland Sonovation GmbH
Vallen Systeme GmbH
Parker Hannifin Corporation (Physical Acoustics)
KRN Services Inc.
- *Disclaimer: Major Players sorted in no particular order


Recent Industry Developments
- September 2025: Parker Hannifin Corporation committed USD 15 million to enlarge its Princeton Junction production hub, adding MEMS sensor lines for aerospace and automotive clientele.
- August 2025: MISTRAS Group acquired Norway-based Tectus AS for USD 12 million, enhancing offshore monitoring offerings.
- July 2025: TÜV Rheinland Sonovation rolled out an AI-enabled automated monitoring platform for power and chemical plants.
- June 2025: Hexagon’s Nexus Integrity Center secured a USD 8 million contract to outfit 500 miles of U.S. pipeline with continuous acoustic emission monitoring.


Global Acoustic Emission Testing Market Report Scope
Acoustic Emission (AE) Testing is a non-destructive testing (NDT) technique used to identify and monitor stress or sound waves released due to the rapid energy discharge within a material. These waves, referred to as acoustic emissions, occur when a material experiences deformation, crack formation, or other structural changes under stress.
The study tracks the revenue accrued through the sale of acoustic emission testing by various players across the globe. It also tracks the key market parameters, underlying growth influencers, and major vendors operating in the industry, which supports the market estimations and growth rates over the forecast period. The study further analyses the overall impact of COVID-19 aftereffects and other macroeconomic factors on the market. The report’s scope encompasses market sizing and forecasts for the various market segments.
The acoustic emission testing market is segmented by equipment (sensors, amplifiers, detection instruments, calibrators, and others), application (storage tank, pipeline, aging aircraft, turbine, structural monitoring, nuclear tank, marine, tube trailer, advanced material), and geography (North America, Europe, Asia Pacific, Middle East and Africa, and Latin America). The market sizes and forecasts regarding value (USD) for all the above segments are provided.
| Sensors |
| Amplifiers |
| Data Acquisition Systems |
| Software |
| Portable / Handheld |
| Stationary / Benchtop |
| Automated / Robotic |
| Oil and Gas |
| Power Generation |
| Aerospace |
| Defense |
| Automotive and Transportation |
| Manufacturing and Heavy Engineering |
| Construction and Infrastructure |
| Chemical and Petrochemical |
| Marine and Ship Building |
| Electronics and Semiconductor |
| Mining |
| Medical Devices |
| Others |
| North America | United States | |
| Canada | ||
| Mexico | ||
| South America | Brazil | |
| Argentina | ||
| Rest of South America | ||
| Europe | Germany | |
| United Kingdom | ||
| France | ||
| Italy | ||
| Spain | ||
| Rest of Europe | ||
| Asia Pacific | China | |
| Japan | ||
| India | ||
| South Korea | ||
| South-East Asia | ||
| Rest of Asia Pacific | ||
| Middle East and Africa | Middle East | Saudi Arabia |
| United Arab Emirates | ||
| Turkey | ||
| Rest of Middle East | ||
| Africa | South Africa | |
| Nigeria | ||
| Rest of Africa | ||
| By Component | Sensors | ||
| Amplifiers | |||
| Data Acquisition Systems | |||
| Software | |||
| By Portability | Portable / Handheld | ||
| Stationary / Benchtop | |||
| Automated / Robotic | |||
| By End-user Industry | Oil and Gas | ||
| Power Generation | |||
| Aerospace | |||
| Defense | |||
| Automotive and Transportation | |||
| Manufacturing and Heavy Engineering | |||
| Construction and Infrastructure | |||
| Chemical and Petrochemical | |||
| Marine and Ship Building | |||
| Electronics and Semiconductor | |||
| Mining | |||
| Medical Devices | |||
| Others | |||
| By Geography | North America | United States | |
| Canada | |||
| Mexico | |||
| South America | Brazil | ||
| Argentina | |||
| Rest of South America | |||
| Europe | Germany | ||
| United Kingdom | |||
| France | |||
| Italy | |||
| Spain | |||
| Rest of Europe | |||
| Asia Pacific | China | ||
| Japan | |||
| India | |||
| South Korea | |||
| South-East Asia | |||
| Rest of Asia Pacific | |||
| Middle East and Africa | Middle East | Saudi Arabia | |
| United Arab Emirates | |||
| Turkey | |||
| Rest of Middle East | |||
| Africa | South Africa | ||
| Nigeria | |||
| Rest of Africa | |||


Key Questions Answered in the Report
What is the size of the acoustic emission testing market in 2026?
The acoustic emission testing market size is expected to reach USD 422.64 million by 2026.
What is the expected growth rate for acoustic emission testing through 2031?
The market is projected to grow at a 5.34% CAGR between 2026 and 2031.
Which region leads demand for acoustic emission testing?
The Asia-Pacific region holds the top position with a 34.05% revenue share and a 6.95% CAGR growth rate.
Why is automotive adoption of acoustic emission testing accelerating?
Electric-vehicle battery monitoring and lightweight composite parts inspection drive a 9.85% CAGR in the automotive and transportation segment.
What technology trend is reshaping the landscape of the segment?
AI-enabled software and cloud analytics are propelling the software component to an 8.45% CAGR, redefining value capture beyond hardware.
What limits faster market uptake?
The scarcity of certified analysts and high upfront system costs remain the chief restraints, limiting overall growth potential.
Page last updated on:


