3D Radar Market Size and Share
Market Overview
| Study Period | 2020 - 2031 |
|---|---|
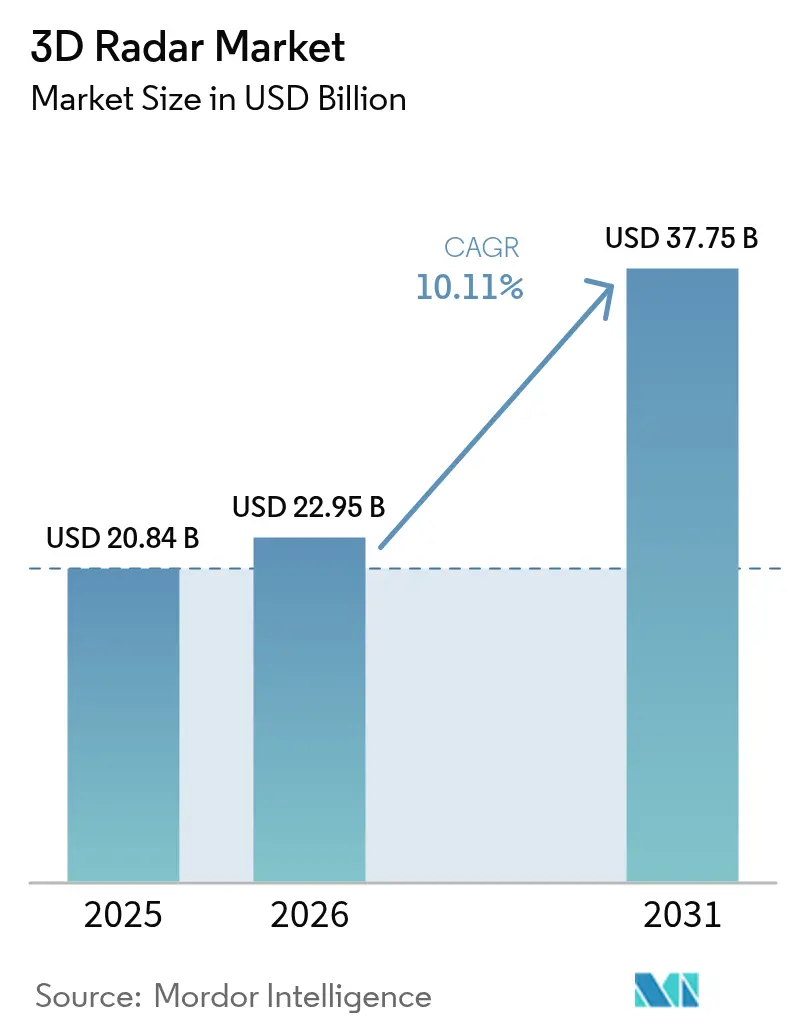
| Market Size (2026) | USD 22.95 Billion |
| Market Size (2031) | USD 37.75 Billion |
| Growth Rate (2026 - 2031) | 10.11% CAGR |
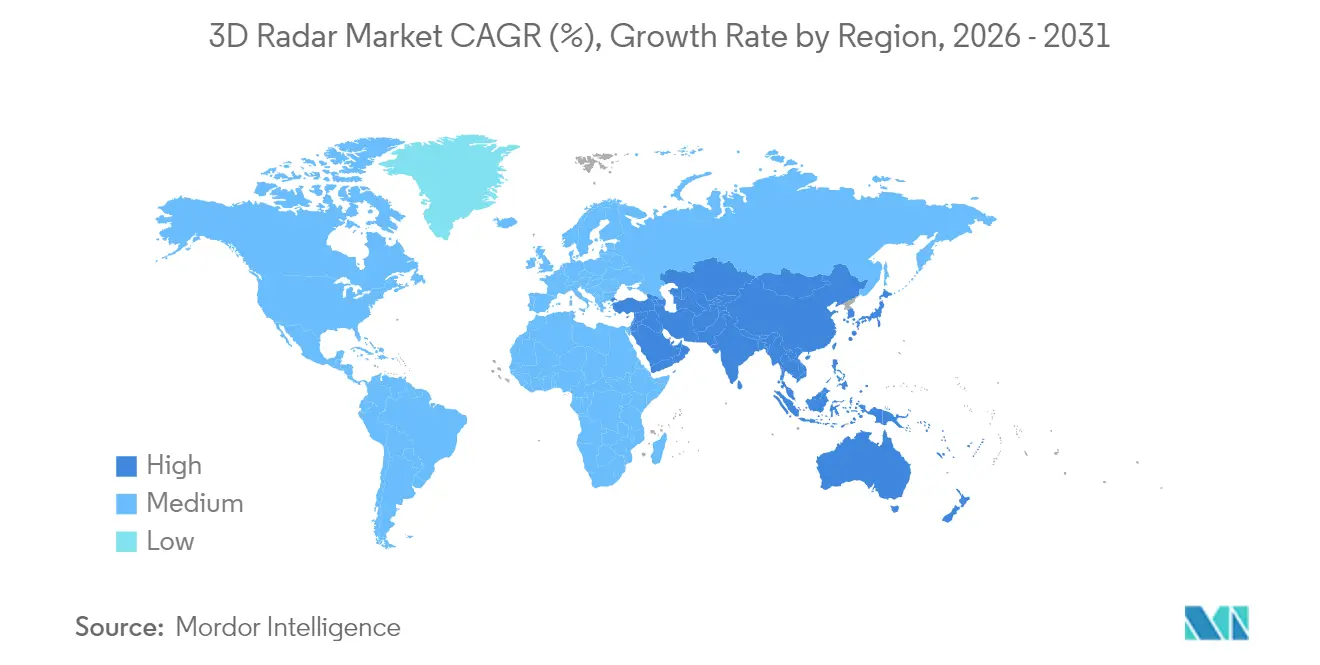
| Fastest Growing Market | Asia Pacific |
| Largest Market | North America |
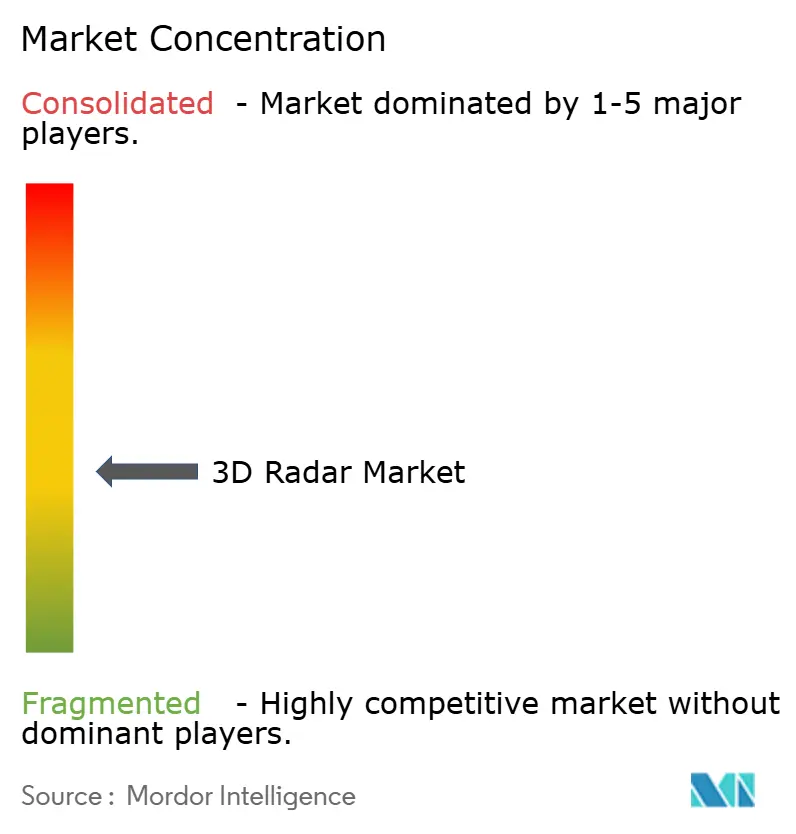
| Market Concentration | Medium |
Major Players *Disclaimer: Major Players sorted in no particular order Image © Mordor Intelligence. Reuse requires attribution under CC BY 4.0. | |
3D Radar Market Analysis by Mordor Intelligence
The 3D radar market size is expected to grow from USD 20.84 billion in 2025 to USD 22.95 billion in 2026 and is forecast to reach USD 37.75 billion by 2031 at 10.11% CAGR over 2026-2031. Expansion stems from rising defense modernization, wider automotive adoption of radar-based driver-assistance technologies, and strong investment in space-based surveillance. GaN-powered AESA architectures are extending detection ranges by nearly 25% in contested electromagnetic environments, while artificial intelligence is shortening target-classification cycles from minutes to seconds. Emerging requirements for low-Earth-orbit (LEO) satellite tracking, counter-unmanned-aircraft systems (C-UAS), and climate-resilience weather monitoring are widening the addressable opportunity set. Against this backdrop, manufacturers are prioritizing open-system architectures and software-defined upgrades to maximize lifecycle value and capture recurring revenue streams in the 3D radar market.
Key Report Takeaways
- By platform, ground-based systems led with 45.58% of 3D radar market share in 2025; airborne platforms are projected to grow at 12.23% CAGR through 2031.
- By range type, long-range radars held 40.52% share of the 3D radar market size in 2025, while short-range systems are set to advance at a 14.34% CAGR to 2031.
- By frequency band, S-band maintained 33.12% revenue share in 2025; Ku/Ka band solutions are forecast to post the fastest 15.31% CAGR between 2026-2031.
- By component, hardware accounted for 70.76% of the 3D radar market size in 2025; software is poised to expand at a 13.47% CAGR over the same period.
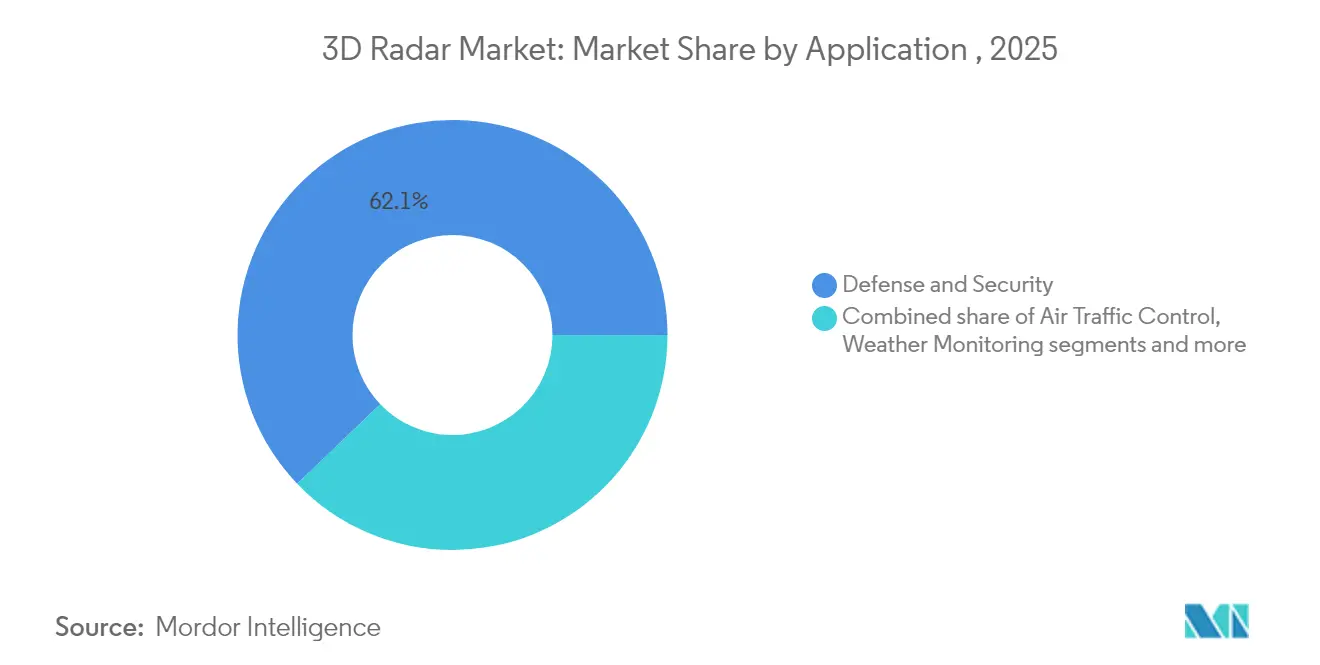
- By application, defense and security dominated with 62.15% share in 2025, whereas automotive and industrial uses are rising at a 16.88% CAGR to 2031.
- By geography, North America commanded 38.22% of 3D radar market share in 2025; Asia-Pacific represents the fastest-growing region, progressing at a 12.35% CAGR through 2031.
Note: Market size and forecast figures in this report are generated using Mordor Intelligence’s proprietary estimation framework, updated with the latest available data and insights as of 2026.
Global 3D Radar Market Trends and Insights
Drivers Impact Analysis*
| Driver | (~) % Impact on CAGR Forecast | Geographic Relevance | Impact Timeline |
|---|---|---|---|
| Rapid deployment of 3D multi-mission radars in NATO C-UAS programs | +2.1% | Europe, spillover to Middle East | Medium term (2-4 years) |
| Surge in LEO satellite constellations driving space-based 3D tracking radars | +1.8% | North America, global impact | Long term (≥ 4 years) |
| Automotive OEM shift toward 4D imaging radar for Level-3+ ADAS | +2.4% | Asia, Europe, North America | Medium term (2-4 years) |
| Adoption of GaN-based AESA 3D radars for integrated air-and-missile defense | +1.7% | Middle East, Asia-Pacific, Europe | Medium term (2-4 years) |
| Increased demand for meteorological 3D Doppler radars for climate resilience | +1.3% | Pacific Islands, Africa, South America | Long term (≥ 4 years) |
| Civil airport upgrades to digital 3D surveillance radars | +1.5% | US & EU, expanding to Asia-Pacific | Medium term (2-4 years) |
| Source: Mordor Intelligence | |||
Rapid deployment of 3D multi-mission radars in NATO counter-UAS programs
Across Europe, procurement authorities are funding multi-mission radars that can fuse air-surveillance, ground-surveillance, and coastal-surveillance roles within a single array. Italy’s EUR 73 million Skynex contract exemplifies this shift, pairing Rheinmetall cannons with a 50 km-range 3D radar that tracks rotary-wing drones at low altitude. These systems leverage machine learning for drone discrimination, enabling near-real-time threat assessment and reducing operator workload. Their modular architecture supports plug-and-fight integration into existing C-UAS command networks, accelerating fielding schedules. As NATO standardizes threat libraries and software updates, volume orders are driving cost curves lower, reinforcing demand in the 3D radar market. [1]Army Recognition, “Italy Officially Selects Germany’s Rheinmetall Skynex Air Defense System,” armyrecognition.com
Surge in LEO satellite constellations demanding space-based 3D tracking radars
Commercial operators are launching hundreds of small satellites for broadband, Earth-observation, and in-orbit servicing. To manage the resulting traffic, governments are procuring precision 3D tracking radars capable of cataloguing objects below 1 cm at altitudes of 500-1,200 km. Lockheed Martin’s strategy for proliferated architectures illustrates how space surveillance now demands Ku/Ka band arrays linked to AI-driven ground segments. North America’s end-users are prioritizing shared civil-military space domain awareness platforms, bolstering the long-term outlook for the 3D radar market.
Automotive OEM shift toward 4D imaging radar for Level 3+ ADAS
Regulatory deadlines in Europe and the United States are accelerating rollout of blind-spot, automatic emergency braking, and driver-monitoring functions. Tier-1 suppliers are therefore upgrading 3D radar modules to 4D imaging capability, adding elevation data and micro-Doppler signatures. Test campaigns show detection of pedestrians at 200 m with 100° horizontal coverage, meeting Euro NCAP 2026 scenarios. Chipmakers are incorporating AI accelerators in mmWave radar SoCs, enhancing in-cab gesture recognition. This technology shift underpins the fastest-growing vertical in the 3D radar market. [2]National Highway Traffic Safety Administration, “Advanced Driver Assistance Systems Roadmap,” nhtsa.gov
Adoption of GaN-based AESA 3D radars for integrated air & missile defense modernization
GaN power amplifiers increase transmitter efficiency and allow higher duty cycles, providing 25% range improvement versus gallium-arsenide. India’s Uttam radar for Tejas Mk2, fielding 900 T/R modules, demonstrates how domestic supply chains are scaling GaN production. Similar upgrades on Turkish F-16 fleets and Gulf-region ground stations illustrate global traction. As nations confront cruise-missile saturation, GaN-enabled 3D radar market demand is set to climb through mid-decade. [3]Defence India, “Uttam GaN-Based AESA Radar for Tejas Mk2 Enters Production,” defence.in
Capital-intensive transition from legacy 2D to phased-array 3D radars in emerging nations
Many developing states still rely on coaxial-feed 2D radars commissioned in the 1990s. Upgrading to digital beam-forming arrays often requires new shelters, power conditioning, and fiber backhaul. Zimbabwe’s weather-radar renewal program illustrates the funding gap: five Doppler sites required external financing as well as operator upskilling. Similar financing hurdles slow defense deployments, tempering medium-term growth in segments of the 3D radar market.
Scarcity of RF spectrum in C & X bands limiting urban installations
Cellular backhaul, fixed satellite services, and broadband providers all compete for mid-band spectrum prized by primary-surveillance radars. Recent Federal Communications Commission rulings allocating E-band to satellite mega-constellations underscore growing congestion. Operators therefore experiment with K-band and Ka-band alternatives, but higher frequencies suffer rain fade. The regulatory bottleneck places a drag on urban 3D radar market projects until dynamic-spectrum-sharing mechanisms gain traction.
*Our forecasts treat driver/restraint impacts as directional, not additive. The impact forecasts reflect baseline growth, mix effects, and variable interactions.
Segment Analysis
By Platform: Ground-Based Systems Underpin Modern Air-and-Missile Defense
Ground-based installations captured 45.58% of 3D radar market share in 2025, reflecting their pivotal role in border surveillance, early-warning, and C-UAS missions. Power-optimized GaN T/R modules enable transportable arrays that deploy within four hours and connect to tactical networks via software-defined radios. Ground-based radars are benefiting from AI algorithms that classify drones under 2 kg, improving decision-making for layered defense architectures.
The airborne segment is forecast to expand at 12.23% CAGR as fifth-generation fighters integrate indigenous AESA radars with over 900 modules, extending look-down detection against low-observable targets. Modular line-replaceable units cut maintenance turnaround by 30%, positioning airborne solutions as a premium slice of the 3D radar market. Naval platforms add growth momentum through lightweight solid-state rotating arrays designed for offshore patrol vessels guarding exclusive economic zones.


By Range Type: Long-Range Arrays Safeguard National Airspace
Long-range systems commanded 40.52% of the 3D radar market size in 2025, protecting air-defense identification zones and strategic assets. Recent deployments achieve 600 km instrumented range while tracking 1,500 objects, enabled by digital waveform agility and edge processing. AI-assisted clutter maps improve low-RCS detection over mountainous terrain, vital for hypersonic-missile warning.
Short-range radars, expanding at a 14.34% CAGR, are integrated into vehicle-mounted C-UAS kits and perimeter-security towers. Coprime-sampling techniques reduce channel counts, shrinking antenna footprints for rooftop installation. Medium-range arrays address mobile-force protection, balancing 3 km minimum range with 120 km maximum reach, thereby filling doctrinal gaps in layered defense and broadening opportunities across the 3D radar market.
By Frequency Band: S-Band Versatility Meets Ku/Ka Innovation
S-band retained 33.12% revenue share in 2025 thanks to robust weather penetration, making it the workhorse for maritime and meteorological surveillance. Recent GaN-on-silicon breakthroughs permit 50 V operation with negligible power droop, boosting transmitter reliability and lifecycle economy.
Ku/Ka bands are advancing at a 15.31% CAGR on the back of LEO-tracking demand and high-resolution imaging missions. Assimilating Ku-band data into numerical-weather-prediction models proved to sharpen rainfall forecasts, underscoring dual-use value. X-band remains indispensable for naval fire control owing to narrow beams and fine range resolution, while L-band supports long-range line-of-sight with reduced attenuation, collectively enriching the 3D radar market.
By Application: Defense Primacy Amid Automotive Upswing
Defense and security applications held 62.15% share in 2025, anchored by missile-defeat investments of USD 28.4 billion in the latest United States budget cycle. Multi-mission fire-control radars now track ballistic, cruise, and hypersonic threats within a single array, reducing logistics footprints.
Automotive and industrial uses are registering a 16.88% CAGR as OEMs embed 4D imaging radars to meet Euro-NCAP 2026 standards. Warehouse automation and smart-city traffic management further diversify demand. Weather monitoring is gaining momentum through satellite constellations delivering hourly global scans. Space-surveillance and air-traffic-control segments continue to modernize as digital beam-forming upgrades roll out, expanding the overall 3D radar market.
By Component: Hardware Dominance Supports Rapid Software Upsell
Hardware contributed 70.76% of 2025 revenue as countries invested in antenna arrays, RF front-ends, and ruggedized processors. Additive-manufactured waveguide components trim lead times by 40% and enable dual-band OMTs for multi-mission payloads. Meanwhile, miniaturized RF-system-on-chip modules are lowering size, weight, and power, broadening use in unmanned platforms.
Software is forecast to rise at 13.47% CAGR, reflecting demand for AI-enabled target recognition, cognitive electronic protection, and predictive maintenance. Digital twins allow operators to rehearse mission scenarios and deploy firmware patches over-the-air, increasing the recurring revenue slice of the 3D radar market. Service contracts round out the value chain, covering training, calibration, and lifecycle support in an increasingly complex threat environment.
Geography Analysis
North America led with 38.22% of 3D radar market share in 2025, underpinned by USD 28.4 billion earmarked for missile-defeat systems and an additional USD 9.9 billion Pacific Deterrence Initiative allocation. Recent contracts for AN/TPY-4 expeditionary radars illustrate the push toward transportable long-range coverage. Regional suppliers emphasize open-system interfaces and AI-driven sensor fusion, strengthening inter-service interoperability.
Asia-Pacific is climbing at a 12.35% CAGR as indigenous programs close capability gaps. India’s self-sufficiency in long-range AESA radars bolsters border surveillance, while Japan’s plan to double defense outlays to 2% of GDP accelerates integrated air-and-missile defense spending. Local manufacturing initiatives such as the PULSE joint venture reflect the region’s appetite for sovereign production within the 3D radar market.
Europe maintains momentum through NATO counter-UAS requirements and rising defense budgets, with 23 member states on track to hit the 2% target. Italy’s Skynex, Poland’s 4.7% GDP ambition, and EDF funding for cognitive-radar research highlight the continent’s investment trajectory. Spectrum-management reforms will shape urban deployments, influencing long-term 3D radar market growth.
The Middle East and Africa are upgrading layered air defenses amid drone incursions, often via offset agreements that spur local assembly. South American states prioritize weather-radar modernization for disaster resilience, working with multilateral financiers to secure phased-array technology. Collectively these regions contribute incremental demand, reinforcing the global expansion of the 3D radar market.

Competitive Landscape
Incumbents such as Northrop Grumman, Raytheon, Thales, and Lockheed Martin anchor the high-end defense segment, leveraging decades of R&D and proprietary GaN foundries to safeguard margins. Recent strategies pivot toward modular open-system architecture, enabling software monetization long after hardware delivery. Localization partnerships—exemplified by the EDGE-Indra PULSE venture—help incumbents access protected markets and comply with offset rules.
Disruptive growth opportunities center on weather and automotive niches. Tomorrow.io’s miniaturized weather-radar constellation showcases a space-as-a-service model, while startups refine K-band collision-avoidance sensors for autonomous vehicles. Software specialists are emerging as critical partners, delivering AI toolchains and synthetic data sets that cut algorithm-training times by 60%. The 3D radar market thus rewards ecosystem orchestration over hardware specs alone.
Customer evaluations increasingly weigh cyber-hardening, lifecycle cost, and upgrade cadence. Vendors that integrate predictive-maintenance analytics and remote-update capabilities are winning service extensions, turning one-time sales into long-term annuities. Competitive intensity is expected to rise as regional manufacturers mature, yet first-mover advantages in GaN processes and AI-ready architectures continue to confer pricing power to established leaders.
3D Radar Industry Leaders
Raytheon Technologies Corporation
Northrop Grumman Corporation
Thales Group
Lockheed Martin Corporation
Saab AB
- *Disclaimer: Major Players sorted in no particular order

Recent Industry Developments
- May 2025: Bharat Electronics began production of the Uttam GaN-based AESA radar for Tejas Mk2, fielding 900 T/R modules and extending range by 25% in dense EW conditions.
- May 2025: The Indian Army fielded next-generation GaN AESA low-level lightweight radars for counter-UAV surveillance across contested borders.
- April 2025: Tomorrow.io advanced the first weather-radar satellite constellation, promising hourly global revisit by end-2025.
- January 2025: Italy awarded Rheinmetall EUR 73 million to supply Skynex air-defense batteries featuring 3D XTAR radars with 50 km detection range.


Research Methodology Framework and Report Scope
Market Definitions and Key Coverage
Our study regards the 3D radar market as all newly manufactured sensors that deliver simultaneous range, azimuth, and elevation data across ground, naval, and airborne platforms and are valued in USD. Measurements cover hardware, integral software, and related services that ship with the radar system.
Scope exclusion: legacy 2 D radars and purely software-defined post-processing suites without an associated 3D sensor are not counted.
Segmentation Overview
- Ground
- Naval
- By Range Type
- Long Range
- Medium Range
- Short Range
- By Frequency Band
- L Band
- S Band
- C Band
- X Band
- Ku / Ka Band
- By Application
- Defense and Security
- Air Traffic Control
- Weather Monitoring
- Automotive and Industrial
- Space Surveillance
- By Component
- Hardware
- Software
- Service
- By Geography
- North America
- United States
- Canada
- Europe
- United Kingdom
- Germany
- France
- Italy
- Rest of Europe
- Asia-Pacific
- China
- Japan
- India
- South Korea
- Rest of Asia-Pacific
- Middle East
- Israel
- Saudi Arabia
- United Arab Emirates
- Turkey
- Rest of Middle East
- Africa
- South Africa
- Egypt
- Rest of Africa
- South America
- Brazil
- Argentina
- Rest of South America
- North America
Detailed Research Methodology and Data Validation
Primary Research
Mordor analysts interviewed radar design engineers, defense acquisition officers in North America, Europe, and Asia, and civil-aviation regulators. Those discussions let us validate average selling prices, service attach rates, and the pace at which GaN-based S-band units are displacing legacy magnetron sets.
Desk Research
We started with open databases from bodies such as the World Meteorological Organization, ICAO, SIPRI, and Eurocontrol; these give us long-run series on weather-station deployments, commercial air-traffic movements, and defense capital outlays. Trade registries, patent filings accessed through Questel, and customs shipment data from Volza then help us tag typical export unit values by band and range. Company 10-Ks, investor decks, and procurement notices supply recent contract volumes and pricing windows. Finally, subscription feeds like Dow Jones Factiva and D&B Hoovers provide timely revenue splits that anchor vendor roll-ups. The sources named are illustrative; dozens of additional public records were reviewed.
Market-Sizing & Forecasting
A top-down model begins with platform pools: active military fleets, national weather-station upgrades, and new ADAS-equipped vehicle production, which are then linked to assumed radar penetration ratios. Supplier roll-ups and sampled ASP × unit checks offer a bottom-up sense check before totals are finalized. Key variables tracked include defense capital expenditure, commercial flight hours, vehicle L3+ autonomy build rates, Ku/Ka band adoption, and ASP erosion tied to GaN yields. A multivariate regression with scenario analysis projects these drivers through 2030, while gap areas, most often naval volumes, are infilled using three-year moving averages of tender awards.
Data Validation & Update Cycle
Outputs pass a four-layer review, starting with automated variance flags, followed by peer analyst checks, managerial sign-off, and a pre-publish refresh. We update every twelve months or sooner if major contract awards or regulatory shifts alter our view.
Why Mordor's 3D Radar Baseline Commands Reliability
Published estimates vary, and that is natural when firms mix platform scopes, blend currency years, or refresh models infrequently.
Key gap drivers include whether airborne retrofit kits are counted, if software maintenance is bundled, the currency conversion year applied, and how aggressively ASP deflation is assumed.
Benchmark comparison
| Market Size | Anonymized source | Primary gap driver |
|---|---|---|
| USD 20.84 B (2025) | Mordor Intelligence | - |
| USD 20.8 B (2024) | Global Consultancy A | Uses mixed hardware-service bundles and prior-year FX |
| USD 2.72 B (2024) | Regional Consultancy B | Counts hardware only, omits airborne fleet retrofits |
| USD 1.0 B (2024) | Trade Journal C | Focuses on integrated naval sets, excludes ground and civil use |
Our model aligns revenue recognition with shipment year, excludes pure retrofits, and converts at the IMF's average 2024 FX rates.
In brief, while others tilt either conservative or aggressive, our balanced, annually refreshed approach gives decision-makers a dependable midpoint grounded in verifiable drivers.


Key Questions Answered in the Report
What is driving the strong CAGR in the 3D radar market to 2031?
Rapid defense modernization, automotive adoption of 4D imaging radar, and demand for LEO satellite tracking systems underpin the double-digit CAGR.
Which platform holds the largest share of the 3D radar market?
Ground-based installations led with 45.58% share in 2025 due to their central role in air-and-missile defense networks.
Why are Ku/Ka band radars growing faster than other frequencies?
Ku/Ka bands enable high-resolution imaging and space-based tracking, supporting the surge in satellite constellations and advanced weather monitoring.
How does GaN technology improve 3D radar performance?
GaN amplifiers deliver higher power density and efficiency, extending detection ranges by about 25% and enhancing resistance to electronic counter-measures.
Which region is projected to grow fastest through 2031?
Asia-Pacific, expanding at a 12.35% CAGR, benefits from rising defense budgets, indigenous AESA programs, and expanding automotive radar production.
What role does artificial intelligence play in modern 3D radar systems?
AI accelerates target classification, optimizes waveform scheduling, and supports predictive maintenance, turning radar data into actionable insights in seconds.
How large is the 3D Radar market in 2026?
The 3D Radar Market size is expected to grow from USD 20.84 billion in 2025 to USD 22.95 billion in 2026 and is forecast to reach USD 37.75 billion by 2031 at 10.11% CAGR over 2026-2031.
Page last updated on:


