3D Motion Capture Market Size and Share
Market Overview
| Study Period | 2020 - 2031 |
|---|---|
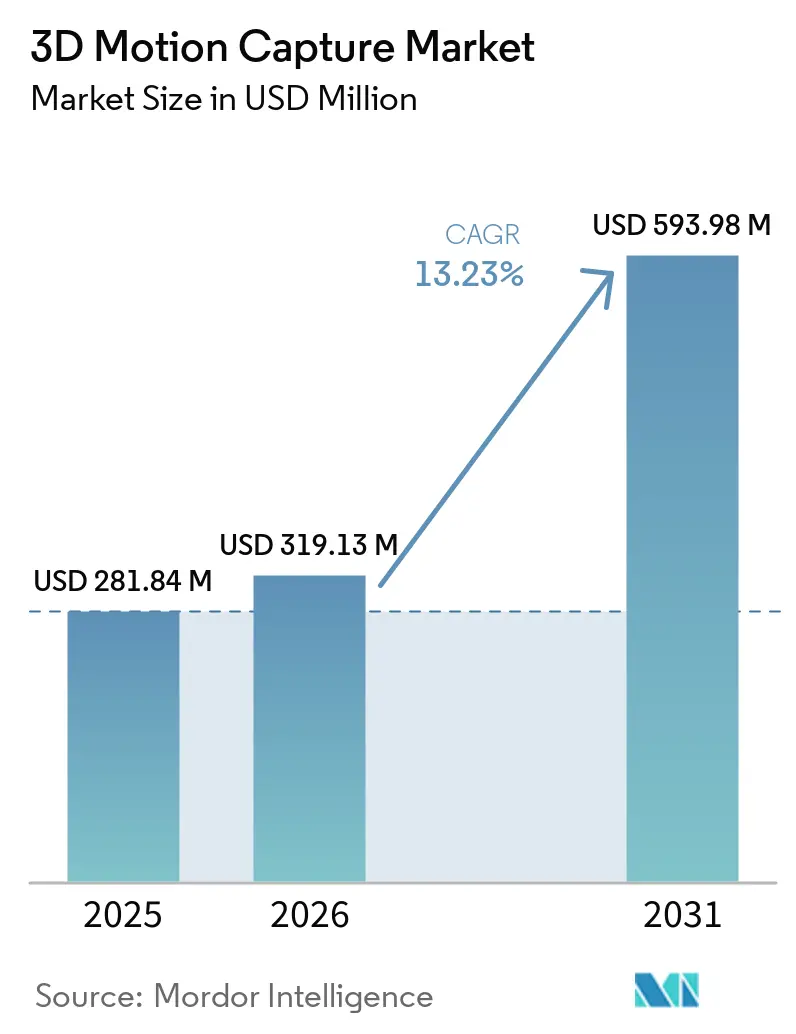
| Market Size (2026) | USD 319.13 Million |
| Market Size (2031) | USD 593.98 Million |
| Growth Rate (2026 - 2031) | 13.23% CAGR |
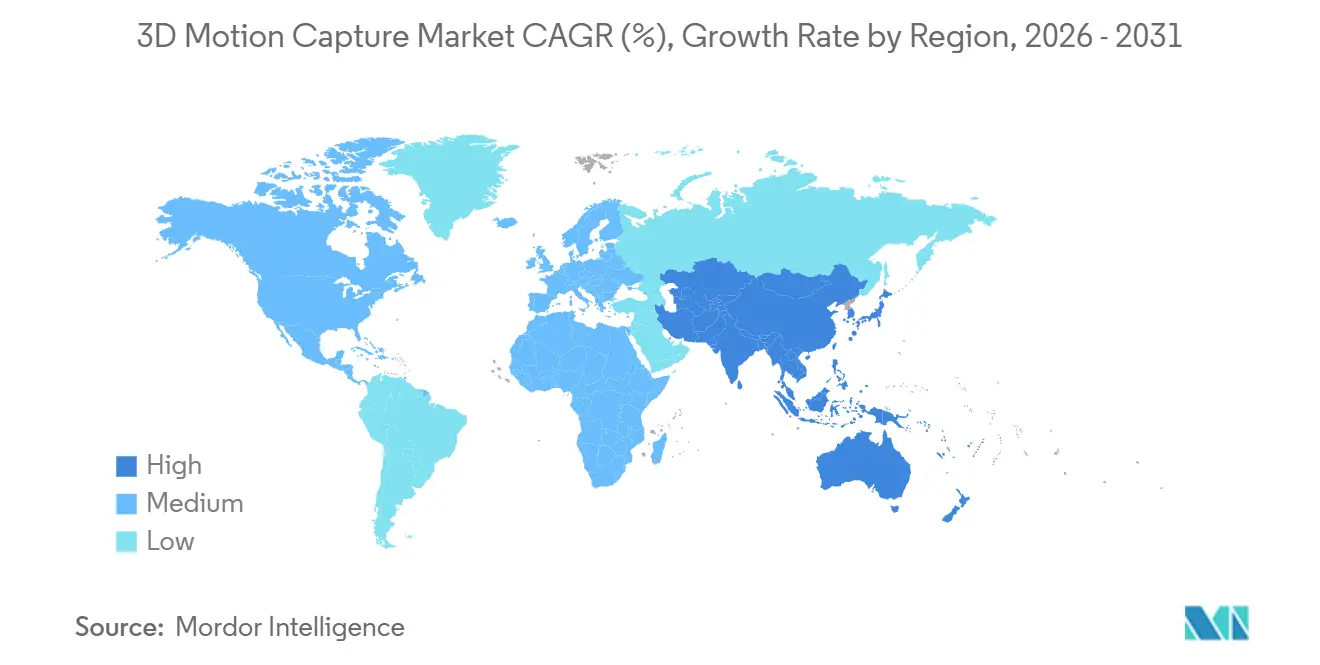
| Fastest Growing Market | Asia-Pacific |
| Largest Market | North America |
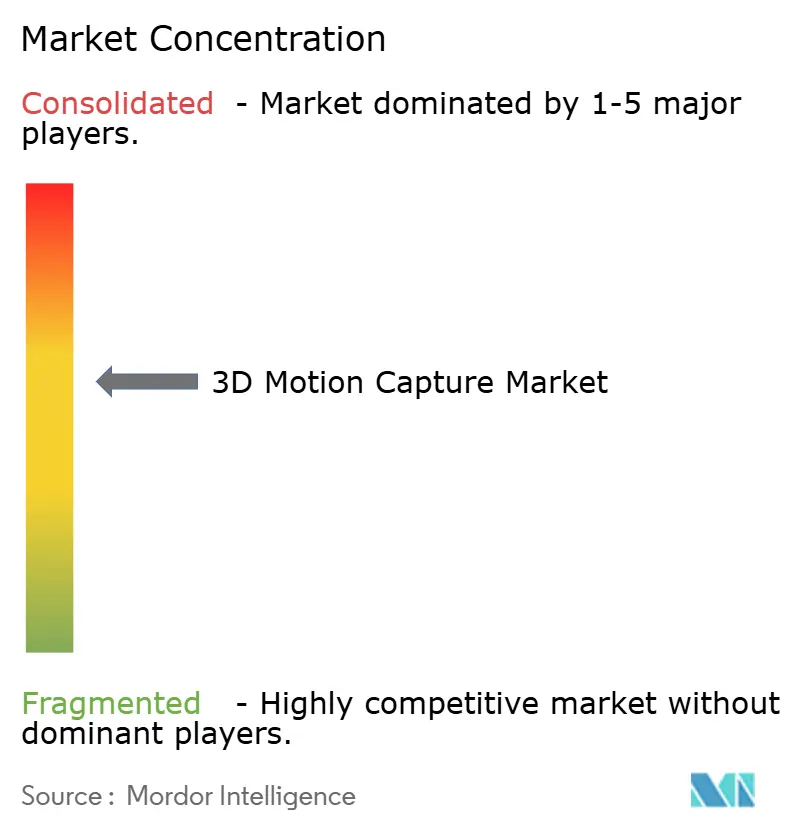
| Market Concentration | Medium |
Major Players *Disclaimer: Major Players sorted in no particular order Image © Mordor Intelligence. Reuse requires attribution under CC BY 4.0. | |
3D Motion Capture Market Analysis by Mordor Intelligence
The 3D motion capture market size was valued at USD 281.84 million in 2025 and estimated to grow from USD 319.13 million in 2026 to reach USD 593.98 million by 2031, at a CAGR of 13.23% during the forecast period (2026-2031). Strong cross-industry uptake is shifting demand beyond film studios to include tele-rehabilitation, autonomous-robot training, and industrial ergonomics. Hardware remained the principal revenue engine in 2025, yet rising workflow complexity is pushing buyers toward services that package installation, cloud processing, and real-time support. Optical cameras still dominate in accuracy-sensitive workflows, but inertial and electromagnetic alternatives are advancing quickly as portable, lower-cost options for sports science and field research. Marker-less systems, once experimental, now benefit from edge AI chips that compress latency below the 20-millisecond threshold required for immersive virtual production. Regional growth disparities persist: North America anchors half of global revenue, while Asia-Pacific delivers the fastest unit expansion on the back of animation investments, humanoid-robot programs, and a surging gaming sector.
Key Report Takeaways
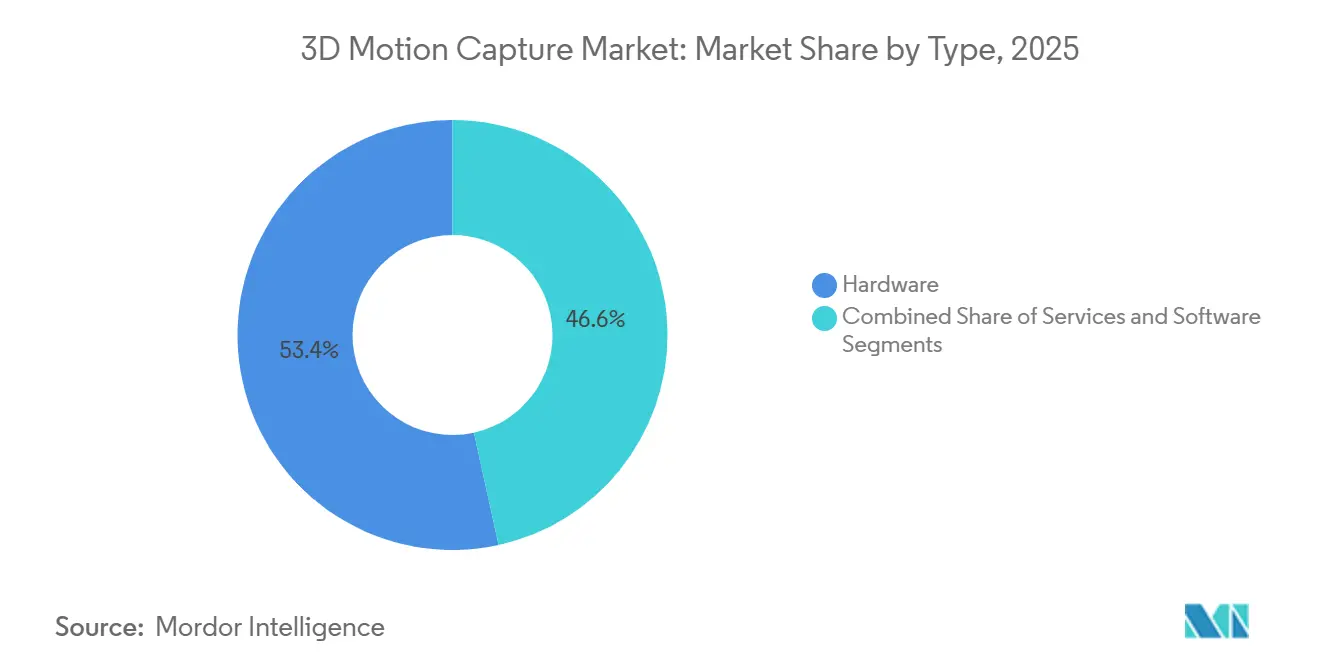
- By type, hardware commanded 53.44% of the 3D motion capture market share in 2025, while services are projected to expand at a 13.84% CAGR through 2031.
- By system, optical platforms accounted for 71.24% of 2025 turnover; non-optical solutions are advancing at a 13.62% CAGR to 2031.
- By capture technology, marker-based configurations captured 66.78% of the 3D motion capture market share in 2025, whereas marker-less solutions are forecast to grow at a 13.69% CAGR.
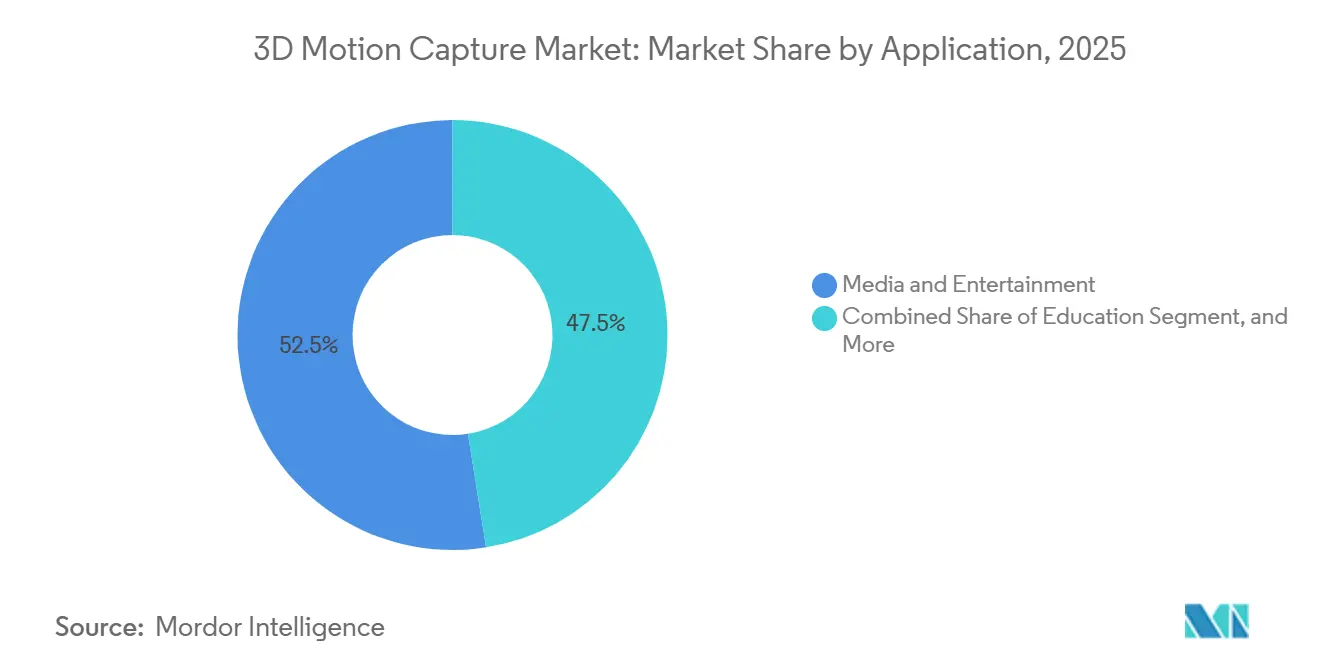
- By application, media and entertainment led with 52.49% revenue share in 2025; education is poised to expand at a 14.29% CAGR to 2031.
- By deployment mode, on-premises installations accounted for 69.74% of 2025 setups, while cloud platforms are growing at a 13.67% CAGR.
- By geography, North America accounted for 49.83% of the 3D motion capture market share in 2025, while Asia-Pacific recorded the highest projected CAGR of 14.33% through 2031.
Note: Market size and forecast figures in this report are generated using Mordor Intelligence’s proprietary estimation framework, updated with the latest available data and insights as of 2026.
Global 3D Motion Capture Market Trends and Insights
Drivers Impact Analysis*
| Driver | (~) % Impact on CAGR Forecast | Geographic Relevance | Impact Timeline |
|---|---|---|---|
| Rise in creation of more realistic virtual reality experiences | +2.8% | Global with focus on North America and Asia-Pacific gaming hubs | Medium term (2-4 years) |
| Increased usage of computer vision in professional sports analytics | +2.3% | North America and Europe, expanding to Middle East sports academies | Short term (≤2 years) |
| Growing adoption in media and entertainment production pipelines | +2.5% | North America, Asia-Pacific animation clusters, Europe film studios | Medium term (2-4 years) |
| Integration with AI-driven digital human modeling for ergonomic compliance | +1.9% | Europe and North America industrial sectors, Asia-Pacific manufacturing | Long term (≥4 years) |
| Rapid uptake of marker-less MoCap in tele-rehabilitation and remote physiotherapy | +2.1% | Global, early adoption in North America and Europe healthcare systems | Short term (≤2 years) |
| Demand for high-fidelity motion datasets to train autonomous robots | +1.7% | Asia-Pacific robotics centers, North America defense and logistics sectors | Long term (≥4 years) |
| Source: Mordor Intelligence | |||
Rise in Creation of More Realistic Virtual Reality Experiences
Studios and headset builders are converging on sub-20 millisecond motion-to-photon latency, prompting the development of hybrid optical-inertial platforms that process poses at the network edge.[1]Qualcomm Technologies Inc., “Snapdragon XR2 Gen 2 Platform Overview,” qualcomm.com Meta disclosed that full-body training assets exceeded 10 terabytes per title in 2025, highlighting data-volume pressure on pipelines. Game engines now embed turnkey retargeting, shrinking iteration cycles from days to hours. Semiconductor roadmaps add dedicated pose-fusion blocks, enabling standalone headsets to bypass tethered workstations. These advances are broadening the 3D motion capture market into enterprise collaboration tools where executives expect lifelike avatars to convey nuance during remote meetings.
Increased Usage of Computer Vision in Professional Sports Analytics
Marker-less camera arrays were installed in every National Basketball Association arena during the 2024-2025 season, capturing joint kinematics in real time.[2]National Basketball Association, “2024-2025 Season Technology Integration Report,” nba.com FIFA followed with a mandate for sub-centimeter accuracy at the 2026 World Cup, forcing vendors to time-synchronize cameras within 10 microseconds. Peer-reviewed evidence supports the shift: a 2025 Journal of Sports Sciences study linked hip-rotation asymmetry to hamstring injury prediction three weeks in advance. Middle East tennis academies now outfit courts with portable inertial suits that deliver biomechanical feedback within minutes. Together, these deployments reposition motion capture as an in-session coaching tool rather than a post-match diagnostic.
Growing Adoption in Media and Entertainment Production Pipelines
Virtual-production stages that blend LED volumes with real-time skeletal capture shaved eight weeks off post-production schedules at Sony Pictures in 2025, saving USD 2 million per feature. Netflix invested in permanent volumes on both U.S. and U.K. campuses to internalize animation workflows. Gaming studios such as Naughty Dog recorded more than 600 hours of performance data for a single title, tripling prior capture volumes. Streaming platforms’ hunger for quick iteration places sustained load on capture facilities, driving hardware replenishment and cloud-render capacity expansion across the 3D motion capture market.
Integration With AI-Driven Digital Human Modeling for Ergonomic Compliance
Automotive lines capture full-shift worker motion, feeding data into biomechanical simulators that flag repetitive-strain risks before injuries occur, reducing claims by 34% in a well-documented 2025 case. ISO and OSHA guidelines now reference motion-capture validation, mainstreaming the technology in industrial design. AI models trained on aggregate datasets predict injury likelihood across age groups, enabling manufacturers to iterate work-cell layouts pre-emptively. Subsidies from the European safety agency encourage small- and medium-sized manufacturers to adopt cloud-hosted analytics, supporting service-led growth in the 3D motion capture industry.
Restraints Impact Analysis*
| Restraint | (~) % Impact on CAGR Forecast | Geographic Relevance | Impact Timeline |
|---|---|---|---|
| High upfront cost of precision 3D MoCap ecosystems | -1.4% | Global, acute in price-sensitive South America and Africa markets | Short term (≤2 years) |
| Content-owner IP and privacy concerns for large-scale motion libraries | -0.9% | North America and Europe driven by GDPR and CCPA compliance | Medium term (2-4 years) |
| Absence of open interchange standards limiting cross-platform workflows | -0.7% | Global, fragmentation most severe in Asia-Pacific vendor ecosystems | Long term (≥4 years) |
| Supply-chain volatility for high-speed image sensors and IMUs | -1.1% | Global, bottlenecks concentrated in Asia-Pacific semiconductor fabs | Short term (≤2 years) |
| Source: Mordor Intelligence | |||
High Upfront Cost of Precision 3D MoCap Ecosystems
Enterprise optical rigs exceed USD 250,000 once cameras, calibration gear, and workstations are tallied, sidelining independent studios and grant-funded labs. Inertial alternatives drop entry hardware to USD 20,000 but impose annual cloud-processing fees of roughly USD 10,000. Import tariffs add 25-40% to list prices in South America and Africa, while sparse regional service networks inflate maintenance expenses. Subscription models, such as Qualisys’s USD 3,500-per-month offering, soften capital intensity yet still struggle where exchange-rate volatility or spotty connectivity hamper cloud reliance.
Content-Owner IP and Privacy Concerns for Large-Scale Motion Libraries
A 2025 Visual Effects Society survey showed 62% of studios restrict cloud motion processing due to ambiguous data-ownership clauses. GDPR treats gait as sensitive biometric data that demands explicit consent and minimization.[3] The Animation And VFX continues to influence motion capture compliance standards, particularly around cloud-based processing and biometric data governance. Healthcare providers must layer HIPAA-mandated encryption and audit logs, adding legal review cycles of up to nine months. Vendors have started shipping on-premise appliances that output anonymized metrics, but these edge devices sacrifice the scalability that initially made cloud platforms attractive.
*Our forecasts treat driver/restraint impacts as directional, not additive. The impact forecasts reflect baseline growth, mix effects, and variable interactions.
Segment Analysis
By Type: Services Gain as Integration Complexity Rises
Services are projected to expand at a 13.84% CAGR between 2026 and 2031, steadily eroding hardware’s 53.44% share of the 3D motion capture market recorded in 2025. Growth comes from turnkey contracts that bundle installation, calibration, training, and 24-hour remote support, allowing buyers with limited in-house expertise to deploy complex multi-camera systems confidently. Vendors capitalize on this dependence by shifting perpetual software licenses toward annual subscriptions, raising lifetime spend even as entry costs flatten. Hardware revenues persist through replacement cycles; studios renew cameras every five years to secure higher frame rates and lower latency, while clinics add wearable sensors to existing optical bays. Accessories form a durable consumables stream, though 3D-printed markers chip at margins on lower-precision parts.
Cloud processing libraries further tilt revenue toward services. Amazon Web Services introduced an auto-scaling workflow in 2025 that aligns compute bursts with production peaks, eliminating idle server capacity on-site. Annotation and quality-assurance modules now fold into managed offerings that outsource 30-40% of post-capture labor. IEEE Standard 2863 promises interoperable data exchange, a change that may commoditize raw software and push vendors to differentiate on premium service tiers such as AI-assisted retargeting or clinical trial consulting. As buyers increasingly value predictable operating budgets over capital depreciation, the services vector should capture a larger share of the 3D motion capture market over the next five years.


By System: Non-Optical Solutions Make Portability the Deciding Factor
Optical systems controlled 71.24% of sector turnover in 2025, reflecting unmatched sub-millimeter accuracy in controlled environments. Passive optical arrays remain the default for large-volume cinematic shoots, while active infrared rigs dominate clinical gait labs for their immunity to ambient light shifts. Yet non-optical technology is closing the precision gap and is forecast to advance at a 13.62% CAGR through 2031, signaling a shift in the 3D motion capture market toward portability-first buying criteria. Wearable inertial suits support untethered capture in stadiums and on factory floors; periodic recalibration corrects drift, bringing positional error within 2 millimeters during 10-minute segments. Electromagnetic platforms win in metallic industrial settings, where optical reflections or inertial interference undermine rivals.
Sensor-fusion algorithms accelerate parity. By pairing sparse optical markers to inertial data, hybrid rigs achieve near-studio accuracy outdoors, a feature attractive to sports broadcast crews craving rapid setup. The U.S. Food and Drug Administration guidance prioritizes repeatability over absolute accuracy, a concession that inertial vendors can meet at lower cost, enabling clinical adoption without optical budgets. As use-case diversity broadens, buyers weigh fidelity, mobility, and total cost of ownership rather than defaulting to camera count, giving non-optical platforms a tangible footing in the future 3D motion capture market.
By Capture Technology: Marker-Less Workflows Win in Uncontrolled Settings
Marker-based approaches delivered 66.78% of 2025 revenue, anchored by validated cinematic pipelines and clinical protocols that rely on explicitly labeled body points. Real-time playback and sub-degree joint-angle precision keep these systems entrenched in high-fidelity scenes. However, the marker-less cohort is set to grow at a 13.69% CAGR as camera resolution, paired with edge AI chips, extracts skeletal data directly from RGB streams. The frictionless experience, no suits, no adhesive dots, cuts setup time from 30 minutes to near zero, expanding the 3D motion capture market into retail, public venues, and live events where actors cannot be instrumented.
Accuracy deficits are narrowing. Proprietary multi-view solutions fuse 4K RGB feeds to achieve 5-millimeter error bands, a range that meets virtual-production previs and remote physiotherapy screening requirements. Consumer validation arrived when a mass-market headset embedded 90 Hz marker-less hand tracking, seeding mainstream developer familiarity. Limitations remain: variable outdoor lighting degrades model confidence, and high-speed athletes still outrun 1-millisecond shutter speeds, prompting studios to employ hybrid marker-less workflows for quick blocking and marker-based workflows for final takes. Market diversification around ease of use ensures that market-less adoption will accelerate wherever it is hard to guarantee controlled conditions.
By Application: Education Overtakes Entertainment for Growth Pace
Media and entertainment preserved a 52.49% revenue lead in 2025, affirming its legacy role in the 3D motion capture market. Yet universities are the fastest-growing buyers, with the education segment set to grow at a 14.29% CAGR through 2031. Declining hardware prices and cloud labs erode barriers to curricular integration. Animation schools license pre-captured libraries so students can focus on artistic nuance rather than raw data gathering, while biomechanics departments analyze gait to teach injury-mechanics theory.
The healthcare, engineering, and industrial segments build a steady baseline of demand. Hospitals deploy capture for orthopedic surgery planning and tele-rehabilitation, insulated from consumer cyclicality. Automakers validate new assembly cells against ISO postural codes and document risk mitigation for regulators. Military simulation and robotics programs consume petabyte-scale datasets to train AI agents, driving up long-term storage subscription costs. Diversified end uses cushion the 3D motion capture market against entertainment downturns and shape a resilient aggregate growth trajectory.
By Deployment Mode: Cloud Platforms Balance Scale and Sovereignty
On-premises nodes accounted for 69.74% of installations in 2025, as Hollywood studios and defense contractors kept raw data behind air gaps. Sub-20 millisecond latency for real-time LED stages also keeps final rendering local. Despite these factors, cloud adoption is forecast to grow at a 13.67% CAGR, driven by collaborative pipelines linking capture stages, animation houses, and remote directors. Subscription pricing converts capital costs into opex, appealing to episodic productions with lumpy cash flow.
Concerns about jurisdictional data laws and intellectual property leaks temper a full transition to the cloud. Hybrid architectures now dominate: raw acquisitions stay on site, while clean, retargeted files are archived in the cloud for worldwide editorial access. Vendors deploy edge zones in Los Angeles and Vancouver to shave round-trip delay, inching closer to the latency threshold of interactive work. Over time, workload phase segmentation, capture on-premises, and post-processing in the cloud should become standard, widening the total addressable revenue for managed-service providers in the 3D motion capture market.
Geography Analysis
North America generated 49.83% of 2025 revenue, led by dense clusters of film studios, biomechanics labs, and defense training centers. U.S. university research programs at Stanford, MIT, and others consistently renew multi-camera bays, while federal precision-medicine grants signal another funding wave. Canadian tax incentives pull large-budget features into Vancouver, sustaining high hardware refresh rates, and Mexico’s automotive plants apply motion capture to ergonomic compliance. Integration proficiency, robust IP law, and established reimbursement codes for tele-rehabilitation maintain regional spending momentum even as newer buyers in other geographies expand faster.
Asia-Pacific is projected to log a 14.33% CAGR through 2031, the highest regional pace in the 3D motion capture market. China’s broadcast regulator now mandates local capture in domestic animation, creating dozens of new facilities in Shanghai, Guangzhou, and Chengdu. Japan channels government subsidies into humanoid-robot research that relies on petabyte-scale motion libraries, and India’s gaming studios add capture volumes in Pune and Hyderabad to serve an audience growing at more than 20% annually. South Korea’s entertainment conglomerates integrate motion capture into K-pop music video workflows and real-time virtual idol concerts, leveraging nationwide 5G networks to stream full-body data.
Europe combines a steady demand for automotive, medical, and film products. Horizon Europe funding earmarks digital-health projects that include gait analysis, while German automakers follow ISO postural standards to reduce compensation claims. United Kingdom film tax relief keeps motion-capture soundstages booked year-round, justifying regular camera upgrades. Public Investment Fund capital is fostering a Middle East studio hub in Riyadh, diversifying regional economies away from oil. South America and Africa remain nascent, held back by tariffs and limited tech service networks, yet Brazil’s visual-effects scene and South Africa’s sports-science labs demonstrate early market footholds that could mature as import costs fall.

Competitive Landscape
The 3D motion capture market remains moderately fragmented. Top optical vendors such as Vicon and Qualisys defend their share by pairing cameras with proprietary software and multi-year service bundles, though open-source libraries erode differentiation. Inertial disruptors, including Xsens and Rokoko, offer complete kits at roughly one-tenth the optical outlay, letting indie studios and clinics jump in quickly. Patent filings for marker-less neural-pose algorithms climbed past 200 during 2025, with chipmakers like Qualcomm and Intel embedding inference engines inside sensor modules, blurring consumer and professional boundaries.
Studios press vendors for open interchange formats; IEEE Standard 2863 now standardizes skeletal data across platforms, undermining lock-in and sparking multi-vendor tenders. Service layers annotation, real-time QA, HIPAA-compliant data pipelines emerge as sticky differentiators. Vendors that invest in regulatory expertise secure FDA 510(k) clearances, opening reimbursement revenue streams competitors cannot yet match. Supply-chain swings for high-speed CMOS sensors and MEMS IMUs occasionally delay shipments, so integrators forge dual-source contracts and stock safety inventory, giving deep-pocket incumbents an advantage.
White-space innovation targets tele-rehabilitation and industrial wearables. Insole-mounted IMUs bypass camera rigs entirely for gait analysis in diabetic care, while drone-mounted depth cameras film athletes from overhead without obstructing movement. Ecosystem convergence around AI, cloud analytics, and ergonomic regulation is expected to drive strategic acquisitions as incumbents seek data-science talent and medical-device compliance expertise to augment their traditional hardware strengths.
3D Motion Capture Industry Leaders
Vicon Motion Systems Ltd.
NaturalPoint Inc.
Motion Analysis Corporation
Qualisys AB
Xsens Technologies B.V.
- *Disclaimer: Major Players sorted in no particular order

Recent Industry Developments
- January 2026: Vicon partnered with Amazon Web Services to launch a cloud-native processing stack that cuts skeletal-animation render time by 60% for distributed crews.
- December 2025: Xsens secured U.S. FDA 510(k) clearance for MVN Analyze Pro as a Class II medical device, paving the way for Medicare reimbursement on gait studies.
- November 2025: Sony allocated USD 120 million to expand its Culver City motion-capture complex with 64 Vicon Vantage V16 cameras, supporting virtual-production pipelines.
- October 2025: Qualisys rolled out a subscription service supplying eight-camera systems for USD 3,500 per month, targeting academic labs and indie content houses.


Global 3D Motion Capture Market Report Scope
The 3D Motion Capture Market Report is Segmented by Type (Hardware, Software, Services), System (Optical 3D MoCap Systems, and Non-optical 3D MoCap Systems), Capture Technology (Marker-based, and Marker-less), Application (Biomechanical Research and Medical, Media and Entertainment, Engineering and Industrial, Education, Other Applications), Deployment Mode (On-premise, and Cloud-based), and Geography (North America, South America, Europe, Asia-Pacific, Middle East and Africa). The Market Forecasts are Provided in Terms of Value (USD).
| Hardware | Cameras |
| Sensors | |
| Accessories | |
| Software | |
| Services |
| Optical 3D MoCap Systems | Active Optical |
| Passive Optical | |
| Non-optical 3D MoCap Systems | Inertial |
| Electromagnetic | |
| Motorized |
| Marker-based |
| Marker-less |
| Biomechanical Research and Medical |
| Media and Entertainment |
| Engineering and Industrial |
| Education |
| Other Applications |
| On-premise |
| Cloud-based |
| North America | United States | |
| Canada | ||
| Mexico | ||
| South America | Brazil | |
| Argentina | ||
| Rest of South America | ||
| Europe | United Kingdom | |
| Germany | ||
| France | ||
| Italy | ||
| Rest of Europe | ||
| Asia Pacific | China | |
| Japan | ||
| India | ||
| South Korea | ||
| Rest of Asia Pacific | ||
| Middle East and Africa | Middle East | United Arab Emirates |
| Saudi Arabia | ||
| Rest of Middle East | ||
| Africa | South Africa | |
| Egypt | ||
| Rest of Africa | ||
| By Type | Hardware | Cameras | |
| Sensors | |||
| Accessories | |||
| Software | |||
| Services | |||
| By System | Optical 3D MoCap Systems | Active Optical | |
| Passive Optical | |||
| Non-optical 3D MoCap Systems | Inertial | ||
| Electromagnetic | |||
| Motorized | |||
| By Capture Technology | Marker-based | ||
| Marker-less | |||
| By Application | Biomechanical Research and Medical | ||
| Media and Entertainment | |||
| Engineering and Industrial | |||
| Education | |||
| Other Applications | |||
| By Deployment Mode | On-premise | ||
| Cloud-based | |||
| By Geography | North America | United States | |
| Canada | |||
| Mexico | |||
| South America | Brazil | ||
| Argentina | |||
| Rest of South America | |||
| Europe | United Kingdom | ||
| Germany | |||
| France | |||
| Italy | |||
| Rest of Europe | |||
| Asia Pacific | China | ||
| Japan | |||
| India | |||
| South Korea | |||
| Rest of Asia Pacific | |||
| Middle East and Africa | Middle East | United Arab Emirates | |
| Saudi Arabia | |||
| Rest of Middle East | |||
| Africa | South Africa | ||
| Egypt | |||
| Rest of Africa | |||


Key Questions Answered in the Report
How large will the 3D motion capture market be by 2031?
The 3D motion capture market size is projected to reach USD 593.98 million by 2031, growing at a 13.23% CAGR from 2026.
Which region is expanding fastest in commercial adoption?
Asia-Pacific is expected to post the highest growth, advancing at a 14.33% CAGR thanks to animation build-outs, robotics funding, and gaming demand.
What is driving cloud adoption in motion capture workflows?
Subscription pricing, elastic compute, and the need for worldwide collaboration push studios toward cloud platforms, despite ongoing latency and data-sovereignty considerations.
Why are services outpacing hardware revenue growth?
Integration complexity and demand for turnkey support lead buyers to outsource calibration, processing, and analytics, lifting services at a 13.84% CAGR.
How is marker-less technology affecting traditional optical systems?
Computer-vision advances reduce setup time and enable capture in uncontrolled environments, spurring a 13.69% CAGR for marker-less solutions while prompting hybrid workflows for high-precision scenes.
What hurdles slow adoption in emerging markets?
High upfront equipment costs and import tariffs, combined with limited local service infrastructure, continue to restrain uptake in South America and Africa.
Page last updated on:


