Tamaño y Participación del Mercado de Colágeno de los Estados Unidos
Visión General del Mercado
| Período de Estudio | 2021 - 2031 |
|---|---|
| Período de Datos Pronosticados | 2026 - 2031 |
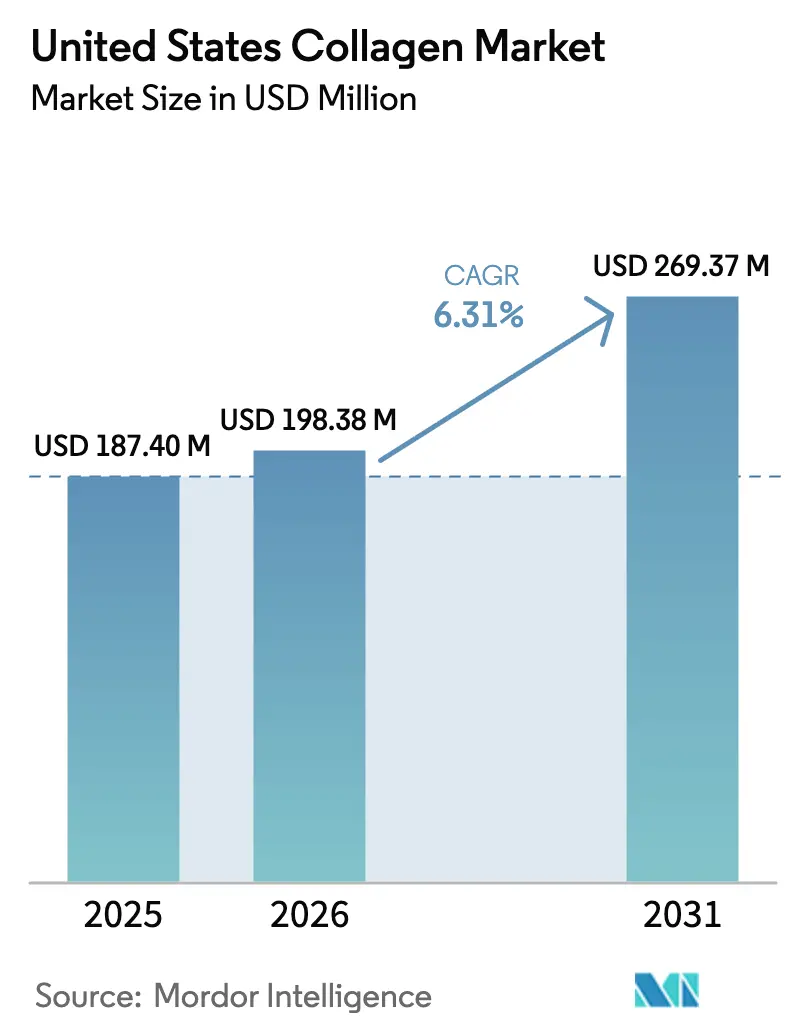
| Tamaño del mercado en el año base (2025) | 187.40 Millones de dólares |
| Tamaño del Mercado (2026) | 198.38 Millones de dólares |
| Tamaño del Mercado (2031) | 269.37 Millones de dólares |
| Tasa de crecimiento (2026 - 2031) | 6.31% CAGR |
| Concentración del Mercado | Medio |
Jugadores principales*Nota aclaratoria: los principales jugadores no se ordenaron de un modo en especial Imagen © Mordor Intelligence. El uso requiere atribución según CC BY 4.0. | |
Análisis del Mercado de Colágeno de los Estados Unidos por Mordor Intelligence
Se espera que el tamaño del mercado de colágeno de los Estados Unidos crezca de USD 187,40 millones en 2025 a USD 198,38 millones en 2026 y se prevé que alcance USD 269,37 millones en 2031 a una CAGR del 6,31% durante 2026-2031. Este crecimiento subraya una demanda constante de ingredientes proteicos que combinan eficazmente la funcionalidad con un enfoque en el bienestar. Tres factores clave impulsan esta expansión: regulaciones más claras sobre métodos de producción innovadores, una población envejecida que prioriza la salud articular y cutánea, y la incorporación fluida de péptidos de colágeno en alimentos, bebidas y rutinas de belleza cotidianas. Si bien los subproductos animales siguen siendo la principal materia prima, las alternativas marinas y basadas en fermentación están ganando terreno. Este cambio está impulsado por un enfoque en la sostenibilidad, la evitación de alérgenos y la adaptación a las preferencias dietéticas religiosas. El mercado se está bifurcando: los polvos a granel son populares para la personalización en el hogar, mientras que las opciones premium listas para beber atienden a los consumidores en movimiento, con precios más elevados. La consolidación entre los proveedores upstream está reduciendo el poder de negociación de las marcas más pequeñas. Sin embargo, los avances en nutricosméticos, bebidas funcionales y suplementos personalizados están ampliando la presencia minorista del colágeno en los Estados Unidos.
Conclusiones Clave del Informe
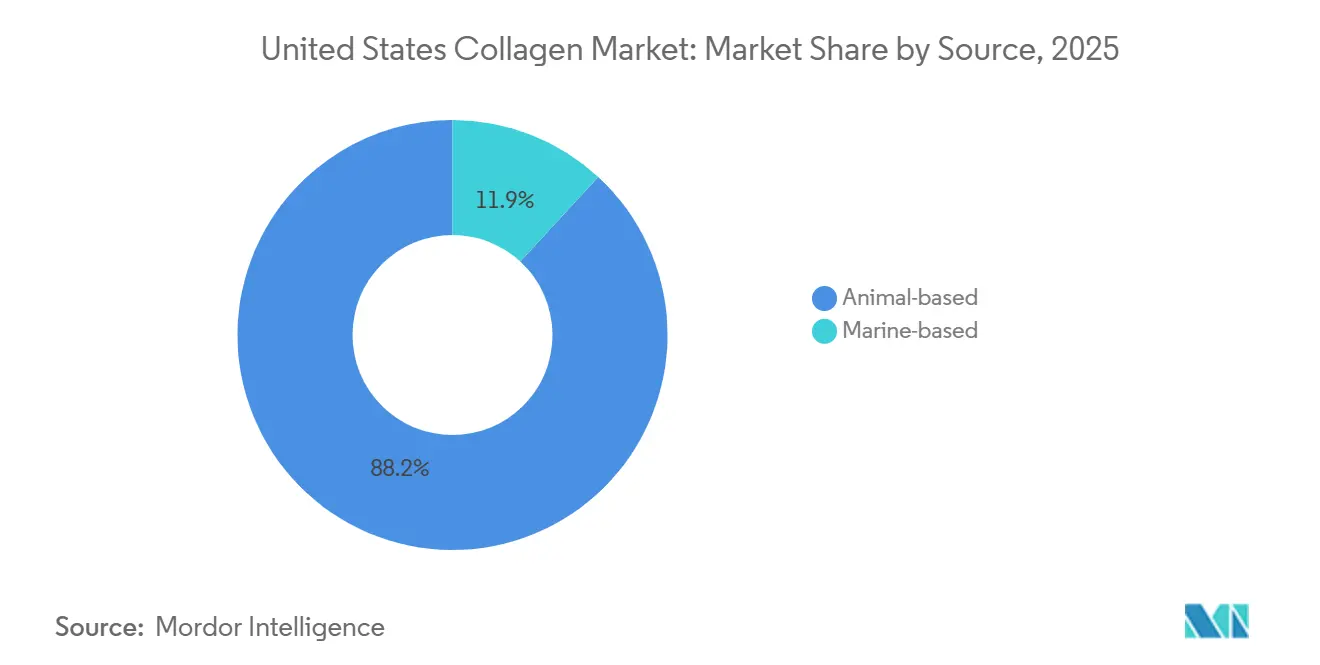
- Por fuente, el colágeno de base animal representó el 88,15% de la participación del mercado de colágeno de los Estados Unidos en 2025, mientras que se prevé que el colágeno marino crezca a una CAGR del 7,45% hasta 2031, la más rápida entre las fuentes.
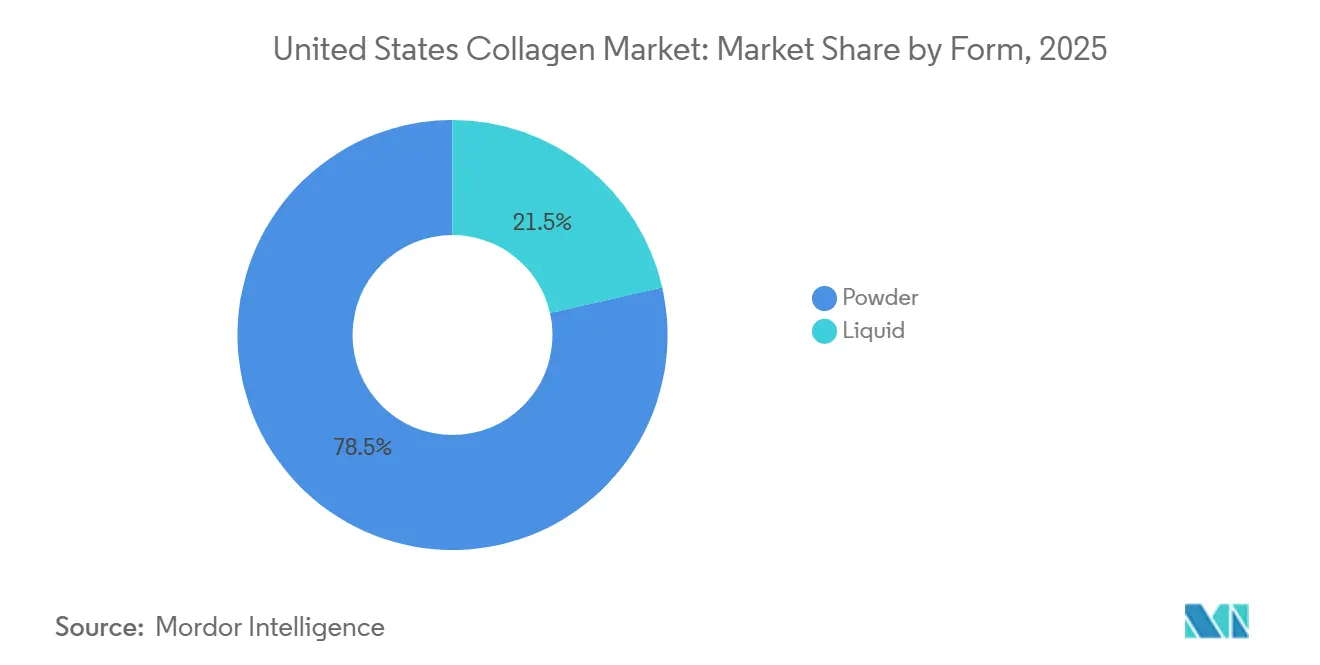
- Por forma, los formatos en polvo capturaron el 78,54% del tamaño del mercado de colágeno de los Estados Unidos en 2025, mientras que se proyecta que el colágeno líquido se expanda a una CAGR del 7,36% entre 2026 y 2031.
- Por aplicación, los alimentos y bebidas representaron el 55,27% de la participación del mercado de colágeno de los Estados Unidos en 2025, mientras que el cuidado personal y los cosméticos avanzan a una CAGR del 7,62%, la más rápida entre las aplicaciones.
Nota: Las cifras del tamaño del mercado y los pronósticos de este informe se generan utilizando el marco de estimación patentado de Mordor Intelligence, actualizado con los datos y conocimientos más recientes disponibles a partir de enero de 2026.
Tendencias e Información del Mercado de Colágeno de los Estados Unidos
Análisis del Impacto de los Impulsores*
| Impulsor | (~) % de Impacto en el Pronóstico de CAGR | Relevancia Geográfica | Horizonte Temporal del Impacto |
|---|---|---|---|
| Creciente demanda de suplementos dietéticos a base de colágeno | +1.2% | Nacional, concentrado en áreas metropolitanas costeras | Mediano plazo (2-4 años) |
| Adopción creciente en lanzamientos de alimentos y bebidas funcionales | +1.0% | Nacional, liderado por la Costa Oeste y el Noreste | Corto plazo (≤ 2 años) |
| Población envejecida que impulsa la adopción de nutricosméticos | +0.9% | Nacional, con mayor incidencia en los estados del Cinturón Solar | Largo plazo (≥ 4 años) |
| Preferencia por etiqueta limpia que favorece el colágeno de origen animal | +0.7% | Nacional, más fuerte en mercados orientados a productos orgánicos | Mediano plazo (2-4 años) |
| Creciente innovación en investigación y producción | +0.6% | Nacional, centros de I+D en California y Massachusetts | Mediano plazo (2-4 años) |
| Cambio hacia fuentes de colágeno marino sostenibles | +0.5% | Estados costeros, adopción temprana en el Noroeste del Pacífico | Largo plazo (≥ 4 años) |
| Fuente: Mordor Intelligence | |||


Creciente demanda de suplementos dietéticos a base de colágeno
Los péptidos de colágeno han pasado de ser un ingrediente de nicho en la nutrición deportiva a convertirse en un elemento esencial del bienestar convencional, ampliamente disponible a través de canales de venta de suplementos dietéticos de los Estados Unidos como Amazon, Costco y minoristas especializados. Con el aumento de la participación deportiva, el sector de nutrición deportiva y de rendimiento está experimentando un crecimiento significativo. En 2024, la Oficina de Estadísticas Laborales informó que el 21,5% de la población de los Estados Unidos participaba diariamente en actividades deportivas, de ejercicio y recreativas[1]Fuente: Oficina de Estadísticas Laborales, "Encuesta Americana sobre el Uso del Tiempo", bls.gov.. Los formuladores están abordando esta tendencia combinando colágeno con ácido hialurónico, vitamina C y biotina. Estos productos multibeneficios apuntan a la hidratación de la piel, la reparación del cartílago y la fortaleza del cabello en una sola porción, con un precio premium del 15% al 25% sobre los polvos de colágeno estándar. La vía de notificación de Nuevos Ingredientes Dietéticos de la FDA requiere que los fabricantes presenten datos de seguridad para fuentes de colágeno novedosas, como las variantes marinas y las bioingeniadas. Si bien esto ha estandarizado las expectativas de calidad, también ha aumentado los costos de cumplimiento, especialmente para las marcas más pequeñas. Aunque las compras de colágeno han sido tradicionalmente dominadas por mujeres de entre 35 y 54 años, existe una adopción creciente entre los consumidores masculinos. Los polvos proteicos con colágeno están ganando popularidad, especialmente en formulaciones de recuperación post-entrenamiento centradas en la reparación de tendones y ligamentos. Esta expansión demográfica destaca el potencial del mercado del colágeno más allá de su narrativa tradicional antiedad, abarcando el rendimiento atlético y el cuidado ortopédico preventivo.
Adopción creciente en lanzamientos de alimentos y bebidas funcionales
La fortificación proteica, que antes se limitaba a la nutrición deportiva, se ha convertido en una característica destacada en las categorías convencionales de alimentos y bebidas. El Consejo Internacional de Información Alimentaria informa que la proporción de estadounidenses que se centran en la ingesta de proteínas ha aumentado del 59% en 2022 al 71% en 2024[2]Fuente: Consejo Internacional de Información Alimentaria, "Encuesta IFIC de Alimentos y Salud 2024", ific.org.. Para diferenciarse en el competitivo mercado de bebidas proteicas, las marcas de bebidas funcionales en los Estados Unidos introdujeron productos con colágeno en 2024 y 2025. Estos productos, que incluyen café listo para beber, agua con gas, kombucha y kéfir, subrayan el cambio de la industria hacia la "nutrición invisible". Este enfoque aprovecha el sabor neutro y la solubilidad del colágeno, lo que permite a las marcas mejorar el contenido nutricional sin afectar el sabor ni requerir cambios en el comportamiento del consumidor. En 2024, Vital Proteins lanzó café frío con colágeno en cadenas minoristas, utilizando la red de distribución de Nestlé Health Science para asegurar una ubicación destacada en estantes de supermercados y tiendas de club. En 2025, Urban Remedy introdujo shots de bienestar con colágeno, comercializados como una alternativa premium y conveniente a los polvos de colágeno tradicionales, dirigidos a consumidores dispuestos a gastar entre USD 4 y USD 6 por una porción de 2 onzas. Destacando la adaptabilidad del colágeno, el Instituto de Tecnólogos de Alimentos señala sus propiedades de gelificación a bajas temperaturas. Esta característica facilita las innovaciones de textura en alternativas lácteas de base vegetal y postres bajos en azúcar, ampliando las aplicaciones del colágeno más allá de la fortificación proteica tradicional.
Población envejecida que impulsa la adopción de nutricosméticos
En 2024, se espera que el 18% de la población de los Estados Unidos tenga 65 años o más, según el Banco Mundial[3]Fuente: Banco Mundial, "Perspectivas de la Población Mundial", worldbank.org.. Esta tendencia demográfica está impulsando una mayor demanda de nutricosméticos, productos ingeribles comercializados para mejorar la apariencia de la piel, el cabello y las uñas desde adentro. Los péptidos de colágeno son un ingrediente clave en estas formulaciones, ampliamente promovidos por su capacidad para reducir los signos visibles del envejecimiento. El mercado de nutricosméticos también está ganando impulso debido a la influencia de la belleza coreana y la belleza japonesa. Las marcas coreanas y japonesas han introducido el concepto de "belleza desde adentro" a través de productos como bebidas y jaleas de colágeno, fomentando la conciencia del consumidor que las marcas estadounidenses están aprovechando ahora. El análisis de precios minoristas indica que los productos de colágeno ingeribles logran márgenes entre un 30% y un 50% más altos que los productos de cuidado de la piel tópicos. Esta rentabilidad está alentando a las marcas de belleza a expandirse hacia los suplementos dietéticos, fusionando aún más los límites entre los cosméticos y los alimentos funcionales. Este cambio es particularmente evidente entre las marcas de venta directa al consumidor, que utilizan modelos de suscripción y cuestionarios personalizados para ofrecer regímenes de colágeno adaptados que abordan las preocupaciones individuales de envejecimiento. Estos enfoques mejoran el valor de vida del cliente y reducen la dependencia de los canales de distribución minorista tradicionales.
Creciente innovación en investigación y producción
En octubre de 2024, Geltor recibió el aviso GRAS de la FDA GRN 1171 para su colágeno humano recombinante tipo I, creado mediante Escherichia coli genéticamente modificada. Este hito regulatorio valida el colágeno bioingeniado como una alternativa confiable a las fuentes tradicionales de origen animal. Al utilizar un proceso basado en fermentación, Geltor aborda las preocupaciones sobre la transmisión de enfermedades zoonóticas, cumple con las restricciones dietéticas religiosas y garantiza perfiles de aminoácidos consistentes entre lotes. Esto establece su colágeno bioingeniado como un ingrediente premium para productos farmacéuticos y dispositivos médicos, donde la pureza y la consistencia son fundamentales. Además, la extracción asistida por ultrasonido y el procesamiento con CO2 supercrítico están emergiendo como alternativas más sostenibles a la hidrólisis ácido-álcali convencional. Estos métodos reducen el uso de agua y los residuos químicos al tiempo que mejoran el rendimiento de péptidos, alineándose con las estrategias de adquisición centradas en la sostenibilidad de las empresas multinacionales de alimentos y bebidas.
Análisis del Impacto de las Restricciones*
| Restricción | (~) % de Impacto en el Pronóstico de CAGR | Relevancia Geográfica | Horizonte Temporal del Impacto |
|---|---|---|---|
| Auge de las alternativas proteicas veganas | -0.8% | Nacional, más fuerte en mercados costeros urbanos | Mediano plazo (2-4 años) |
| Cumplimiento regulatorio estricto y requisitos de certificación | -0.6% | Nacional, supervisión federal de la FDA | Corto plazo (≤ 2 años) |
| Preocupaciones éticas y alergénicas relacionadas con el colágeno de origen animal | -0.5% | Nacional, concentrado entre los consumidores de la Generación Z | Largo plazo (≥ 4 años) |
| Altos costos de abastecimiento y procesamiento de materias primas de colágeno de alta calidad | -0.7% | Nacional, amplificado por aranceles de importación | Mediano plazo (2-4 años) |
| Fuente: Mordor Intelligence | |||
Auge de las alternativas proteicas veganas
Los consumidores que priorizan la sostenibilidad ambiental, el bienestar animal o la evitación de alérgenos optan cada vez más por alternativas proteicas de base vegetal y bioingeniadas, que están reduciendo gradualmente la participación de mercado del colágeno de origen animal. Las marcas Vecollage y Vecollan de Evonik, desarrolladas mediante fermentación microbiana, proporcionan análogos de colágeno aptos para veganos. Estos análogos replican el perfil de aminoácidos del colágeno bovino sin depender del ganado, lo que los hace especialmente atractivos para los consumidores flexitarianos y veganos. A medida que el mercado se orienta hacia las proteínas de guisante, soja y arroz en la nutrición deportiva y los sustitutos de comidas, los proveedores de colágeno enfrentan una presión creciente para justificar sus precios premium. Este desafío se ve agravado por el hecho de que las proteínas vegetales son entre un 20% y un 40% más baratas por gramo y tienen cadenas de suministro más simples. Sin embargo, la composición única de aminoácidos del colágeno, rica en glicina, prolina e hidroxiprolina, sigue siendo incomparable con las proteínas vegetales. Este perfil distintivo sirve como ventaja funcional, que los proveedores de base animal están defendiendo mediante estudios de eficacia clínica y afirmaciones de biodisponibilidad. El canal de suplementos dietéticos está experimentando la presión competitiva más significativa, ya que los consumidores veganos representan un segmento creciente y vocal que las marcas no pueden permitirse ignorar.
Cumplimiento regulatorio estricto y requisitos de certificación
El lanzamiento de productos de colágeno se ha vuelto cada vez más costoso y complejo, especialmente para las empresas emergentes y las marcas regionales con experiencia regulatoria limitada. Esto se debe principalmente a la aplicación por parte de la FDA de los requisitos de notificación GRAS, las presentaciones de Nuevos Ingredientes Dietéticos y las regulaciones de Buenas Prácticas de Fabricación Actuales. Obtener la certificación de terceros de organizaciones como NSF International, USP o ConsumerLab cuesta entre USD 10.000 y USD 100.000 anuales por línea de producto. Estas certificaciones, que incluyen pruebas de metales pesados, contaminantes microbianos y verificación de declaraciones de etiqueta, son ahora esenciales para acceder a los canales minoristas premium y las plataformas de comercio electrónico. En 2024, la FDA emitió cartas de advertencia a los fabricantes de suplementos de colágeno por hacer afirmaciones de medicamentos no aprobadas sobre el dolor articular y la osteoartritis, enfatizando el enfoque de la agencia en distinguir los suplementos dietéticos de los productos farmacéuticos. En consecuencia, las marcas deben revisar su lenguaje de marketing e invertir en revisiones legales. Los desafíos de abastecimiento se intensifican aún más por las regulaciones de importación relacionadas con la encefalopatía espongiforme bovina. El Servicio de Inspección de Sanidad Animal y Vegetal del Departamento de Agricultura de los Estados Unidos aplica normas estrictas que prohíben la importación de ciertos materiales derivados de bovinos de países con historial de encefalopatía espongiforme bovina, lo que restringe la capacidad de los proveedores para obtener pieles asequibles de los mercados globales. Estas exigencias regulatorias afectan desproporcionadamente a los actores más pequeños, impulsando la consolidación a medida que las marcas buscan la escala y la experiencia necesarias para gestionar esta complejidad regulatoria.
*Nuestras previsiones consideran los impactos de impulsores y restricciones como direccionales, no aditivos. Las previsiones de impacto reflejan el crecimiento base, los efectos de mezcla y las interacciones entre variables.
Análisis de Segmentos
Por Fuente: Dominio Animal Anclado en la Economía de los Subproductos
En 2025, el colágeno de base animal mantuvo una participación de mercado dominante del 88,15%, lo que refleja el uso eficiente de subproductos por parte de la industria procesadora de carne de los Estados Unidos. Las pieles bovinas, las pieles porcinas y los huesos de aves de corral se convierten en valiosos péptidos de colágeno, reduciendo los residuos. El colágeno bovino, obtenido principalmente de pieles de ganado vacuno, se beneficia de cadenas de suministro bien establecidas vinculadas a la industria bovina de los Estados Unidos valorada en USD 70.000 millones. De manera similar, el colágeno porcino aprovecha los subproductos del procesamiento de cerdo, una práctica perfeccionada durante décadas por actores importantes como Smithfield Foods. Aunque el colágeno derivado de aves de corral representa una participación menor, está ganando popularidad entre los formuladores que buscan certificaciones halal y kosher, ya que las fuentes de pollo y pavo evitan las restricciones religiosas asociadas con los materiales bovinos y porcinos. Las regulaciones de encefalopatía espongiforme bovina de la FDA, que prohíben el uso de materiales de riesgo específicos como el tejido cerebral y de la médula espinal, han estandarizado los protocolos de seguridad en toda la cadena de suministro de base animal, aliviando las preocupaciones de los consumidores y los minoristas. Además, las tendencias de etiqueta limpia fortalecen la posición de mercado del colágeno de base animal. Las marcas premium con certificaciones de alimentación con pasto, crianza en pastizales y orgánicas pueden cobrar entre un 25% y un 40% más, abordando las preocupaciones de los consumidores sobre el uso de antibióticos y el bienestar animal.
El colágeno de base marina está creciendo a una tasa anual del 7,45% hasta 2031, impulsado por certificaciones de sostenibilidad y estrategias de evitación de alérgenos que lo distinguen de las fuentes terrestres. En 2024, Rousselot abordó una brecha clave del mercado al lanzar colágeno marino certificado por el Consejo de Administración Marina. Esto atrajo a los consumidores conscientes del medio ambiente y a los equipos de adquisiciones corporativas que buscan cada vez más verificación de terceros para el abastecimiento de pescado salvaje y la minimización de capturas incidentales. El perfil de aminoácidos del colágeno marino, aunque similar al del colágeno bovino, es percibido por algunos consumidores como más biodisponible debido a su menor peso molecular y mayor contenido de glicina. Las marcas aprovechan estas percepciones para posicionar el colágeno marino como un producto premium, a pesar de la evidencia clínica limitada que respalda una eficacia superior. El segmento también se beneficia de las tendencias dietéticas pescatarianas y flexitarianas, ya que los consumidores que evitan los productos de animales terrestres pero consumen mariscos ven el colágeno marino como una fuente de proteínas aceptable.

Por Forma: Versatilidad del Polvo Frente a la Comodidad del Líquido
En 2025, el colágeno en polvo representó el 78,54% de la participación de mercado, destacando su flexibilidad en formulaciones, vida útil prolongada y ventajas de costo en comparación con las alternativas líquidas. El colágeno en polvo se integra sin esfuerzo en batidos de proteínas, café, smoothies, productos horneados y platos salados como sopas y salsas. Esta adaptabilidad permite a los consumidores ajustar su dosis sin estar restringidos por los perfiles de sabor de los líquidos premezclados. Los péptidos de colágeno hidrolizado en forma de polvo son populares entre los co-fabricantes y las marcas de etiqueta privada debido a su sabor neutro y excelente solubilidad. Los fabricantes se benefician de menores gastos de transporte y almacenamiento con los polvos; la ausencia de contenido de agua reduce el peso y elimina la necesidad de refrigeración. Estos factores mejoran los márgenes de beneficio, especialmente en los canales de comercio electrónico y venta directa al consumidor. Además, el segmento de polvo está ganando terreno entre los operadores de servicios de alimentación. Las cafeterías y las cadenas de smoothies, por ejemplo, ofrecen refuerzos de colágeno por un extra de USD 1 a USD 2 por porción, generando ingresos adicionales sin necesidad de nuevo equipo ni capacitación del personal.
El colágeno líquido, mientras tanto, está creciendo a una tasa anual del 7,36% hasta 2031, impulsado por la demanda de los consumidores de conveniencia, la biodisponibilidad percibida y la creciente popularidad de las bebidas funcionales premium listas para beber. Empresas como Bloom Nutrition y Urban Remedy han lanzado shots de colágeno y bebidas de bienestar dirigidas a consumidores en movimiento que valoran la conveniencia sobre el costo, un grupo demográfico que tiende a ser más joven y más urbano que los compradores tradicionales de polvo. Aunque la evidencia clínica que distingue las tasas de absorción del colágeno líquido y en polvo sigue siendo limitada, el marketing de influencers y los testimonios en redes sociales han fortalecido la percepción de la absorción superior del colágeno líquido. Las marcas han capitalizado esta percepción introduciendo precios premium y sabores de edición limitada. Los avances en el procesamiento aséptico y la pasteurización de alta presión han extendido la vida útil de los productos de colágeno líquido sin necesidad de refrigeración, facilitando los desafíos de distribución y permitiendo la expansión minorista a nivel nacional. Sin embargo, el segmento enfrenta obstáculos de los consumidores conscientes del medio ambiente que ven las botellas de plástico de un solo uso y las latas de aluminio como insostenibles. En respuesta, las marcas están explorando envases recargables y formatos concentrados para reducir el desperdicio de materiales.
Por Aplicación: La Fortificación Alimentaria Lidera, la Belleza Acelera
En 2025, las aplicaciones de alimentos y bebidas representaron el 55,27% de la participación de mercado, impulsadas principalmente por el uso creciente del colágeno como ingrediente de fortificación proteica. Esta tendencia abarca una variedad de productos, incluidas barras de proteínas, yogur, cremas para café y productos horneados. El Instituto de Tecnólogos de Alimentos destaca las propiedades funcionales del colágeno, como la emulsificación, la retención de agua y la modificación de la textura, como impulsores críticos de la innovación. Estos avances responden a la demanda de los consumidores de productos ricos en nutrientes sin comprometer la calidad sensorial. El sabor neutro y la alta solubilidad del colágeno lo convierten en una opción ideal para las bebidas, lo que permite a los formuladores incorporar entre 5 y 15 gramos por porción sin afectar el sabor ni la sensación en boca. Esto proporciona una ventaja significativa sobre las proteínas vegetales, que a menudo introducen sabores terrosos o a legumbres. La industria de servicios de alimentación también está adoptando el colágeno, con cafeterías, bares de jugos y restaurantes de comida rápida casual que lo ofrecen como complemento opcional con un precio de entre USD 1 y USD 2. Esta estrategia no solo mejora sus ofertas, sino que también genera ingresos adicionales con una complejidad operativa mínima. Además, la claridad regulatoria que confirma el estatus GRAS del colágeno para los alimentos convencionales ha acelerado su adopción, eliminando las incertidumbres de cumplimiento que anteriormente restringían su uso a los suplementos dietéticos.
El cuidado personal y los cosméticos representan la aplicación de más rápido crecimiento, con una tasa de crecimiento anual del 7,62% proyectada hasta 2031. Este crecimiento refleja la integración de la belleza ingerible y el cuidado de la piel tópico, ya que los consumidores buscan cada vez más soluciones integrales para el antienvejecimiento y la salud de la piel. El lanzamiento en 2025 de Charlotte Tilbury de un suero con colágeno, combinado con suplementos de colágeno ingeribles, ejemplifica cómo las marcas de belleza premium están desarrollando líneas de productos interconectadas para fomentar el uso tanto del colágeno tópico como del oral. De manera similar, marcas como Drunk Elephant y Olay han introducido sueros y cremas potenciadoras de colágeno que combinan péptidos con retinol, niacinamida y ácido hialurónico, atrayendo a los consumidores que priorizan las formulaciones científicamente validadas. El segmento de belleza ingerible dentro del cuidado personal se está expandiendo rápidamente, con marcas como HUM Nutrition y mindbodygreen que ofrecen suplementos de colágeno diseñados para mejorar la hidratación de la piel, la elasticidad y reducir las arrugas. Estos productos a menudo se combinan con vitaminas C y E para mejorar la producción de colágeno. Aunque los suplementos dietéticos y los productos farmacéuticos tienen una participación menor del mercado, están experimentando un crecimiento constante. El colágeno se utiliza cada vez más en productos para la salud articular, soluciones de cicatrización de heridas y andamios de ingeniería tisular. Los dispositivos médicos aprobados por la FDA de Integra LifeSciences y Organogenesis destacan aún más las aplicaciones clínicas del colágeno, extendiendo su importancia más allá del bienestar del consumidor.
Análisis Geográfico
California, Nueva York, Florida y Texas dominan el consumo de colágeno en los Estados Unidos, representando colectivamente una participación significativa de la demanda nacional. Las áreas metropolitanas costeras favorecen el colágeno marino y los productos de etiqueta limpia, lo que refleja una mayor conciencia sobre la sostenibilidad y los hábitos dietéticos basados en mariscos. El corredor del Noreste, conocido por su densa red de comercio minorista especializado y su alto nivel de participación en medios digitales, fomenta el crecimiento de los nutricosméticos premium y las bebidas funcionales, a menudo impulsado por promociones de influencers.
A medida que los jubilados se trasladan a los estados del Cinturón Solar, las ventas de polvos para el cuidado articular están aumentando de manera constante, especialmente en tiendas de club y cadenas de farmacias. En el Medio Oeste y el Sur, los puntos de venta masivos y de club lideran el mercado, con marcas de etiqueta privada de precio accesible con un desempeño sólido. Por el contrario, los consumidores costeros se inclinan por las suscripciones de venta directa al consumidor y las tiendas especializadas en nutrición. Los requisitos de divulgación de metales pesados de la Proposición 65 de California están impulsando a las marcas a invertir en pruebas de terceros o reformular productos, creando costos de cumplimiento que a menudo favorecen a los proveedores más grandes.
El comercio electrónico continúa creciendo a nivel nacional, con Amazon representando un estimado del 25% al 30% de las ventas del mercado de colágeno de los Estados Unidos. Sin embargo, las plataformas de venta directa al consumidor como HUM Nutrition y The Collagen Co. están ganando terreno, generando entre el 40% y el 60% de sus ingresos a través de modelos de suscripción que garantizan un flujo de caja recurrente. Este entorno omnicanal está impulsando a las marcas a mejorar tanto su presencia en estantes como su visibilidad en algoritmos digitales, lo que lleva a mayores inversiones en marketing y análisis de datos avanzados en todo el mercado de colágeno de los Estados Unidos.
Panorama Competitivo
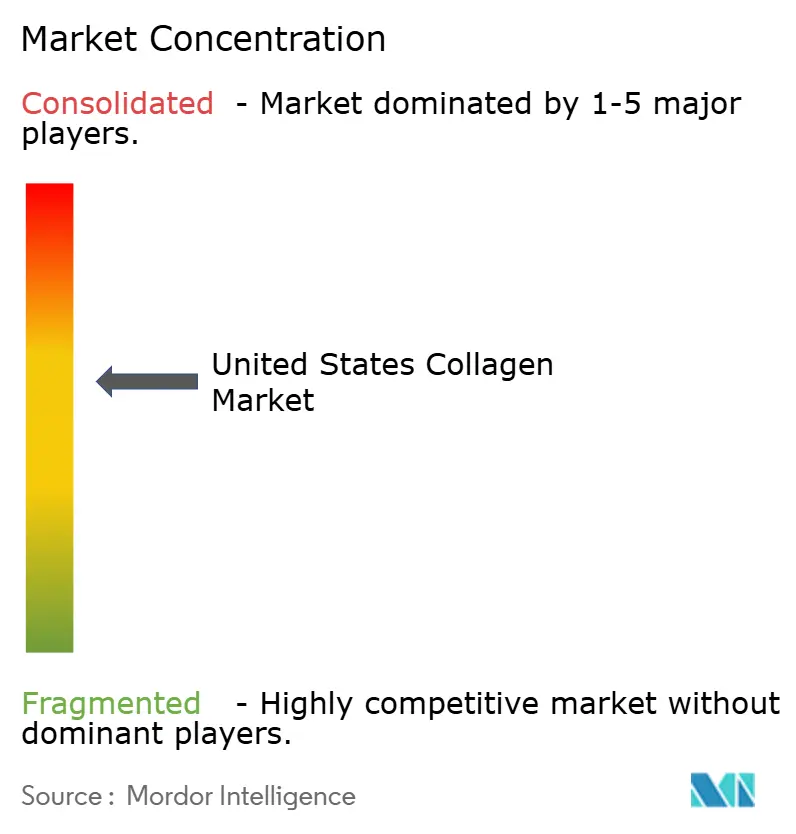
El mercado de colágeno de los Estados Unidos demuestra una consolidación moderada. Los cinco principales proveedores, como Darling Ingredients Inc., Gelita AG, Nitta Gelatin Inc., Tessenderlo Group y Nagase and Co. Ltd, controlan una porción significativa del suministro de ingredientes. Sin embargo, el segmento de productos de marca downstream sigue siendo muy fragmentado, abarcando cientos de empresas en suplementos dietéticos, alimentos y cosméticos. En diciembre de 2025, Darling Ingredients anunció un acuerdo de fusión para combinar su división Rousselot con el negocio de gelatina y colágeno de Tessenderlo Group. Se espera que esta fusión genere USD 1.500 millones en ingresos combinados, lo que permitirá a la nueva entidad ejercer una influencia considerable sobre los precios, la innovación y los estándares de sostenibilidad en América del Norte y Europa. Esta consolidación destaca una tendencia de la industria en la que los actores más grandes capitalizan las ventajas de escala en la adquisición de materias primas, la tecnología de hidrólisis enzimática y el cumplimiento regulatorio, creando barreras significativas para los proveedores más pequeños.
En el mercado de colágeno de los Estados Unidos, las empresas están muy enfocadas en la innovación de productos y la expansión estratégica para mantener sus posiciones competitivas. Los actores líderes están invirtiendo en investigación y desarrollo para desarrollar formulaciones de colágeno innovadoras para aplicaciones específicas, particularmente en los sectores de alimentos y bebidas y cuidado personal. Muchas empresas están actualizando sus capacidades de fabricación mediante expansiones de instalaciones y avances tecnológicos, al tiempo que amplían sus redes de distribución. Las colaboraciones estratégicas con proveedores de ingredientes y fabricantes de productos finales son cada vez más frecuentes para asegurar cadenas de suministro estables y acceso al mercado. En respuesta a la creciente conciencia de los consumidores sobre las preocupaciones ambientales, muchos actores están enfatizando la sostenibilidad en sus procesos de abastecimiento y producción. La industria también está viendo un mayor inversión en variantes de colágeno especializadas, como el colágeno de base marina para cosméticos premium y el colágeno bovino para aplicaciones alimentarias.
Los actores emergentes están disrumpiendo el mercado al utilizar colágeno bioingeniado y modelos de venta directa al consumidor para desafiar a los proveedores establecidos. La recepción por parte de Geltor del aviso GRAS de la FDA GRN 1171 en octubre de 2024 para su colágeno humano recombinante tipo I, producido mediante Escherichia coli genéticamente modificada, valida la producción basada en fermentación como una alternativa viable a las fuentes de origen animal. Este enfoque elimina las preocupaciones relacionadas con las enfermedades zoonóticas, las restricciones dietéticas religiosas y la variabilidad entre lotes. Con esta aprobación regulatoria, Geltor está bien posicionado para ingresar a los mercados farmacéuticos y de dispositivos médicos, donde la pureza y la consistencia exigen precios premium, lo que podría reducir el dominio de los proveedores de base animal en los segmentos de alto margen. También existen oportunidades en la nutrición personalizada, donde las marcas pueden aprovechar las pruebas genéticas, el análisis del microbioma o los diagnósticos de salud cutánea para ofrecer regímenes de colágeno personalizados, fomentando la lealtad del cliente y creando una ventaja competitiva a través de la diferenciación basada en datos.
Líderes de la Industria del Colágeno de los Estados Unidos
Darling Ingredients Inc.
Gelita AG
Nitta Gelatin Inc.
Tessenderlo Group
Nagase and Co. Ltd
- *Nota aclaratoria: los principales jugadores no se ordenaron de un modo en especial

Desarrollos Recientes de la Industria
- Diciembre de 2025: Darling Ingredients y Tessenderlo Group han fusionado sus negocios de gelatina y colágeno, creando una nueva entidad con USD 1.500 millones en ingresos y una capacidad de producción anual de 200.000 toneladas métricas. Con una división de propiedad del 85/15 a favor de Darling, la fusión consolida las cadenas de suministro de colágeno de América del Norte y Europa. Esta asociación estratégica permite a la empresa combinada liderar las decisiones de precios y los plazos de innovación en las industrias farmacéutica, alimentaria y cosmética.
- Octubre de 2024: NutriScience Innovations, LLC, con sede en América del Norte, ha adquirido XSTO Solutions, LLC. ("XSTO"). XSTO es reconocida como un proveedor de valor agregado especializado en ingredientes nutracéuticos y funcionales.


Alcance del Informe del Mercado de Colágeno de los Estados Unidos
El colágeno es la principal proteína estructural en la matriz extracelular de los tejidos conectivos de muchos animales. El mercado de colágeno de los Estados Unidos está segmentado por fuente, forma y aplicación. Por fuente, el mercado está segmentado en base animal y base marina. Por forma, el mercado está segmentado en polvo y líquido. Por aplicación, el mercado está segmentado en alimentos y bebidas, suplementos dietéticos, cuidado personal y cosméticos, productos farmacéuticos y nutrición animal. Las previsiones del mercado se proporcionan en términos de valor (USD) y volumen (toneladas).
| Base animal |
| Base marina |
| Polvo |
| Líquido |
| Alimentos y Bebidas |
| Suplementos Dietéticos |
| Cuidado Personal y Cosméticos |
| Productos Farmacéuticos |
| Nutrición Animal |
| Por Fuente | Base animal |
| Base marina | |
| Por Forma | Polvo |
| Líquido | |
| Por Aplicación | Alimentos y Bebidas |
| Suplementos Dietéticos | |
| Cuidado Personal y Cosméticos | |
| Productos Farmacéuticos | |
| Nutrición Animal |


Definición de mercado
- Usuario Final - El Mercado de Ingredientes Proteicos opera sobre una base B2B. Los fabricantes de Alimentos, Bebidas, Suplementos, Alimentación Animal y Cuidado Personal y Cosméticos se consideran usuarios finales en el mercado estudiado. El alcance excluye a los fabricantes que compran suero líquido/seco para su uso como agente aglutinante o espesante u otras aplicaciones no proteicas.
- Tasa de Penetración - La Tasa de Penetración se define como el porcentaje del Volumen del Mercado de Usuarios Finales Fortificados con Proteínas en el Volumen Total del Mercado de Usuarios Finales.
- Contenido Proteico Promedio - El contenido proteico promedio es el contenido proteico medio presente por cada 100 g de producto fabricado por todas las empresas de usuarios finales consideradas en el alcance de este informe.
- Volumen del Mercado de Usuarios Finales - El volumen del mercado de usuarios finales es el volumen consolidado de todos los tipos y formas de productos de usuarios finales en el país o región.
| Palabra clave | Definición |
|---|---|
| Alfa-lactoalbúmina (α-Lactoalbúmina) | Es una proteína que regula la producción de lactosa en la leche de casi todas las especies de mamíferos. |
| Aminoácido | Es un compuesto orgánico que contiene grupos funcionales tanto amino como ácido carboxílico, necesarios para la síntesis de proteínas corporales y otros compuestos importantes que contienen nitrógeno, como la creatina, las hormonas peptídicas y algunos neurotransmisores. |
| Escaldado | Es el proceso de calentar brevemente las verduras con vapor o agua hirviendo. |
| BRC | Consorcio Minorista Británico |
| Mejorador de pan | Es una mezcla a base de harina de varios componentes con propiedades funcionales específicas diseñadas para modificar las características de la masa y otorgar atributos de calidad al pan. |
| BSF | Mosca Soldado Negra |
| Caseinato | Es una sustancia producida al añadir un álcali a la caseína ácida, un derivado de la caseína. |
| Enfermedad celíaca | La enfermedad celíaca es una reacción inmunitaria a la ingesta de gluten, una proteína que se encuentra en el trigo, la cebada y el centeno. |
| Calostro | Es un fluido lácteo que liberan los mamíferos que han dado a luz recientemente, antes de que comience la producción de leche materna. |
| Concentrado | Es la forma menos procesada de proteína y tiene un contenido proteico que oscila entre el 40% y el 90% en peso. |
| Base de proteína seca | Se refiere al porcentaje de "proteína pura" presente en un suplemento después de que el agua que contiene se elimina completamente mediante calor. |
| Suero seco | Es el producto resultante del secado del suero fresco que ha sido pasteurizado y al que no se ha añadido ningún conservante. |
| Proteína de huevo | Es una mezcla de proteínas individuales, que incluye ovoalbúmina, ovomucoide, ovoglobulina, conalbúmina, vitelina y vitelenina. |
| Emulsionante | Es un aditivo alimentario que facilita la mezcla de alimentos que son inmiscibles entre sí, como el aceite y el agua. |
| Enriquecimiento | Es el proceso de adición de micronutrientes que se pierden durante el procesamiento del producto. |
| ERS | Servicio de Investigación Económica del Departamento de Agricultura de los Estados Unidos |
| Extrusión | Es el proceso de forzar ingredientes mezclados blandos a través de una abertura en una placa perforada o troquel diseñado para producir la forma requerida. El alimento extruido se corta luego a un tamaño específico mediante cuchillas. |
| Haba | También conocida como faba, es otro nombre para los frijoles amarillos partidos. |
| FDA | Administración de Alimentos y Medicamentos |
| Laminado | Es un proceso en el que típicamente un grano de cereal (como maíz, trigo o arroz) se descompone en sémola, se cocina con sabores y jarabes, y luego se prensa en copos entre rodillos enfriados. |
| Agente espumante | Es un ingrediente alimentario que hace posible formar o mantener una dispersión uniforme de una fase gaseosa en un alimento líquido o sólido. |
| Servicios de alimentación | Se refiere a la parte de la industria alimentaria que incluye empresas, instituciones y compañías que preparan comidas fuera del hogar. Incluye restaurantes, cafeterías escolares y hospitalarias, operaciones de catering y muchos otros formatos. |
| Fortificación | Es la adición deliberada de micronutrientes que no se encuentran en ellos de forma natural o que se pierden durante el procesamiento, para mejorar el valor nutricional de un producto alimentario. |
| FSANZ | Normas Alimentarias de Australia y Nueva Zelanda |
| FSIS | Servicio de Inspección y Seguridad Alimentaria |
| FSSAI | Autoridad de Seguridad y Normas Alimentarias de la India |
| Agente gelificante | Es un ingrediente que funciona como estabilizador y espesante para proporcionar espesor sin rigidez mediante la formación de gel. |
| GHG | Gas de Efecto Invernadero |
| Gluten | Es una familia de proteínas que se encuentran en los cereales, incluidos el trigo, el centeno, la espelta y la cebada. |
| Cáñamo | Es una clase botánica de cultivares de Cannabis sativa cultivados específicamente para uso industrial o medicinal. |
| Hidrolizado | Es una forma de proteína fabricada exponiendo la proteína a enzimas que pueden romper parcialmente los enlaces entre los aminoácidos de la proteína y descomponer proteínas grandes y complejas en piezas más pequeñas. Su procesamiento facilita y acelera su digestión. |
| Hipoalergénico | Se refiere a una sustancia que causa menos reacciones alérgicas. |
| Aislado | Es la forma más pura y procesada de proteína que ha sido sometida a separación para obtener una fracción proteica pura. Típicamente contiene ≥ 90% de proteína en peso. |
| Queratina | Es una proteína que ayuda a formar el cabello, las uñas y la capa exterior de la piel. |
| Lactoalbúmina | Es la albúmina contenida en la leche y obtenida del suero. |
| Lactoferrina | Es una glicoproteína de unión al hierro que está presente en la leche de la mayoría de los mamíferos. |
| Lupino | Son las semillas de leguminosas amarillas del género Lupinus. |
| Millennial | También conocido como Generación Y o Gen Y, se refiere a las personas nacidas entre 1981 y 1996. |
| Monogástrico | Se refiere a un animal con un estómago de un solo compartimento. Ejemplos de monogástricos incluyen humanos, aves de corral, cerdos, caballos, conejos, perros y gatos. La mayoría de los monogástricos generalmente son incapaces de digerir gran parte de los materiales alimenticios con celulosa, como los pastos. |
| MPC | Concentrado de proteína de leche |
| MPI | Aislado de proteína de leche |
| MSPI | Aislado de proteína de soja metilada |
| Micoproteína | La micoproteína es una forma de proteína unicelular, también conocida como proteína fúngica, derivada de hongos para el consumo humano. |
| Nutricosméticos | Es una categoría de productos e ingredientes que actúan como suplementos nutricionales para el cuidado de la belleza natural de la piel, las uñas y el cabello. |
| Osteoporosis | Es una condición médica en la que los huesos se vuelven frágiles y quebradizos por la pérdida de tejido, típicamente como resultado de cambios hormonales o deficiencia de calcio o vitamina D. |
| PDCAAS | La puntuación de aminoácidos corregida por digestibilidad proteica (PDCAAS) es un método para evaluar la calidad de una proteína basado tanto en los requisitos de aminoácidos de los humanos como en su capacidad para digerirla. |
| Consumo per cápita de proteína animal | Es la cantidad promedio de proteína animal (como leche, suero, gelatina, colágeno y proteínas de huevo) que está disponible para el consumo de cada persona en una población real. |
| Consumo per cápita de proteína vegetal | Es la cantidad promedio de proteína vegetal (como proteínas de soja, trigo, guisante, avena y cáñamo) que está disponible para el consumo de cada persona en una población real. |
| Quorn | Es una proteína microbiana fabricada utilizando micoproteína como ingrediente, en la que el cultivo de hongos se seca y se mezcla con albúmina de huevo o proteína de papa, que actúa como aglutinante, y luego se ajusta en textura y se prensa en diversas formas. |
| Listo para Cocinar | Se refiere a productos alimenticios que incluyen todos los ingredientes, donde se requiere alguna preparación o cocción a través de un proceso indicado en el envase. |
| Listo para Comer | Se refiere a un producto alimenticio preparado o cocinado con anticipación, sin necesidad de cocción o preparación adicional antes de ser consumido. |
| RTD | Listo para Beber |
| RTS | Listo para Servir |
| Grasa saturada | Es un tipo de grasa en la que las cadenas de ácidos grasos tienen todos enlaces simples. Generalmente se considera poco saludable. |
| Salchicha | Es un producto cárnico elaborado con carne finamente picada y condimentada, que puede ser fresca, ahumada o en escabeche y que generalmente se rellena en una tripa. |
| Seitán | Es un sustituto cárnico de base vegetal elaborado con gluten de trigo. |
| Cápsula blanda de gelatina | Es una cápsula a base de gelatina con relleno líquido. |
| SPC | Concentrado de proteína de soja |
| SPI | Aislado de proteína de soja |
| Espirulina | Es una biomasa de cianobacterias que puede ser consumida por humanos y animales. |
| Estabilizador | Es un ingrediente añadido a los productos alimenticios para ayudar a mantener o mejorar su textura original y sus características físicas y químicas. |
| Suplementación | Es el consumo o provisión de fuentes concentradas de nutrientes u otras sustancias destinadas a complementar los nutrientes de la dieta y corregir las deficiencias nutricionales. |
| Texturizante | Es un tipo específico de ingrediente alimentario que se utiliza para controlar y alterar la sensación en boca y la textura de los productos alimenticios y bebidas. |
| Espesante | Es un ingrediente que se utiliza para aumentar la viscosidad de un líquido o masa y hacerlo más espeso, sin cambiar sustancialmente sus otras propiedades. |
| Grasa trans | También llamados ácidos grasos trans insaturados o ácidos grasos trans, es un tipo de grasa insaturada que se produce naturalmente en pequeñas cantidades en la carne. |
| TSP | Proteína de soja texturizada |
| TVP | Proteína vegetal texturizada |
| WPC | Concentrado de proteína de suero |
| WPI | Aislado de proteína de suero |


Metodología de Investigación
Mordor Intelligence sigue una metodología de cuatro pasos en todos nuestros informes.
- Paso 1: Identificar las Variables Clave: Las variables clave cuantificables (industriales y externas) relacionadas con el segmento de producto específico y el país se seleccionan de un grupo de variables y factores relevantes basados en investigación documental y revisión bibliográfica, junto con aportaciones de expertos primarios. Estas variables se confirman posteriormente mediante modelos de regresión (cuando sea necesario).
- Paso 2: Construir un Modelo de Mercado: Con el fin de desarrollar una metodología de pronóstico sólida, las variables y factores identificados en el Paso 1 se contrastan con los datos históricos disponibles del mercado. Mediante un proceso iterativo, se establecen las variables necesarias para el pronóstico del mercado y el modelo se construye sobre la base de estas variables.
- Paso 3: Validar y Finalizar: En este importante paso, todos los datos del mercado, las variables y las conclusiones de los analistas se validan a través de una extensa red de expertos en investigación primaria del mercado estudiado. Los encuestados se seleccionan en todos los niveles y funciones para generar una imagen holística del mercado estudiado.
- Paso 4: Resultados de la Investigación: Informes Sindicados, Asignaciones de Consultoría Personalizada, Bases de Datos y Plataformas de Suscripción


