Tamaño y Participación del Mercado de Gelatina de los Estados Unidos
Visión General del Mercado
| Período de Estudio | 2021 - 2031 |
|---|---|
| Período de Datos Pronosticados | 2026 - 2031 |
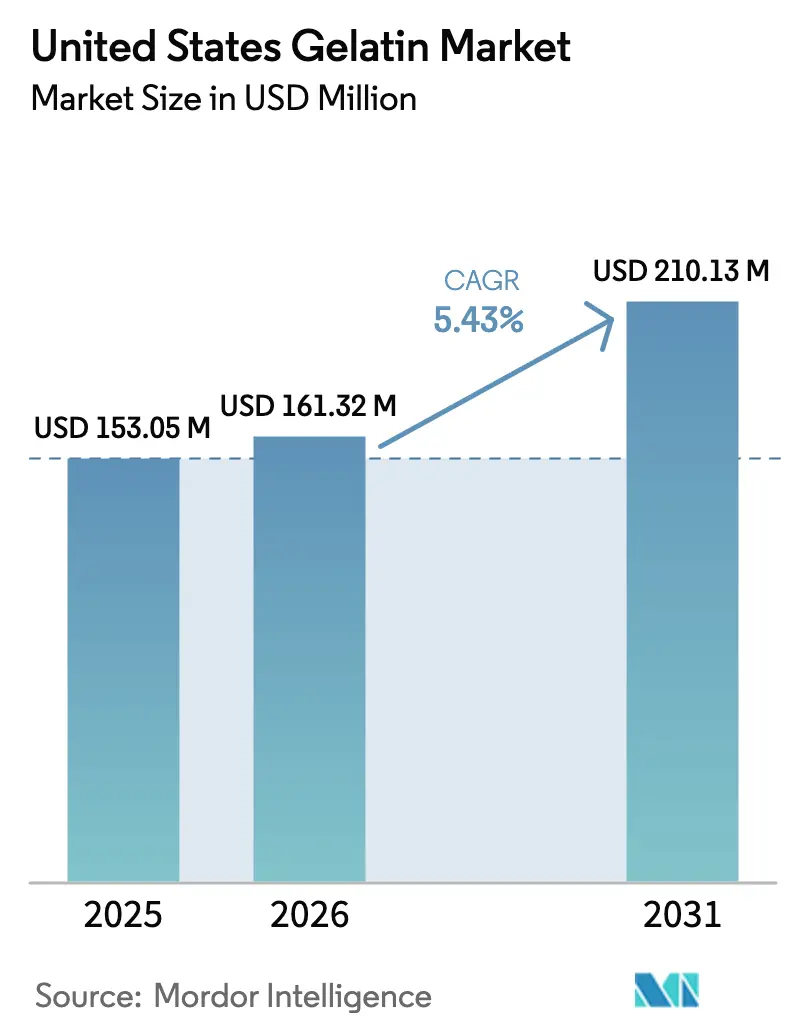
| Tamaño del mercado en el año base (2025) | 153.05 Millones de dólares |
| Tamaño del Mercado (2026) | 161.32 Millones de dólares |
| Tamaño del Mercado (2031) | 210.13 Millones de dólares |
| Tasa de crecimiento (2026 - 2031) | 5.43% CAGR |
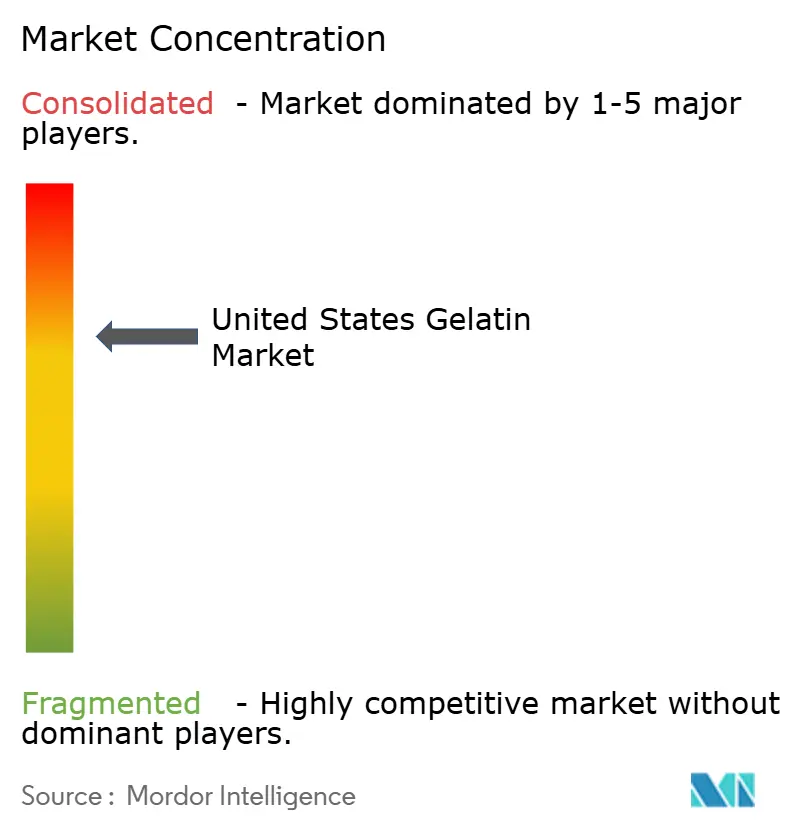
| Concentración del Mercado | Medio |
Jugadores principales *Nota aclaratoria: los principales jugadores no se ordenaron de un modo en especial Imagen © Mordor Intelligence. El uso requiere atribución según CC BY 4.0. | |
Análisis del Mercado de Gelatina de los Estados Unidos por Mordor Intelligence
Se espera que el tamaño del mercado de gelatina de los Estados Unidos crezca de USD 153,05 millones en 2025 a USD 161,32 millones en 2026 y se prevé que alcance USD 210,13 millones en 2031 a una CAGR del 5,43% durante 2026-2031. La creciente demanda de alimentos funcionales, ingredientes nutracéuticos y de etiqueta limpia continúa siendo el ancla del mercado de gelatina de los Estados Unidos, mientras que las aplicaciones premium de cuidado personal y farmacéuticas desbloquean márgenes más elevados. Los grados de origen animal aún dominan debido a las cadenas de suministro consolidadas y la superior resistencia del gel, aunque las alternativas marinas están creciendo a medida que los consumidores halal, kosher y pescatarianos buscan fuentes certificadas. Las inversiones en capacidad y la actividad de empresas conjuntas están reconfigurando el panorama competitivo, y las mejoras tecnológicas en la hidrólisis enzimática están acortando los ciclos de procesamiento y aumentando los rendimientos. Al mismo tiempo, la volatilidad de las materias primas, los aranceles y los gastos de cumplimiento normativo presionan la rentabilidad y aceleran la búsqueda de materias primas diversificadas.
Conclusiones Clave del Informe
- Por forma, la gelatina de origen animal representó el 94,21% de la participación del mercado de gelatina de los Estados Unidos en 2025, mientras que se prevé que los grados de origen marino se expandan a una CAGR del 7,23% hasta 2031.
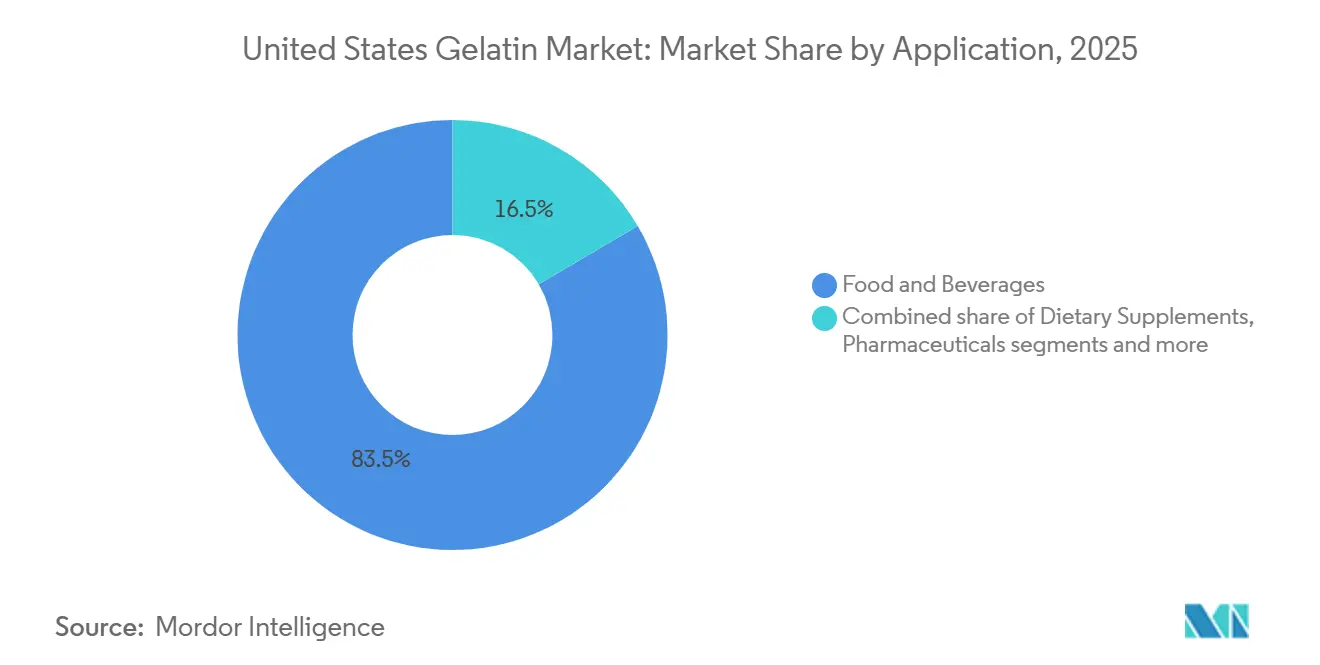
- Por aplicación, los alimentos y bebidas representaron el 83,46% de los ingresos en 2025, mientras que el cuidado personal y los cosméticos avanzan a una CAGR del 6,79% hasta 2031.
Nota: Las cifras del tamaño del mercado y los pronósticos de este informe se generan utilizando el marco de estimación patentado de Mordor Intelligence, actualizado con los datos y conocimientos más recientes disponibles a partir de enero de 2026.
Tendencias e Información del Mercado de Gelatina de los Estados Unidos
Análisis del Impacto de los Impulsores*
| Impulsor | (~) % de Impacto en el Pronóstico de CAGR | Relevancia Geográfica | Horizonte Temporal del Impacto |
|---|---|---|---|
| Creciente demanda de productos funcionales y nutracéuticos | +1.2% | Estados Unidos (nacional, con concentración en mercados urbanos con conciencia sanitaria) | Mediano plazo (2-4 años) |
| Creciente preferencia del consumidor por ingredientes naturales y de etiqueta limpia | +1.0% | Estados Unidos (nacional, más fuerte en áreas costeras y metropolitanas) | Corto plazo (≤ 2 años) |
| Expansión de productos cosméticos y de cuidado personal que utilizan gelatina | +0.8% | Estados Unidos (nacional, liderado por segmentos de belleza premium) | Mediano plazo (2-4 años) |
| Avances tecnológicos en extracción y procesamiento | +0.6% | Estados Unidos (centros de manufactura en el Medio Oeste, California) | Largo plazo (≥ 4 años) |
| Beneficios funcionales en alimentos y bebidas | +0.9% | Estados Unidos (nacional, impulsado por aplicaciones de confitería y lácteos) | Corto plazo (≤ 2 años) |
| Creciente inversión en capacidad de producción e innovación de gelatina | +0.7% | Estados Unidos (corredores de producción del Medio Oeste, instalaciones costeras de gelatina marina) | Mediano plazo (2-4 años) |
| Fuente: Mordor Intelligence | |||


Creciente demanda de productos funcionales y nutracéuticos
La creciente demanda de productos funcionales y nutracéuticos es un impulsor clave del mercado de gelatina de los Estados Unidos, respaldada por el creciente enfoque del consumidor en la salud, el bienestar y la nutrición preventiva. La gelatina se utiliza ampliamente en suplementos dietéticos, alimentos funcionales y cápsulas farmacéuticas debido a su alto contenido proteico, digestibilidad y propiedades funcionales. Esta tendencia se ve reforzada por la Encuesta Spotlight de Percepciones de Proteínas del IFIC de 2025, que encontró que 8 de cada 10 estadounidenses priorizan la ingesta de proteínas durante al menos una ocasión de alimentación diaria, lo que señala una fuerte demanda de ingredientes ricos en proteínas[1]Fuente: Consejo Internacional de Información Alimentaria, "Percepción de los Estadounidenses sobre las Proteínas", ific.org. A medida que los consumidores buscan cada vez más productos que apoyen la salud articular, la salud de la piel, el mantenimiento muscular y la saciedad, la gelatina continúa ganando terreno como ingrediente nutracéutico preferido. Además, el uso creciente de gelatina en gomitas, cápsulas blandas y alimentos enriquecidos está acelerando la demanda en los segmentos nutracéuticos tanto de alimentos como farmacéuticos.
Creciente preferencia del consumidor por ingredientes naturales y de etiqueta limpia
La reformulación de etiqueta limpia se está acelerando, con marcas de alimentos y nutracéuticos que reemplazan estabilizadores y emulsionantes sintéticos por gelatina, percibida como una solución natural de un solo ingrediente. El posicionamiento regulatorio de la gelatina refuerza aún más su adopción, ya que la Administración de Alimentos y Medicamentos (FDA) la reconoce como Generalmente Reconocida como Segura (GRAS) bajo 21 CFR 184.1550, proporcionando a los fabricantes claridad regulatoria[2]Fuente: Administración de Alimentos y Medicamentos de los Estados Unidos, "Sustancias Añadidas a los Alimentos", hfpappexternal.fda.gov. Su contenido proteico inherente y su exclusión de las principales listas de alérgenos también respaldan la nutrición en el frente del envase y las declaraciones "libre de". Este cambio se ve reforzado por datos de comportamiento del consumidor, ya que la Encuesta de Alimentos y Salud del IFIC de 2024 indica que el 36% de los consumidores estadounidenses priorizan los alimentos etiquetados como "Natural", "Orgánico" o "Saludable" durante las compras en tienda[3]Fuente: Consejo Internacional de Información Alimentaria, "Encuesta de Alimentos y Salud del IFIC 2024", ific.org. En conjunto, estos factores posicionan a la gelatina como un ingrediente preferido para alimentos de etiqueta limpia, bebidas, suplementos y productos funcionales.
Expansión de productos cosméticos y de cuidado personal que utilizan gelatina
La expansión de productos cosméticos y de cuidado personal que utilizan gelatina es un impulsor importante del mercado de gelatina de los Estados Unidos, respaldada por la creciente demanda de ingredientes de belleza naturales y funcionales. La gelatina se utiliza ampliamente en formulaciones de cuidado de la piel, el cabello y las uñas debido a sus propiedades formadoras de película, retención de humedad y contenido proteico que apoya la elasticidad de la piel y la fortaleza del cabello. Su compatibilidad con el posicionamiento de productos de etiqueta limpia y de origen natural se alinea bien con la creciente preferencia del consumidor por formulaciones de belleza transparentes y sostenibles. Además, los ingredientes a base de gelatina y colágeno se incorporan cada vez más en productos antienvejecimiento, reafirmantes de la piel y enfocados en la reparación. El auge de las tendencias de "belleza desde adentro", incluidos los suplementos de belleza ingeribles, refuerza aún más la demanda de gelatina en aplicaciones cosméticas.
Avances tecnológicos en extracción y procesamiento
Los avances tecnológicos en extracción y procesamiento están impulsando el crecimiento en el mercado de gelatina de los Estados Unidos al mejorar la eficiencia, la consistencia y el rendimiento de las aplicaciones. Las técnicas de extracción modernas permiten mayores rendimientos, mejor control del peso molecular y mayor pureza, lo que permite a los fabricantes adaptar los grados de gelatina para aplicaciones específicas en alimentos, productos farmacéuticos y cosméticos. Los avances en el procesamiento enzimático y la filtración también han mejorado las propiedades funcionales como la resistencia del gel, la claridad y la solubilidad. Estas mejoras respaldan una adopción más amplia de la gelatina en aplicaciones de alto valor, incluidos los nutracéuticos, las cápsulas blandas y los alimentos funcionales. Las tecnologías de procesamiento mejoradas también reducen las impurezas y la variabilidad, ayudando a los fabricantes a cumplir con estrictos estándares de calidad y regulatorios.
Análisis del Impacto de las Restricciones*
| Restricción | (~) % de Impacto en el Pronóstico de CAGR | Relevancia Geográfica | Horizonte Temporal del Impacto |
|---|---|---|---|
| Fluctuación de los precios de las materias primas | -0.9% | Estados Unidos (nacional, con impacto agudo en los centros de procesamiento del Medio Oeste) | Corto plazo (≤ 2 años) |
| Interrupciones en la cadena de suministro que afectan el abastecimiento de materias primas | -0.7% | Estados Unidos (nacional, agravado por dependencias de importación) | Corto plazo (≤ 2 años) |
| Altos costos de producción y cumplimiento normativo para grados especializados de gelatina | -0.5% | Estados Unidos (corredores de producción farmacéutica y nutracéutica) | Mediano plazo (2-4 años) |
| Preocupaciones de percepción y alérgenos vinculadas a productos de origen animal | -0.6% | Estados Unidos (más fuerte en mercados costeros y urbanos con altas poblaciones veganas/vegetarianas) | Largo plazo (≥ 4 años) |
| Fuente: Mordor Intelligence | |||
Fluctuación de los precios de las materias primas
La fluctuación de los precios de las materias primas actúa como una restricción clave para el mercado de gelatina de los Estados Unidos, ya que la producción de gelatina depende en gran medida de insumos de origen animal como cueros bovinos, huesos y pieles porcinas. La variabilidad en el suministro de ganado, los costos de alimentación y las tasas de sacrificio impactan directamente en la disponibilidad y los precios de estas materias primas. Además, los cambios en los patrones de consumo de carne y la dinámica de exportación pueden restringir el suministro, lo que lleva a la volatilidad de costos para los fabricantes de gelatina. El aumento de los precios de los insumos incrementa los costos de producción y presiona los márgenes de ganancia, particularmente para la gelatina de grado alimentario y farmacéutico. Esta volatilidad también complica los acuerdos de precios a largo plazo con los clientes y limita la previsibilidad de costos. Como resultado, los fabricantes enfrentan desafíos para mantener precios estables y garantizar un suministro consistente en el mercado.
Interrupciones en la cadena de suministro que afectan el abastecimiento de materias primas
Las interrupciones en la cadena de suministro que afectan el abastecimiento de materias primas representan una restricción significativa para el mercado de gelatina de los Estados Unidos, ya que la producción depende en gran medida del acceso consistente a materiales de origen animal como cueros, huesos y pieles. Las interrupciones causadas por cuellos de botella logísticos, retrasos en el transporte o cierres de plantas de procesamiento pueden restringir la disponibilidad de materias primas y ralentizar la producción de gelatina. Eventos como brotes de enfermedades en el ganado, escasez de mano de obra y cambios regulatorios en el procesamiento de carne intensifican aún más los riesgos de suministro. La dependencia tanto de materias primas nacionales como importadas expone a los fabricantes a incertidumbres en el comercio transfronterizo y a la volatilidad de los costos de flete. Estos desafíos pueden generar tiempos de entrega más largos y un suministro inconsistente para las industrias de uso final. En consecuencia, la inestabilidad de la cadena de suministro socava la planificación de la producción y limita el impulso de crecimiento del mercado.
*Nuestras previsiones consideran los impactos de impulsores y restricciones como direccionales, no aditivos. Las previsiones de impacto reflejan el crecimiento base, los efectos de mezcla y las interacciones entre variables.
Análisis de Segmentos
Por Forma: Las Alternativas Marinas Ganan Terreno a Pesar del Dominio de Origen Animal
La gelatina de origen animal representó el 94,21% del mercado de gelatina de los Estados Unidos en 2025, lo que la convierte en la forma dominante de manera abrumadora por volumen y valor. Su liderazgo refleja cadenas de suministro largamente establecidas que abastecen eficientemente materias primas porcinas y bovinas a escala. Estas redes logísticas y de procesamiento maduras se traducen en claras ventajas de costo para los compradores de alimentos, productos farmacéuticos e industriales. La gelatina de origen animal también ofrece una resistencia de gel superior y propiedades de gelificación confiables que son críticas para productos de confitería como gomitas, malvaviscos y jaleas. En aplicaciones farmacéuticas, su rendimiento comprobado en cápsulas y tabletas refuerza su posición consolidada.
La gelatina de origen marino, aunque ocupa solo una pequeña participación del mercado de los Estados Unidos en 2025, se proyecta como la forma de más rápido crecimiento, con una CAGR prevista del 7,23% hasta 2031. Su impulso de crecimiento está estrechamente vinculado a la facilidad de cumplir con los requisitos de certificación halal y kosher en comparación con las fuentes animales tradicionales. Esto hace que la gelatina marina sea particularmente atractiva para las marcas que se dirigen a consumidores religiosos observantes y mercados de exportación con estrictas leyes dietéticas. El ingrediente también se beneficia de las tendencias de evitación de alérgenos y de "etiqueta más limpia", ya que algunos consumidores buscan alternativas a los productos derivados de porcinos o bovinos. En nutracéuticos, la gelatina marina se utiliza cada vez más en cápsulas premium, cápsulas blandas y mezclas de colágeno posicionadas en torno a beneficios articulares, cutáneos y de belleza.


Por Aplicación: El Dominio de los Alimentos Enmascara un Crecimiento más Rápido en Cuidado Personal
Los alimentos y bebidas representaron el 83,46% del mercado de gelatina de los Estados Unidos en 2025, lo que lo convierte en el segmento de aplicación dominante por un amplio margen. Este liderazgo refleja el uso extensivo de la gelatina en confitería, postres lácteos, productos cárnicos y alimentos listos para consumir, donde sus propiedades gelificantes, estabilizadoras y texturizantes son críticas. Los fabricantes dependen de la gelatina para proporcionar la masticabilidad característica de las gomitas, la textura suave de los yogures y la panna cotta, y la integridad estructural de los áspics y productos cárnicos. Su versatilidad en formatos dulces y salados ayuda a concentrar la demanda en este único y amplio segmento de aplicación. La rentabilidad de la gelatina de origen animal refuerza aún más su preferencia continua en el procesamiento de alimentos a gran escala. Como resultado, se espera que los alimentos y bebidas sigan siendo el ancla principal de demanda de gelatina en los Estados Unidos durante el horizonte de pronóstico previsible.
El cuidado personal y los cosméticos, aunque aún más pequeños en tonelaje absoluto en comparación con los usos alimentarios, representan la aplicación de más rápido crecimiento para la gelatina en los Estados Unidos, con una CAGR esperada del 6,79% hasta 2031. El crecimiento en este segmento está impulsado por el creciente interés del consumidor en sueros, cremas y mascarillas antienvejecimiento que incorporan activos derivados del colágeno y la gelatina. Los formatos de belleza ingeribles, como las gomitas y cápsulas de belleza, están ganando terreno a medida que las marcas promueven conceptos de "belleza desde adentro" que vinculan la salud de la piel, el cabello y las uñas con la ingesta de colágeno. El colágeno marino, en particular, se está posicionando en plataformas de mayor biodisponibilidad y un abastecimiento más limpio y premium, lo que resuena tanto con los consumidores de belleza como de bienestar. Esto está fomentando un mayor uso de gelatina y colágeno en nutricosmética que se sitúa en la intersección de los suplementos y el cuidado de la piel.

Análisis Geográfico
El mercado de gelatina de los Estados Unidos está estrechamente vinculado a la estructura más amplia de las industrias de proteínas animales e ingredientes alimentarios de los Estados Unidos. Las actividades de producción y distribución se concentran predominantemente en estados con infraestructura establecida de procesamiento de carne, cueros y huesos, como Iowa, Nebraska, Texas y California. Estas regiones apoyan el suministro de materias primas necesarias para la extracción de gelatina y albergan varias instalaciones de procesamiento que convierten los subproductos bovinos y porcinos en gelatina comercial. La proximidad a los centros de producción ganadera reduce los costos de transporte de los insumos brutos y fortalece la integración entre los proveedores upstream y los fabricantes de gelatina.
En el lado de la demanda, el consumo de gelatina está ampliamente distribuido en todo el país, con mayor actividad en regiones metropolitanas e industrializadas como el Noreste (Nueva York, Pensilvania), el Medio Oeste (Illinois, Ohio) y la Costa Oeste (California, Washington). Estas áreas tienen poblaciones densas y diversos sectores de manufactura de alimentos que incorporan gelatina en productos como confitería, postres, alternativas lácteas y alimentos procesados. Además, las importantes industrias farmacéuticas, nutracéuticas y de cuidado personal en estas regiones impulsan la demanda de grados especializados de gelatina utilizados en cápsulas, suplementos y formulaciones cosméticas.
Los Estados Unidos también desempeñan un papel en el comercio internacional dentro del mercado de gelatina, sirviendo tanto como importador de gelatinas especiales como exportador de grados de uso general. Los estados con sólidas redes de transporte y acceso a puertos, como Luisiana y Texas, facilitan las exportaciones a América del Sur y Asia. Los marcos regulatorios regionales, las consideraciones ambientales y la disponibilidad de mano de obra de procesamiento calificada influyen aún más en dónde las empresas invierten en nueva capacidad o amplían las instalaciones existentes. En general, la dinámica geográfica refleja un equilibrio entre la disponibilidad de recursos, los centros de demanda industrial y las ventajas logísticas que configuran el funcionamiento del mercado de gelatina en todo el país.
Panorama Competitivo
El mercado de gelatina de los Estados Unidos exhibe una concentración moderada, con un puñado de grandes productores multinacionales de ingredientes que controlan una participación significativa, mientras que fabricantes regionales más pequeños y proveedores especializados operan en segmentos de nicho. Los actores clave compiten sobre la base de la calidad del producto, el rendimiento funcional y la confiabilidad del suministro, particularmente en categorías como gelatina de grado alimentario, grado farmacéutico y grado técnico. Los grandes incumbentes se benefician de una extensa infraestructura de procesamiento, redes de distribución establecidas y relaciones de larga data con los principales fabricantes de alimentos, nutracéuticos y productos farmacéuticos, lo que les otorga una ventaja competitiva en contratos por volumen y soluciones personalizadas.
La diferenciación de productos y las ofertas de valor agregado son factores importantes que configuran la competencia en este mercado. Las empresas establecidas invierten en investigación y desarrollo para optimizar las funcionalidades de la gelatina, incluida la resistencia de gelificación, la viscosidad y la pureza para aplicaciones específicas como confitería, lácteos, cosméticos y producción de cápsulas. Mientras tanto, los actores medianos y regionales ágiles a menudo compiten en flexibilidad, servicio al cliente y formulaciones personalizadas para clientes más pequeños o usos finales especializados. Las certificaciones y estándares de calidad (por ejemplo, halal, kosher, no transgénico) también contribuyen al posicionamiento competitivo, ya que los compradores buscan cada vez más el cumplimiento de diversos requisitos regulatorios y orientados al consumidor.
La dinámica de precios y la gestión de los costos de producción influyen aún más en el entorno competitivo. Las fluctuaciones en los precios de las materias primas y los costos de energía pueden impactar los márgenes, lo que obliga a los fabricantes a centrarse en eficiencias operativas e integración de la cadena de suministro. Se observan asociaciones estratégicas, fusiones y expansiones de capacidad a medida que las empresas buscan ampliar sus carteras de productos y alcance geográfico. Además, la competencia de hidrocoloides alternativos y agentes gelificantes de origen vegetal añade presión, lo que lleva a los productores de gelatina a reforzar su propuesta de valor a través de la innovación y la calidad.
Líderes de la Industria de Gelatina de los Estados Unidos
Darling Ingredients Inc.
GELITA AG
Nitta Gelatin Co., Ltd.
Weishardt Group
Ajinomoto Co., Inc.
- *Nota aclaratoria: los principales jugadores no se ordenaron de un modo en especial

Desarrollos Recientes de la Industria
- Diciembre de 2025: Darling Ingredients Inc. y Tessenderlo Group NV han firmado un acuerdo definitivo, fusionando sus empresas de colágeno y gelatina en una nueva entidad conjunta, Nextida. En esta empresa, Darling controla una participación del 85%, mientras que Tessenderlo posee el 15% restante. Este movimiento reúne una impresionante facturación anual de alrededor de USD 1.500 millones y una capacidad de producción de 200.000 toneladas métricas, distribuidas en 22 a 23 instalaciones en todo el mundo.
- Octubre de 2025: ACG, líder mundial en soluciones farmacéuticas y nutracéuticas de dosificación sólida, anunció una inversión escalonada de USD 200 millones para establecer su primera instalación de fabricación de cápsulas duras vacías en los Estados Unidos en Atlanta, Georgia. El proyecto, que comenzará operaciones a principios de 2027, creará más de 200 empleos. El sitio producirá cápsulas de gelatina y vegetarianas (HPMC), mejorando la presencia regional de ACG y mejorando la confiabilidad del suministro, los tiempos de entrega y la calidad del servicio para los clientes de América del Norte.
- Abril de 2024: GELITA AG presentó dos nuevos productos: PeptENDURE, una formulación de péptidos de colágeno diseñada para atletas de resistencia y personas enfocadas en el envejecimiento activo, y EASYSEAL, una gelatina de grado farmacéutico optimizada para la producción de cápsulas blandas. Estos lanzamientos subrayan el compromiso de GELITA de aprovechar los mercados especializados de mayor margen a través de la innovación dirigida y el servicio técnico experto.


Alcance del Informe del Mercado de Gelatina de los Estados Unidos
De Origen Animal, De Origen Marino están cubiertos como segmentos por Forma. Alimentos y Bebidas, Cuidado Personal y Cosméticos, Suplementos están cubiertos como segmentos por Usuario Final.| De Origen Animal |
| De Origen Marino |
| Cuidado Personal y Cosméticos | |
| Alimentos y Bebidas | Panadería |
| Bebidas | |
| Confitería | |
| Productos Lácteos y Alternativas Lácteas | |
| Productos Alimentarios Listos para Consumir/Listos para Cocinar | |
| Otros | |
| Suplementos Dietéticos | |
| Productos Farmacéuticos | |
| Otros |
| Por Forma | De Origen Animal | |
| De Origen Marino | ||
| Por Aplicación | Cuidado Personal y Cosméticos | |
| Alimentos y Bebidas | Panadería | |
| Bebidas | ||
| Confitería | ||
| Productos Lácteos y Alternativas Lácteas | ||
| Productos Alimentarios Listos para Consumir/Listos para Cocinar | ||
| Otros | ||
| Suplementos Dietéticos | ||
| Productos Farmacéuticos | ||
| Otros | ||


Definición de mercado
- Usuario Final - El Mercado de Ingredientes Proteicos opera sobre una base B2B. Los fabricantes de Alimentos, Bebidas, Suplementos, Alimento Animal y Cuidado Personal y Cosméticos se consideran usuarios finales en el mercado estudiado. El alcance excluye a los fabricantes que compran suero líquido/seco para ser utilizado como agente aglutinante o espesante u otras aplicaciones no proteicas.
- Tasa de Penetración - La Tasa de Penetración se define como el porcentaje del Volumen del Mercado de Usuarios Finales Enriquecidos con Proteínas en el Volumen Total del Mercado de Usuarios Finales.
- Contenido Proteico Promedio - El contenido proteico promedio es el contenido proteico medio presente por cada 100 g de producto fabricado por todas las empresas de usuarios finales consideradas en el alcance de este informe.
- Volumen del Mercado de Usuarios Finales - El volumen del mercado de usuarios finales es el volumen consolidado de todos los tipos y formas de productos de usuarios finales en el país o región.
| Palabra clave | Definición |
|---|---|
| Alfa-lactoalbúmina (α-Lactoalbúmina) | Es una proteína que regula la producción de lactosa en la leche de casi todas las especies de mamíferos. |
| Aminoácido | Es un compuesto orgánico que contiene grupos funcionales tanto amino como de ácido carboxílico, que son necesarios para la síntesis de proteínas corporales y otros compuestos importantes que contienen nitrógeno, como la creatina, las hormonas peptídicas y algunos neurotransmisores. |
| Escaldado | Es el proceso de calentar brevemente las verduras con vapor o agua hirviendo. |
| BRC | Consorcio Minorista Británico |
| Mejorador de pan | Es una mezcla a base de harina de varios componentes con propiedades funcionales específicas diseñadas para modificar las características de la masa y dar atributos de calidad al pan. |
| BSF | Mosca Soldado Negro |
| Caseinato | Es una sustancia producida al añadir un álcali a la caseína ácida, un derivado de la caseína. |
| Enfermedad celíaca | La enfermedad celíaca es una reacción inmune a la ingesta de gluten, una proteína que se encuentra en el trigo, la cebada y el centeno. |
| Calostro | Es un fluido lácteo que liberan los mamíferos que han dado a luz recientemente, antes de que comience la producción de leche materna. |
| Concentrado | Es la forma menos procesada de proteína y tiene un contenido proteico que oscila entre el 40 y el 90% en peso. |
| Base de proteína seca | Se refiere al porcentaje de "proteína pura" presente en un suplemento después de que el agua que contiene se elimina completamente mediante calor. |
| Suero seco | Es el producto resultante de secar el suero fresco que ha sido pasteurizado y al que no se le ha añadido nada como conservante. |
| Proteína de huevo | Es una mezcla de proteínas individuales, que incluye ovoalbúmina, ovomucoide, ovoglobulina, conalbúmina, vitelina y vitelenina. |
| Emulsionante | Es un aditivo alimentario que facilita la mezcla de alimentos que son inmiscibles entre sí, como el aceite y el agua. |
| Enriquecimiento | Es el proceso de adición de micronutrientes que se pierden durante el procesamiento del producto. |
| ERS | Servicio de Investigación Económica del Departamento de Agricultura de los Estados Unidos |
| Extrusión | Es el proceso de forzar ingredientes mezclados blandos a través de una abertura en una placa perforada o troquel diseñado para producir la forma requerida. El alimento extruido se corta luego a un tamaño específico mediante cuchillas. |
| Fava | También conocida como Faba, es otra palabra para las habas amarillas partidas. |
| FDA | Administración de Alimentos y Medicamentos |
| Hojuelado | Es un proceso en el que típicamente un grano de cereal (como maíz, trigo o arroz) se descompone en sémola, se cocina con sabores y jarabes, y luego se prensa en hojuelas entre rodillos enfriados. |
| Agente espumante | Es un ingrediente alimentario que hace posible formar o mantener una dispersión uniforme de una fase gaseosa en un alimento líquido o sólido. |
| Servicio de alimentación | Se refiere a la parte de la industria alimentaria que incluye empresas, instituciones y compañías que preparan comidas fuera del hogar. Incluye restaurantes, cafeterías escolares y hospitalarias, operaciones de catering y muchos otros formatos. |
| Fortificación | Es la adición deliberada de micronutrientes que no se encuentran en ellos de forma natural o que se pierden durante el procesamiento, para mejorar el valor nutricional de un producto alimentario. |
| FSANZ | Normas Alimentarias de Australia y Nueva Zelanda |
| FSIS | Servicio de Inspección y Seguridad Alimentaria |
| FSSAI | Autoridad de Seguridad y Normas Alimentarias de la India |
| Agente gelificante | Es un ingrediente que funciona como estabilizador y espesante para proporcionar espesor sin rigidez mediante la formación de gel. |
| GHG | Gas de Efecto Invernadero |
| Gluten | Es una familia de proteínas que se encuentran en los cereales, incluidos el trigo, el centeno, la espelta y la cebada. |
| Cáñamo | Es una clase botánica de cultivares de Cannabis sativa cultivados específicamente para uso industrial o medicinal. |
| Hidrolizado | Es una forma de proteína fabricada exponiendo la proteína a enzimas que pueden romper parcialmente los enlaces entre los aminoácidos de la proteína y descomponer proteínas grandes y complicadas en piezas más pequeñas. Su procesamiento facilita y acelera su digestión. |
| Hipoalergénico | Se refiere a una sustancia que causa menos reacciones alérgicas. |
| Aislado | Es la forma más pura y procesada de proteína que ha sido sometida a separación para obtener una fracción proteica pura. Típicamente contiene ≥ 90% de proteína en peso. |
| Queratina | Es una proteína que ayuda a formar el cabello, las uñas y la capa exterior de la piel. |
| Lactoalbúmina | Es la albúmina contenida en la leche y obtenida del suero. |
| Lactoferrina | Es una glicoproteína de unión al hierro que está presente en la leche de la mayoría de los mamíferos. |
| Lupino | Son las semillas de leguminosas amarillas del género Lupinus. |
| Millennial | También conocido como Generación Y o Gen Y, se refiere a las personas nacidas entre 1981 y 1996. |
| Monogástrico | Se refiere a un animal con un estómago de un solo compartimento. Ejemplos de monogástricos incluyen humanos, aves de corral, cerdos, caballos, conejos, perros y gatos. La mayoría de los monogástricos generalmente no pueden digerir muchos materiales alimenticios con celulosa, como los pastos. |
| MPC | Concentrado de proteína de leche |
| MPI | Aislado de proteína de leche |
| MSPI | Aislado de proteína de soya metilada |
| Micoproteína | La micoproteína es una forma de proteína unicelular, también conocida como proteína fúngica, derivada de hongos para el consumo humano. |
| Nutricosmética | Es una categoría de productos e ingredientes que actúan como suplementos nutricionales para cuidar la belleza natural de la piel, las uñas y el cabello. |
| Osteoporosis | Es una condición médica en la que los huesos se vuelven frágiles y quebradizos por la pérdida de tejido, típicamente como resultado de cambios hormonales o deficiencia de calcio o vitamina D. |
| PDCAAS | La puntuación de aminoácidos corregida por digestibilidad de proteínas (PDCAAS) es un método para evaluar la calidad de una proteína basado tanto en los requisitos de aminoácidos de los humanos como en su capacidad para digerirla. |
| Consumo per cápita de proteína animal | Es la cantidad promedio de proteína animal (como leche, suero, gelatina, colágeno y proteínas de huevo) que está disponible para el consumo de cada persona en una población real. |
| Consumo per cápita de proteína vegetal | Es la cantidad promedio de proteína vegetal (como proteínas de soya, trigo, guisante, avena y cáñamo) que está disponible para el consumo de cada persona en una población real. |
| Quorn | Es una proteína microbiana fabricada utilizando micoproteína como ingrediente, en la que el cultivo de hongos se seca y se mezcla con albúmina de huevo o proteína de papa, que actúa como aglutinante, y luego se ajusta en textura y se prensa en diversas formas. |
| Listo para Cocinar (RTC) | Se refiere a productos alimentarios que incluyen todos los ingredientes, donde se requiere alguna preparación o cocción a través de un proceso que se indica en el envase. |
| Listo para Consumir (RTE) | Se refiere a un producto alimentario preparado o cocinado con anticipación, sin necesidad de cocción o preparación adicional antes de ser consumido. |
| RTD | Listo para Beber |
| RTS | Listo para Servir |
| Grasa saturada | Es un tipo de grasa en la que las cadenas de ácidos grasos tienen todos enlaces simples. Generalmente se considera poco saludable. |
| Salchicha | Es un producto cárnico elaborado con carne finamente picada y sazonada, que puede ser fresca, ahumada o en escabeche y que generalmente se rellena en una tripa. |
| Seitán | Es un sustituto cárnico de origen vegetal elaborado a partir de gluten de trigo. |
| Cápsula blanda | Es una cápsula a base de gelatina con relleno líquido. |
| SPC | Concentrado de proteína de soya |
| SPI | Aislado de proteína de soya |
| Espirulina | Es una biomasa de cianobacterias que puede ser consumida por humanos y animales. |
| Estabilizador | Es un ingrediente añadido a los productos alimentarios para ayudar a mantener o mejorar su textura original y sus características físicas y químicas. |
| Suplementación | Es el consumo o provisión de fuentes concentradas de nutrientes u otras sustancias que tienen como objetivo complementar los nutrientes en la dieta y están destinadas a corregir deficiencias nutricionales. |
| Texturizante | Es un tipo específico de ingrediente alimentario que se utiliza para controlar y alterar la sensación en boca y la textura de los productos alimentarios y de bebidas. |
| Espesante | Es un ingrediente que se utiliza para aumentar la viscosidad de un líquido o masa y hacerlo más espeso, sin cambiar sustancialmente sus otras propiedades. |
| Grasa trans | También llamada ácidos grasos trans insaturados o ácidos grasos trans, es un tipo de grasa insaturada que ocurre naturalmente en pequeñas cantidades en la carne. |
| TSP | Proteína de soya texturizada |
| TVP | Proteína vegetal texturizada |
| WPC | Concentrado de proteína de suero |
| WPI | Aislado de proteína de suero |


Metodología de Investigación
Mordor Intelligence sigue una metodología de cuatro pasos en todos nuestros informes.
- Paso 1: Identificar las Variables Clave: Las variables clave cuantificables (industriales y externas) relacionadas con el segmento de producto específico y el país se seleccionan de un grupo de variables y factores relevantes basados en investigación documental y revisión bibliográfica, junto con aportes de expertos primarios. Estas variables se confirman posteriormente mediante modelos de regresión (cuando sea necesario).
- Paso 2: Construir un Modelo de Mercado: Con el fin de desarrollar una metodología de pronóstico sólida, las variables y factores identificados en el Paso 1 se prueban contra los números históricos de mercado disponibles. A través de un proceso iterativo, se establecen las variables necesarias para el pronóstico del mercado y el modelo se construye sobre la base de estas variables.
- Paso 3: Validar y Finalizar: En este importante paso, todos los números de mercado, variables y evaluaciones de los analistas se validan a través de una extensa red de expertos en investigación primaria del mercado estudiado. Los encuestados se seleccionan en todos los niveles y funciones para generar una imagen holística del mercado estudiado.
- Paso 4: Resultados de la Investigación: Informes Sindicados, Asignaciones de Consultoría Personalizada, Bases de Datos y Plataformas de Suscripción


