
Dates Market Size and Share
Dates Market Analysis by Mordor Intelligence
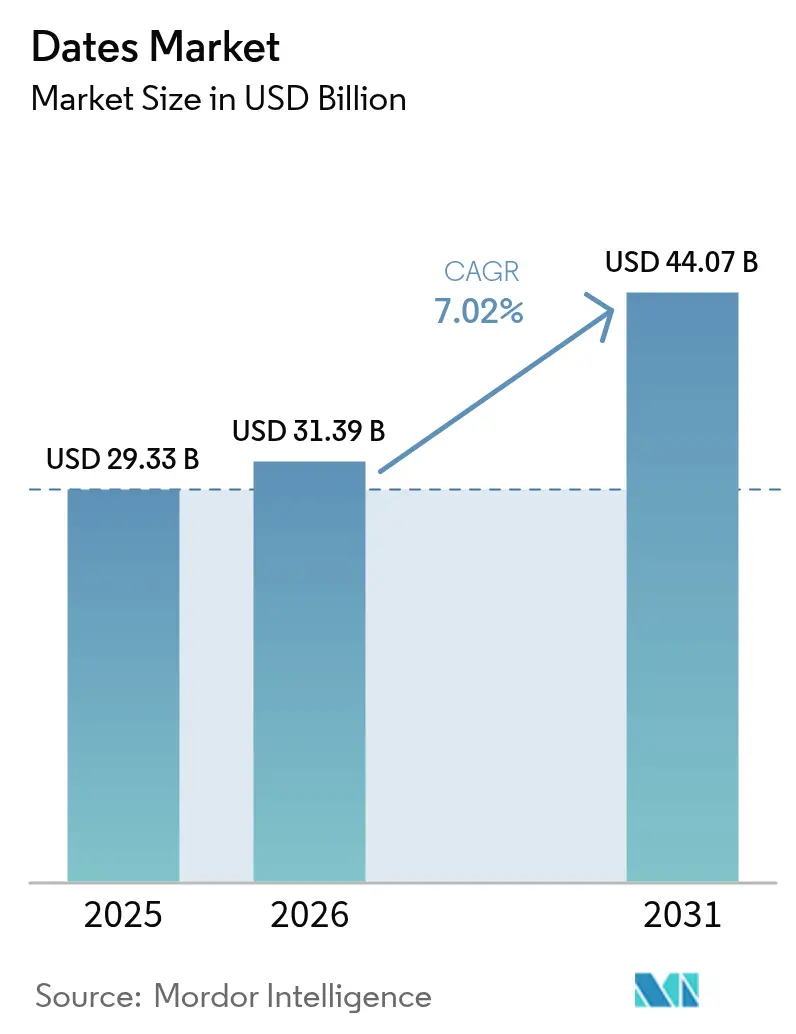
Dates market size in 2026 is estimated at USD 31.39 billion, growing from 2025 value of USD 29.33 billion with 2031 projections showing USD 44.07 billion, growing at 7.02% CAGR over 2026-2031. Surging consumer appetite for natural sweeteners, rising festival-linked demand peaks, and expanding cold-chain capacity collectively strengthen growth momentum across the dates market. Health-focused shoppers increasingly view dates as a functional food rich in fiber, minerals, and antioxidants, lifting premium price acceptance even in cost-sensitive regions. Smart-farming investments from precision irrigation to sensor-driven pest monitoring are raising average yields while addressing water scarcity and labor shortages. Trade support programs anchored in Saudi Arabia’s Vision 2030 and similar initiatives in the United Arab Emirates, Morocco, and Mexico continue to incentivize mechanization, export diversification, and value-added processing. Intensifying competition for premium Medjool varieties underscores the strategic importance of post-harvest technologies that preserve texture and flavor and unlock higher margins throughout the dates market.
Key Report Takeaways
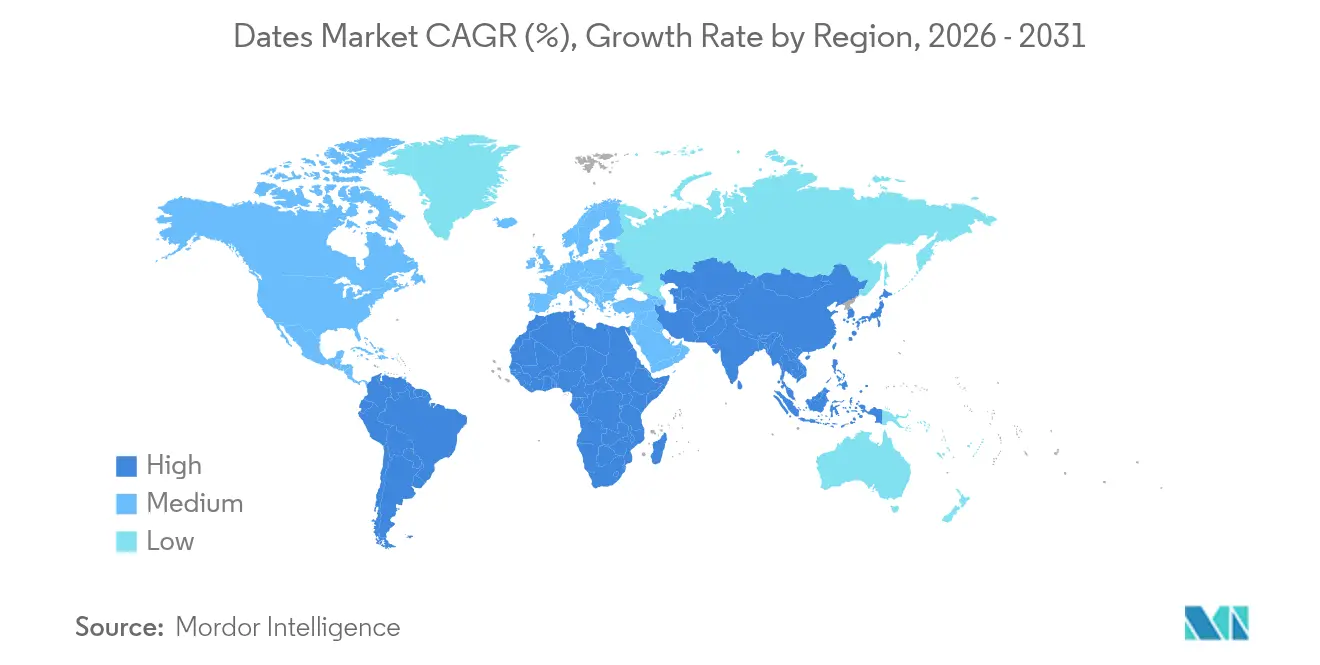
- By geography, the Middle East accounted for 37.60% of the date consumption value in 2025. Asia-Pacific is forecast to post the fastest expansion, with the region’s dates consumption value projected to rise at a 7.32% CAGR between 2026 and 2031.
Note: Market size and forecast figures in this report are generated using Mordor Intelligence’s proprietary estimation framework, updated with the latest available data and insights as of 2026.
Market Trends and Insights
Drivers Impact Analysis of Dates Market*
| Driver | (~) % Impact on CAGR Forecast | Geographic Relevance | Impact Timeline |
|---|---|---|---|
| Growing demand for plant-based natural sweeteners | +1.2% | North America, Europe, and global spillover | Medium term (2-4 years) |
| Growing festival-driven consumption in non-producing import markets | +0.8% | Asia-Pacific, Europe, and North America | Short term (≤ 2 years) |
| Rising yield and area harvested under dates | +1.0% | Middle East, North Africa, Mexico, and Morocco | Long term (≥ 4 years) |
| Government initiatives and trade support | +0.7% | Saudi Arabia, United Arab Emirates, and broader GCC | Medium term (2-4 years) |
| Expansion of post-harvest cold-chain infrastructure | +0.9% | Asia-Pacific and Europe investment clusters | Medium term (2-4 years) |
| Development of date-based sugar substitutes | +0.6% | North America, Europe, and emerging Asia-Pacific | Long term (≥ 4 years) |
| Source: Mordor Intelligence | |||
Growing Demand for Plant-Based Natural Sweeteners
Escalating sugar-reduction targets in packaged foods are catalyzing industrial Research and Development around date-derived syrups and powders. Tate and Lyle’s USD 1.8 billion purchase of CP Kelco in 2024 underscored mainstream ingredient suppliers’ move toward botanical sweetener portfolios. European clean-label regulation accelerates adoption, giving date processors the ability to deliver standardized Brix and flavor profiles, a compelling advantage. The dates market increasingly rewards producers that secure organic certification and traceability, prerequisites for multinational food and beverage contracts. Rapid adoption in snack bars, breakfast cereals, and vegan desserts anchors resilient demand even during macroeconomic slowdowns. The strategic value of date-based sweeteners, therefore, extends beyond niche health-food aisles into large-scale bakery, dairy, and beverage applications, amplifying premium variety demand across the dates market.
Growing Festival-Driven Consumption in Non-Producing Import Markets
Ramadan continues to trigger predictable demand spikes, enabling exporters to lock in premium forward contracts and optimize shipping cycles. Natural Delights reports that Medjool volumes quadruple during the holy month, with sales now spilling over to non-Muslim wellness shoppers seeking fiber-rich “superfruits”. European imports, at 184,000 metric tons valued at EUR 481 million (USD 520 million), reveal strong seasonal peaks around Christmas and New Year holidays, particularly in France, Germany, and the United Kingdom. This convergence of religious and secular holiday demand diversifies revenue risks and elevates the dates market in mature economies where alternative natural sweeteners already enjoy broad shelf space. Exporters that align packaging and marketing to festival themes consistently outperform commodity suppliers, highlighting the role of cultural alignment in the dates market.
Government Initiatives and Trade Support
Saudi Arabia’s Vision 2030 agenda positions dates as a flagship non-oil export, leveraging Saudi EXIM’s financing and insurance packages to underwrite global sales expansion.[1] Government matchmaking missions generated SAR 458 billion (USD 122 billion) in non-oil exports during 2024, with processed dates recording double-digit growth. Preferential credit for cold-chain projects and quality-certification subsidies amplify competitiveness for small and medium enterprises. Similar policy frameworks in the United Arab Emirates, Tunisia, and Morocco fast-track modern pack-house installations and promote Geographical Indication labelling. These coordinated actions strengthen the dates market’s resilience by professionalizing production standards and opening new distribution channels into Asia-Pacific and North America.
Development of Date-Based Sugar Substitutes
Retail penetration of date sugar rose sharply after Just Date secured nationwide placement at Sprouts in 2025, underlining mainstream consumer acceptance of whole-fruit sweetening alternatives. Encapsulation methods that protect polyphenols during high-heat baking allow date-based sweeteners to compete directly with stevia and monk fruit in cereals and confectionery. The shift lets producers capture additional value from lower-grade fruit unsuitable for table consumption, boosting overall grower profitability. Manufacturing alliances with beverage and snack giants ensure predictable offtake, anchoring long-term demand fundamentals for the dates market.
Restraints Impact Analysis of Dates Market*
| Restraint | (~) % Impact on CAGR Forecast | Geographic Relevance | Impact Timeline |
|---|---|---|---|
| High water footprint amid tightening water quotas | -1.8% | Saudi Arabia, Egypt, and wider Middle East | Short term (≤ 2 years) |
| Rising incidence of pest infestation | -1.1% | Saudi Arabia, United Arab Emirates, and North Africa | Medium term (2-4 years) |
| Volatile export tariffs from key producers | -0.7% | Global flows, Saudi Arabia, Iran, and Tunisia | Short term (≤ 2 years) |
| Labor shortages for hand-pollination and harvest | -0.9% | Middle East and California | Medium term (2-4 years) |
| Source: Mordor Intelligence | |||
High Water Footprint Amid Tightening Water Quotas
Date palms require 60-95 m³ of water per tree annually, placing growers under pressure as Gulf governments redistribute scarce aquifer reserves toward strategic food-security crops. Water-productivity targets of 1.3 kg fresh fruit per cubic meter challenge flood-irrigated plantations, driving accelerated adoption of drip and subsurface systems that can halve consumption while doubling yield. Upfront equipment costs remain prohibitive for many smallholders, prompting calls for shared-infrastructure hubs and concessional loans. Growers failing to modernize risk losing subsidies and export licenses, constraining expansion in traditional strongholds and influencing supply dynamics in the dates market.
Labor Shortages for Hand-Pollination and Harvest
Pollination requires trained crews to transfer male pollen to female inflorescences within a narrow bloom window with a 1:50 male-to-female tree ratio.[2] Seasonal labor shortages in California’s Coachella Valley and rising wage inflation in Gulf economies elevate production costs. Experimental multirotor drones equipped with robotic arms promise to reduce labor needs, yet commercial deployment still faces regulatory and cost hurdles. Until scalable mechanization matures, labor scarcity restrains yield growth, particularly for premium varieties commanding stringent quality standards in the dates market.
*Our forecasts treat driver/restraint impacts as directional, not additive. The impact forecasts reflect baseline growth, mix effects, and variable interactions.
Geography Analysis
Middle East Dates Market
The Middle East held 37.60% of the dates market size in 2025, with Saudi Arabia and the United Arab Emirates contributing substantial export revenues in 2024. National programs provide subsidized loans for pack-house automation and branding campaigns that position regional cultivars as luxury food gifts. Meanwhile, sustained aquifer depletion and escalating red palm weevil outbreaks demand a rapid transition to precision irrigation and integrated pest management, raising capital requirements across the dates market.
APAC Dates Market
Asia-Pacific’s dates market consumption value is projected to climb steadily, fueled by a 7.32% CAGR through 2031. India's significant date imports in 2024 were driven by increasing urban health consciousness and traditional holiday consumption patterns. The expansion of e-commerce, which is projected to dominate global online trade by 2025, has enabled the distribution of premium Medjool dates to tier-two and tier-three cities. In Indonesia and Malaysia, government initiatives to cultivate dates locally are underway, with success contingent on agricultural adaptability to humid conditions.
Europe and the Americas Dates Market
Europe’s consumption profile favors organic and Fair-Trade labels, with seasonal peaks at Ramadan and Christmas supporting predictable import scheduling. Proactive sustainability demands push exporters to disclose water footprint metrics and traceability data, benefitting growers who have invested in QR-code supply-chain systems. North American demand shows consistent single-digit growth. Domestic production in California’s Coachella Valley ensures year-round availability, while imports supplement premium and diversified varietal offerings. South America, particularly Mexico’s Sonora region, is in early-stage expansion, leveraging CRISPR-bred salt-tolerant cultivars to penetrate the dates market.
Regulatory Landscape
Regulatory requirements for dates in major import markets combine quality and safety controls with trade-policy variability. In the United States, USDA AMS enforces Section 8e import requirements for dates under 7 CFR Part 999, including minimum U.S. Grade B or better for dates entering for retail packaging, with exemptions for small shipments up to 70 lbs or lots designated for processing. In parallel, USDA APHIS phytosanitary rules govern entry to reduce pest introduction risks, raising the importance of documentation, inspection readiness, and traceability for exporters targeting the US retail channel. Trade measures also affect landed costs and procurement strategies.
A notable shift occurred April 5, 2025 under EO 14257, introducing a minimum global tariff of 10% with country-specific adjustments through 2025 and into early 2026. CBP tariff overviews and CRS updates reflect reciprocal-rate status as of February 2026. For date exporters and importers, this combination of Section 8e compliance, APHIS requirements, and moving tariff schedules increases the need for disciplined origin management, correct product-use declarations (retail vs processing), and contingency planning for pricing and lead times.
Value Chain Analysis
The dates value chain begins with upstream inputs and farm operations (planting material, water and irrigation systems, fertilizers and crop protection). It then moves to on-farm harvest and initial handling, followed by packing-house activities such as cleaning, dehydration or conditioning (where used), grading (often optical), sorting, and packaging. Downstream, the chain splits between the table-dates segment (retail packs, bulk foodservice) and the ingredients segment (pastes, syrups, powders). Cold chain and controlled storage support premium texture and shelf life, particularly for Medjool.
Logistics typically includes regional consolidation, port and airfreight options for high-value shipments, and importer or distributor networks that manage seasonal demand spikes tied to Ramadan and year-end holidays. Friction points concentrate in post-harvest capabilities and compliant market access rather than sheer production volume. Water constraints and labor intensity at harvest raise farm-gate costs in major producing regions, while downstream buyers require consistent grade specifications, food safety programs, and traceability. Broader agrifood chain dynamics shape costs and reliability: EU publications and international bodies highlight elevated input-price sensitivity and the importance of resilient firm-to-firm networks, while governments and operators continue to invest in multimodal corridors and port throughput to reduce bottlenecks. For dates exporters, this elevates the role of pack-house automation, cold-chain capacity, and contracted logistics during peak seasons to protect margins and reduce rejection risk.
Market Opportunities and Future Outlook
Opportunities are expanding in value-added date ingredients and premiumized formats that meet industrial specifications for sugar reduction and clean-label formulations. Adoption is supported by visible moves from mainstream ingredient suppliers and branded players: Tate and Lyle expanded its hydrocolloid and specialty-ingredient footprint via the 2024 acquisition of CP Kelco, while retail acceptance of whole-fruit sweeteners broadened after Just Date secured nationwide placement at Sprouts in 2025 for date sugar. These proof points point to room for processors that can deliver standardized Brix, flavor consistency, and verified claims (organic, traceability) for multinational food and beverage customers.
Processing and cold-chain scale in producing hubs is another lever as producers try to capture more value per tonne amid variable import demand patterns. In the UAE, Al Baraka has highlighted an integrated manufacturing model from its Dubai Industrial City processing facility (noted at 100,000 tonnes annual capacity) that links packing with cold-chain execution, aligning with the region’s broader push to build export-ready food manufacturing. At the same time, early-2026 trade signals indicate intensified competition for shelf space in Europe, encouraging exporters to diversify routes and channels, including e-commerce in import markets, and to shift more volumes into shelf-stable, ingredient-grade outputs that travel better and reduce reliance on a single seasonal retail window.
Recent Industry Developments in Dates Market
- April 2026: FreshPlaza reported EU date imports fell 22.6% year-on-year in the first quarter of 2026 to 44,019 metric tonnes, with import value down 18.1% to USD 122.65 million. This shift drives exporters to pursue premium differentiation and explore alternative channels outside core EU retail programs.
- August 2025: EastFruit covered Egypts 2025/26 Medjool campaign focused on scaling exports and expanding market reach in Europe, Canada, and East Asia. The push highlighted a deliberate shift toward premium varieties and structured export programs, raising competitive pressure for other origins in high-margin segments.
- April 2024: Tate and Lyle completed its USD 1.8 billion acquisition of CP Kelco, expanding its specialty ingredient portfolio relevant to clean-label formulation trends. This strengthening of large-scale ingredient platforms supports date-based sweetening systems and textures in packaged foods.
Dates Market Report Scope and Research Methodology
Market Definition and Coverage
This market is defined as the global value and volume of edible dates traded and consumed for human food use, covering fresh and dried fruit at prevailing wholesale and bulk trade pricing levels, before downstream retail markups are added.
Scope exclusions: Excludes date-derived ingredients such as date sugar, date syrup, and industrial extracts, and it also excludes non-food uses where dates are not consumed as food.
Segments Covered in This Report
- By Geography (Production Analysis (Volume), Consumption Analysis (Volume and Value), Import Analysis (Volume and Value), Export Analysis (Volume and Value), and Price Trend Analysis)
- North America
- United States
- Canada
- Europe
- Germany
- United Kingdom
- France
- Netherlands
- Italy
- Asia-Pacific
- India
- Indonesia
- Malaysia
- Pakistan
- South America
- Brazil
- Argentina
- Middle East
- United Arab Emirates
- Saudi Arabia
- Oman
- Africa
- Egypt
- Morocco
- North America
Data Sources, Market Sizing, and Validation
Desk Research
Desk research was used to map the demand pool, trade flows, and price signals that typically move the dates business across regions. We leaned on public agriculture and trade statistics such as FAOSTAT, UN Comtrade, ITC Trade Map, and USDA PSD, and then cross-checked with sources such as World Bank macro indicators and selected national agriculture ministry releases in major producing countries.
To keep the model realistic, secondary checks were also taken from company annual reports, investor presentations, customs and port updates, and reputable press coverage tied to harvest outcomes, freight conditions, and import policy shifts. Where available, a paid subscription for company financials and intelligence and an import and export shipment-level database were used to validate supplier footprints and trade directionality. The sources listed here are illustrative, and many other public references were also used for data collection, validation, and clarification during the study.
Primary Interviews and Surveys
Primary work focused on confirming how dates are priced, moved, and graded across seasons, and on checking which trade lanes and end markets were actually active in the base year. We spoke with exporters, importers, distributors, large buyers, and sector experts across APAC, EMEA, and the Americas so assumptions from desk research could be corrected where they did not match current market behavior.
Distribution of primary research fieldwork respondents
| Company type | Respondent position | Region |
|---|---|---|
| Top tier: 32% | CXOs: 19% | APAC: 40% |
| Mid tier: 49% | Functional/Unit leaders: 30% | EMEA: 36% |
| Smaller Players: 19% | Managers: 51% | Americas: 24% |
Market-Sizing & Forecasting
Sizing was built using a top-down approach where production and trade data reconstruct the addressable dates supply into consumption value by region, and then it is translated into USD using observed price bands. We started from country and regional production volumes, adjusted for export and import movements, and then applied pricing logic that reflects quality mix, seasonality, and destination market spreads.
To keep totals grounded, results were corroborated with selective bottom-up approximations such as sampled exporter and importer volumes, channel checks on wholesale pricing, and sanity checks using ASP times volume for a limited set of high-visibility routes. Key inputs that were tracked include harvested output trends, yield swings tied to weather events, import tariff or restriction changes, freight and container availability signals, and wholesale price movement by origin and destination. For forecasting, scenario analysis was used around harvest variability and trade policy sensitivity, supported by expert consensus on how quickly pricing normalizes after a shock and how demand shifts between origins when supply tightens. When company-level information was incomplete for a route or country, the gap was handled by applying conservative coverage ratios and then rebalancing with trade totals before finalizing the market value.
Data Validation & Update Cycle
Validation was done through multiple checks so the final numbers stay aligned with real market signals. Our analysts compared model outputs against independent indicators such as export unit values, import volumes in key destination countries, and year-on-year changes in production, and then outliers were reviewed until the variance had a clear reason.
Before sign-off, the model and assumptions are reviewed in steps by another analyst, and follow-up outreach is triggered when a new harvest shock, policy change, or abnormal price move appears in the data. Reports are refreshed annually, and interim updates are made when material events meaningfully shift supply, pricing, or trade flows. Right before delivery, a final pass is done so clients receive the latest updated view for the stated base year and forecast period.
Mordor Intelligence's Date Market Estimate Compared With Other Published Estimates
Published market sizes for dates often differ because each publisher uses its own product boundary, price point in the chain, and base year, and those choices change the final math. Differences also show up when one estimate leans more on production volumes while another leans more on trade values or nominal wholesale pricing.
Date-derived ingredients such as date syrup and date sugar sit outside Mordor Intelligence's scope, which explains part of the spread versus estimates that blend whole fruit with processed derivatives or retail-level value. Gaps can also come from how prices are set, since some figures use nominal wholesale prices by country while others mix farm-gate, export unit values, and destination-market premiums without fully reconciling them. Finally, refresh timing matters in this market because harvest variability and freight-driven price swings can quickly change value even when volumes move slowly.
Benchmark comparison
| Source | Market Size | Gaps in Research Methodology |
|---|---|---|
| Mordor Intelligence | USD 31.39 B (2026) | |
| Global Business Publisher A | USD 34.50 B (2026) | Uses a different base-year framing and may apply broader value capture assumptions, which can raise totals if retail or wider pricing layers are partially blended into the estimate. |
| Trade Analytics Publisher B | USD 17.10 B (2024) | Anchored to nominal wholesale prices and a different year, and it emphasizes aggregated market value signals that can sit below estimates that incorporate destination premiums and a fuller reconciliation of production and trade dynamics. |
Reading across the table, the gap is mainly explained by what is counted, the pricing point used, and the year chosen for the snapshot. Our process keeps the sizing traceable to production, trade, and price inputs that can be rechecked, and it also makes the adjustments visible when supply shocks or trade shifts change the market value.
Key Questions Answered in the Report
What is the global value of the dates market in 2026?
The dates market is valued at USD 31.39 billion in 2026 and is forecast to reach USD 44.07 billion by 2031.
Which region leads global consumption of dates?
The Middle East accounts for 37.60% of global consumption value, maintaining leadership due to longstanding cultivation expertise.
Which region is anticipated to grow fastest through 2031?
Asia-Pacific is projected to expand at a 7.32% CAGR, buoyed by rising incomes and festival-driven demand.
What are the main factors restraining supply growth?
High water requirements, red palm weevil infestations, volatile export tariffs, and labor shortages constrain expansion and profitability.