Nitric Acid Market Size
| Study Period | 2024 - 2029 |
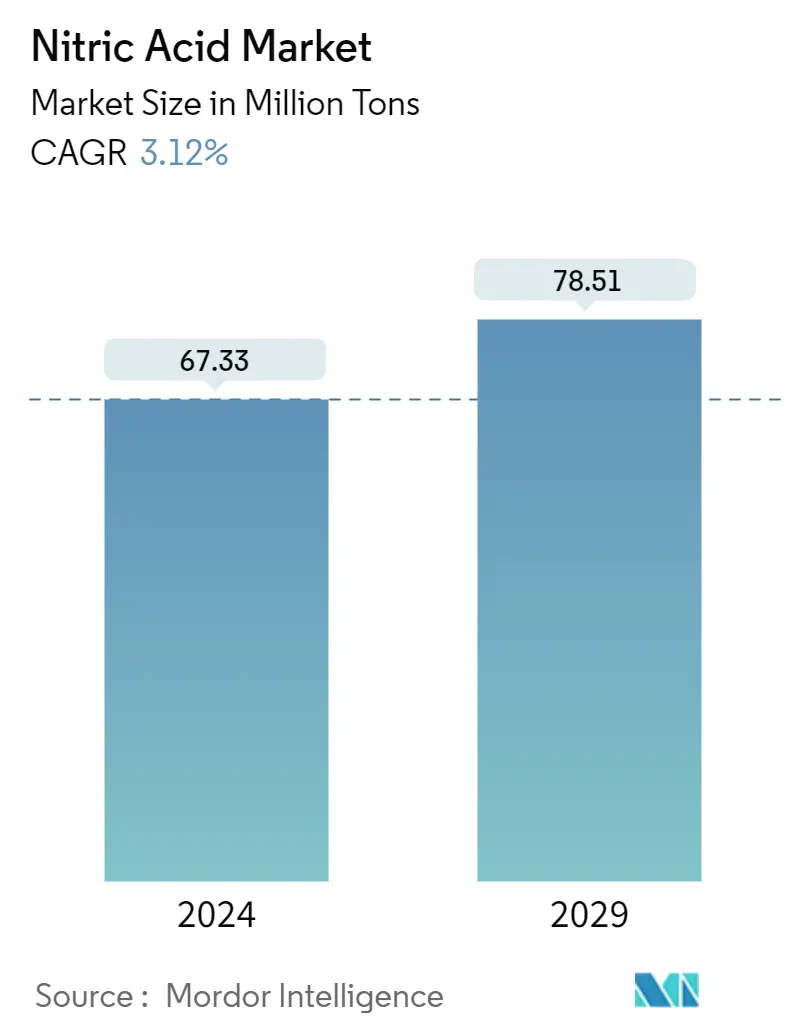
| Market Volume (2024) | 67.33 Million tons |
| Market Volume (2029) | 78.51 Million tons |
| CAGR (2024 - 2029) | 3.12 % |
| Fastest Growing Market | Asia Pacific |
| Largest Market | Asia Pacific |
Major Players
*Disclaimer: Major Players sorted in no particular order |
Need a report that reflects how COVID-19 has impacted this market and its growth?
Nitric Acid Market Analysis
The Nitric Acid Market size is estimated at 67.33 Million tons in 2024, and is expected to reach 78.51 Million tons by 2029, growing at a CAGR of 3.12% during the forecast period (2024-2029).
The COVID-19 pandemic in 2020 caused worldwide lockdowns, disruptions in manufacturing activities and supply chains, and industrial production halts, negatively impacting the nitric acid market. The market started to recover after the middle of 2021 and is expected to keep growing in the coming years.
Over the short term, the increasing demand for nitric acid from fertilizer and explosives manufacturing is expected to drive the market's growth.
However, health-related hazards caused by nitric acid are likely to hinder the growth of the market.
Nevertheless, technological development in nitric acid manufacturing and recent government incentives are expected to create lucrative market opportunities over the forecast period.
The Asia-Pacific region is expected to dominate the market globally, with the largest consumption from countries such as China, Japan, and India.
Nitric Acid Market Trends
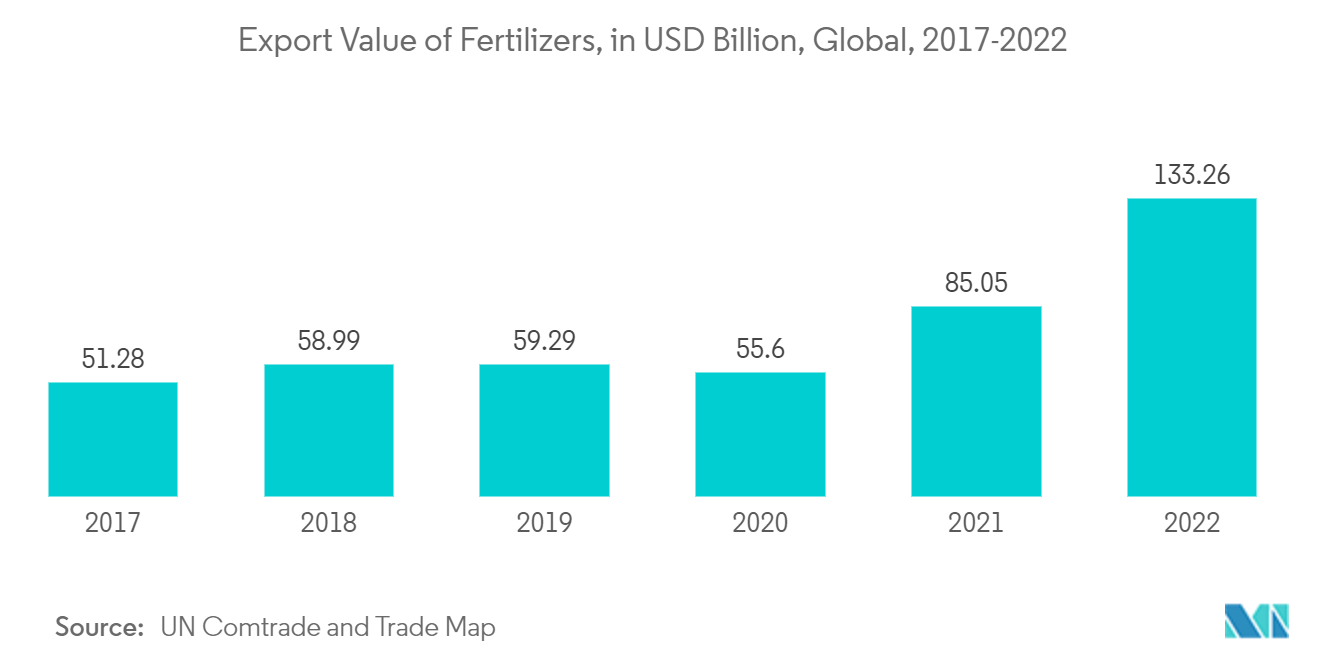
Increasing Demand from the Fertilizer Industry
- Nitric acid reacts with ammonia or other nitrogenous compounds to form nitrate salts, which are essential components of fertilizers like ammonium nitrate, calcium nitrate, and potassium nitrate. These fertilizers provide readily available nitrogen to plants, enhancing their growth and yield.
- Over 80% of nitric acid is used in manufacturing fertilizers. Fertilizers, like ammonium nitrate and calcium ammonium nitrate, are produced from nitric acid. To meet the increasing global food demand, more arable land is required for cultivation.
- Ammonium nitrate is a popular, efficient nitrogen-based fertilizer with around 35% (by mass) of total nitrogen content. Moreover, calcium ammonium nitrate (CAN) fertilizer has a nitrogen content of ~25-28%. CAN fertilizer is used to supply nitrogen to advance the growth of any plant.
- Calcium ammonium nitrate is manufactured by mixing molten ammonium nitrate and calcium carbonate at a temperature of around 170°C. It is hygroscopic and can absorb moisture from the environment. Thus, calcium ammonium nitrate can be used in soil without sufficient water.
- According to the USDA Foreign Agricultural Service, China, Russia, the United States, India, and Canada produce more than 60% of the world’s fertilizer nutrients combined. Russia and the United States each produce less than 10% of global fertilizers, while China produces approximately 25%.
- In September 2022, the US government announced programs worth USD 500 million to boost domestic fertilizer production, and the European Union is being urged to take similar action. Canada, already the world's largest supplier of potash fertilizers, announced in November 2022 that it will boost its fertilizer exports by 20% annually, filling a gap left by blocked shipments from other countries.
- According to the International Fertilizer Association (IFA), China is the largest user of fertilizer, consuming nearly one-quarter of global fertilizer supplies. In 2022, a total of 55.7 million tons of NPK fertilizer was produced in China. This was 55.44 million tons in 2021 and 54.96 million tons in 2020.
- According to FERTILIZERS EUROPE, annual nitrogen fertilizer consumption in the European Union is expected to reach 10.6 million tons by the 2029/2030 season, compared to the current average of 11.2 million tons. After several years of recovery, annual fertilizer consumption over the next ten years is foreseen to decrease for the fourth consecutive year, thereby restricting market growth.
- Thus, the factors mentioned above are likely to affect the nitric acid market for fertilizer application during the forecast period.
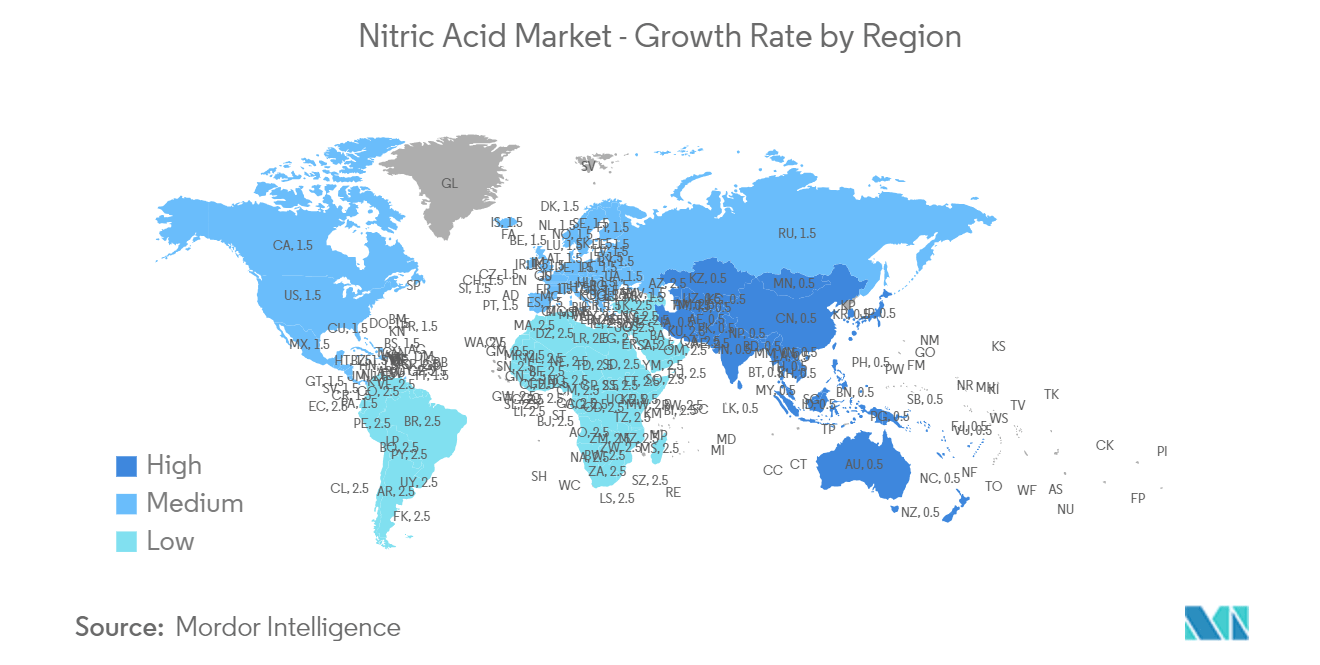
Asia-Pacific to Dominate the Market
- Asia-Pacific is expected to be the dominant market in nitric acid production, owing to the largest production and consumption of fertilizers in Asia-Pacific countries, including China, India, and South Korea.
- For instance, in 2022, according to the survey conducted by the International Fertilizer Industry Association and the 2023 Fact Book published report by Nutrien, the Asia-Pacific region accounted for the highest volume of consumption of agricultural fertilizer worldwide.
- According to TrendEconomy, South Korea was the largest exporter of nitric acid worldwide in 2022 and accounted for nearly exports worth USD 144 million or 25% of the global exports. Moreover, China accounts for approximately 7% of the overall agricultural acreage globally, thus feeding 22% of the world’s population. The country is the largest producer of various crops, including rice, cotton, potatoes, and others. Hence, the demand for nitric acid, which is used in fertilizers, is rapidly increasing owing to the large-scale agricultural activities in the country.
- According to the Fertilizer Association of India, the production of total fertilizer stood at 42.59 million MT during 2021-22, representing a slight decline of 1.1% over 2020-21.
- According to OICA, China, Japan, India, and South Korea were among the top 5 largest producers of vehicles in the world. Therefore, the Asia-Pacific's automotive end-user industry accounts for the most significant demand for nitric acid compared to other regions worldwide.
- Nitric acid is a raw material for inks, pigments, and dyes, which have major applications in the textile industry. According to Fibre2Fashion, China exported textiles, apparel, and clothing accessories worth USD 323.344 billion in 2022, registering a growth of 2.53% compared to 2021.
- Nitric acid is used to produce explosives such as trinitrotoluene (TNT), nitrocellulose, nitroglycerin, and others, which are being used in mining applications. Also, in January 2024, the Ministry of Mines and the Government of India signed their first-ever lithium exploration and mining project agreement between Khanij Bidesh India Limited (KABIL) and the state-owned enterprise of Catamarca province of Argentina. Such initiatives can further augument the market of nitric acid in the country.
- Therefore, the factors mentioned above are expected to have a significant impact on the market in the coming years.
Nitric Acid Industry Overview
The nitric acid market is fragmented in nature. The major companies in the market studied (not in any particular order) include CF Industries Holdings Inc., TKG HUCHEMS, Yara, LSB INDUSTRIES, and Deepak Fertilisers and Petrochemicals Corporation Ltd (DFPCL).
Nitric Acid Market Leaders
Yara
LSB INDUSTRIES
Deepak Fertilisers and Petrochemicals Corporation Ltd (DFPCL)
CF Industries Holdings Inc.
TKG HUCHEMS
*Disclaimer: Major Players sorted in no particular order
Nitric Acid Market News
- August 2023: Deepak Fertilisers And Petrochemicals Corporation Limited announced the brownfield expansion of nitric acid at Dahej in Gujarat, which is part of its strategic growth journey. Its Board of Directors approved the setting up of a Weak Nitric Acid (WNA) plant with a capacity of 300 KT PA and two Concentrated Nitric Acid (CNA) plants with a total capacity of 150 KT PA.
- July 2023: CF Fertilisers UK Limited, a subsidiary of CF Industries Holdings, Inc., announced a proposal to permanently close the ammonia plant at its Billingham Complex in order to secure the long-term sustainability of its business in the United Kingdom and more efficiently serve its customers in the country. The Company intends to continue to produce ammonium nitrate (AN) fertilizer and nitric acid at the Billingham site using imported ammonia, as it has for the last ten months following its decision to temporarily idle the plant in August 2022.
- December 2022: According to the most recent Securities & Exchange Commission filing, Ritholtz Wealth Management increased its position in CF Industries Holdings, Inc. by 99.9% during the third quarter. After acquiring an additional 11,176 shares during the quarter, the business now owned 22,368 shares of the basic materials company's stock.
- June 2022: CF Fertilisers UK Limited announced plans to restructure its operations in the United Kingdom. CF Fertilisers UK intends to focus its production operations in the United Kingdom entirely at the Billingham manufacturing facility in Teesside. Billingham has a sizable volume of ammonia and nitric acid industrial contracts that pass on natural gas costs to consumers, laying the groundwork for lucrative operations.
Nitric Acid Market Report - Table of Contents
1. Introduction
1.1 Study Assumptions
1.2 Scope of the Study
2. Research Methodology
3. Executive Summary
4. Market Dynamics
4.1 Drivers
4.1.1 Increasing Usage from the Fertilizers Segment
4.1.2 Increasing Demand from Explosives Manufacturing
4.2 Restraints
4.2.1 Health Hazards Caused by Nitric Acid
4.2.2 Environmental Regulations and Policies
4.3 Industry Value Chain Analysis
4.4 Porter's Five Forces Analysis
4.4.1 Bargaining Power of Suppliers
4.4.2 Bargaining Power of Buyers
4.4.3 Threat of New Entrants
4.4.4 Threat of Substitute Products and Services
4.4.5 Intensity of Competitive RiIvalry
4.5 Trade Flow Analysis
4.6 Cost Analysis
5. Market Segmentation (Market Size in Volume)
5.1 End-user Industry
5.1.1 Fertilizers
5.1.2 Aerospace
5.1.3 Inks, Pigments, and Dyes
5.1.4 Chemical Manufacturing
5.1.5 Explosives
5.1.6 Other End-user Industries (Pharmaceuticals, Food Processing)
5.2 Geography
5.2.1 Asia-Pacific
5.2.1.1 China
5.2.1.2 India
5.2.1.3 Japan
5.2.1.4 South Korea
5.2.1.5 Indoneisa
5.2.1.6 Malaysia
5.2.1.7 Vietnam
5.2.1.8 Thailand
5.2.1.9 Rest of Asia-Pacific
5.2.2 North America
5.2.2.1 United States
5.2.2.2 Mexico
5.2.2.3 Canada
5.2.3 Europe
5.2.3.1 Germany
5.2.3.2 United Kingdom
5.2.3.3 France
5.2.3.4 Italy
5.2.3.5 Russia
5.2.3.6 Turkey
5.2.3.7 NORDIC
5.2.3.8 Spain
5.2.3.9 Rest of Europe
5.2.4 South America
5.2.4.1 Brazil
5.2.4.2 Argentina
5.2.4.3 Colombia
5.2.4.4 Rest of South America
5.2.5 Middle-East and Africa
5.2.5.1 Saudi Arabia
5.2.5.2 United Arab Emirates
5.2.5.3 Qatar
5.2.5.4 Nigeria
5.2.5.5 Egypt
5.2.5.6 Rest of Middle-East and Africa
6. Competitive Landscape
6.1 Merger and Acquisitions, Joint Ventures, Collaborations, and Agreements
6.2 Market Share (%)** / Ranking Analysis
6.3 Strategies Adopted by Leading Players
6.4 Company Profiles
6.4.1 BASF SE
6.4.2 CF Fertilisers UK
6.4.3 Deepak Fertilisers and Petrochemicals Corporation Ltd. (DFPCL)
6.4.4 Gujarat Narmada Valley Fertilizers & Chemicals Limited (GNFC)
6.4.5 Hanwha Corporation
6.4.6 TKG HUCHEMS
6.4.7 INEOS
6.4.8 LSB INDUSTRIES
6.4.9 MAXAMCORP HOLDING SL
6.4.10 Mitsubishi Chemical Corporation
6.4.11 Nutrien Ltd.
6.4.12 Sasol Ltd.
6.4.13 Sinopec Nanjing Chemical Industries Co. Ltd. (China Petrochemical Corporation)
6.4.14 Sumitomo Chemical Co. Ltd.
6.4.15 Yara
- *List Not Exhaustive
7. Market Opportunities and Future Trends
7.1 Technological Developments in Nitric Acid Manufacturing and Recent Government Incentives
Nitric Acid Industry Segmentation
Nitric acid is a colorless, highly corrosive mineral acid with the chemical formula HNO3. It can be produced through a two-step process, including the oxidation of ammonia and the absorption of nitrogen oxides produced. Nitric acid has major applications in the fertilizer industry.
The nitric acid market is segmented by end-user industry and geography. By end-user industry, the market is segmented into fertilizers, aerospace, inks, pigments, dyes, chemical manufacturing, explosives, and other end-user industries (metal treatment, uranium processing, etc.). The report also covers the market size and forecasts for the nitric acid market in 27 countries across the major regions.
For each segment, the market sizing and forecasts have been done based on volume (tons).
| End-user Industry | |
| Fertilizers | |
| Aerospace | |
| Inks, Pigments, and Dyes | |
| Chemical Manufacturing | |
| Explosives | |
| Other End-user Industries (Pharmaceuticals, Food Processing) |
| Geography | |||||||||||
| |||||||||||
| |||||||||||
| |||||||||||
| |||||||||||
|
Nitric Acid Market Research FAQs
How big is the Nitric Acid Market?
The Nitric Acid Market size is expected to reach 67.33 million tons in 2024 and grow at a CAGR of 3.12% to reach 78.51 million tons by 2029.
What is the current Nitric Acid Market size?
In 2024, the Nitric Acid Market size is expected to reach 67.33 million tons.
Who are the key players in Nitric Acid Market?
Yara, LSB INDUSTRIES, Deepak Fertilisers and Petrochemicals Corporation Ltd (DFPCL), CF Industries Holdings Inc. and TKG HUCHEMS are the major companies operating in the Nitric Acid Market.
Which is the fastest growing region in Nitric Acid Market?
Asia Pacific is estimated to grow at the highest CAGR over the forecast period (2024-2029).
Which region has the biggest share in Nitric Acid Market?
In 2024, the Asia Pacific accounts for the largest market share in Nitric Acid Market.
What years does this Nitric Acid Market cover, and what was the market size in 2023?
In 2023, the Nitric Acid Market size was estimated at 65.23 million tons. The report covers the Nitric Acid Market historical market size for years: . The report also forecasts the Nitric Acid Market size for years: 2024, 2025, 2026, 2027, 2028 and 2029.
Nitric Acid Industry Report
Statistics for the 2024 Nitric Acid market share, size and revenue growth rate, created by Mordor Intelligence™ Industry Reports. Nitric Acid analysis includes a market forecast outlook to 2029 and historical overview. Get a sample of this industry analysis as a free report PDF download.
