Market Overview
| Study Period | 2021 - 2031 |
|---|---|
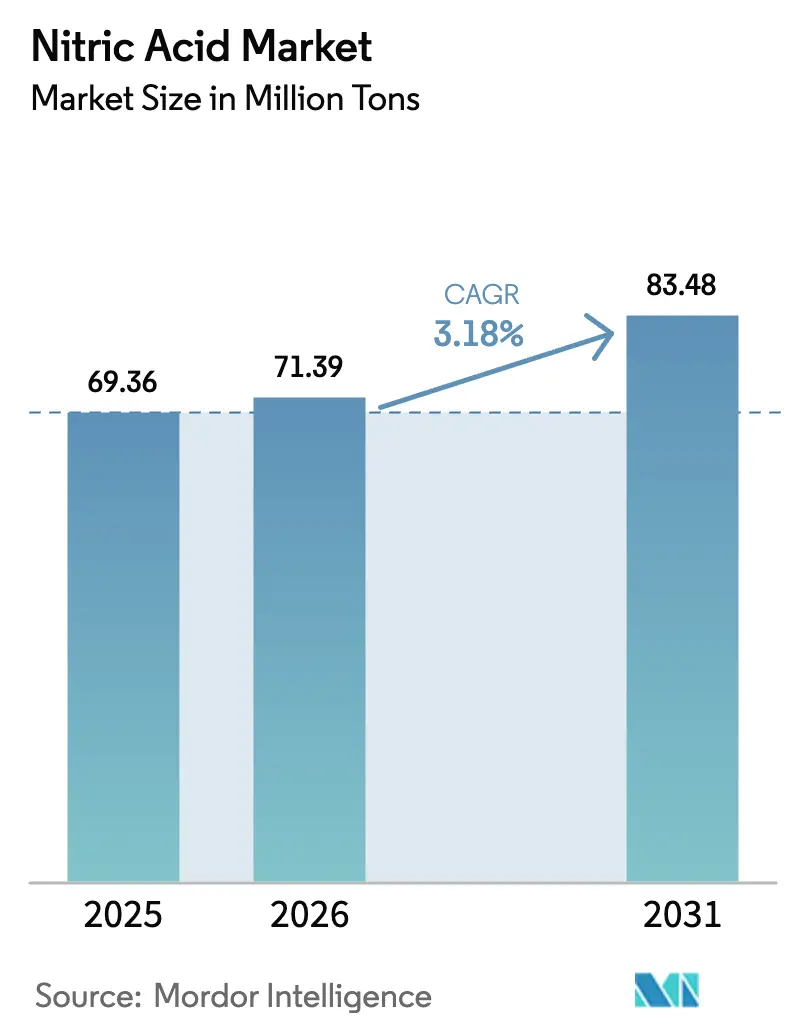
| Market Volume (2026) | 71.39 Million tons |
| Market Volume (2031) | 83.48 Million tons |
| Growth Rate (2026 - 2031) | 3.18% CAGR |
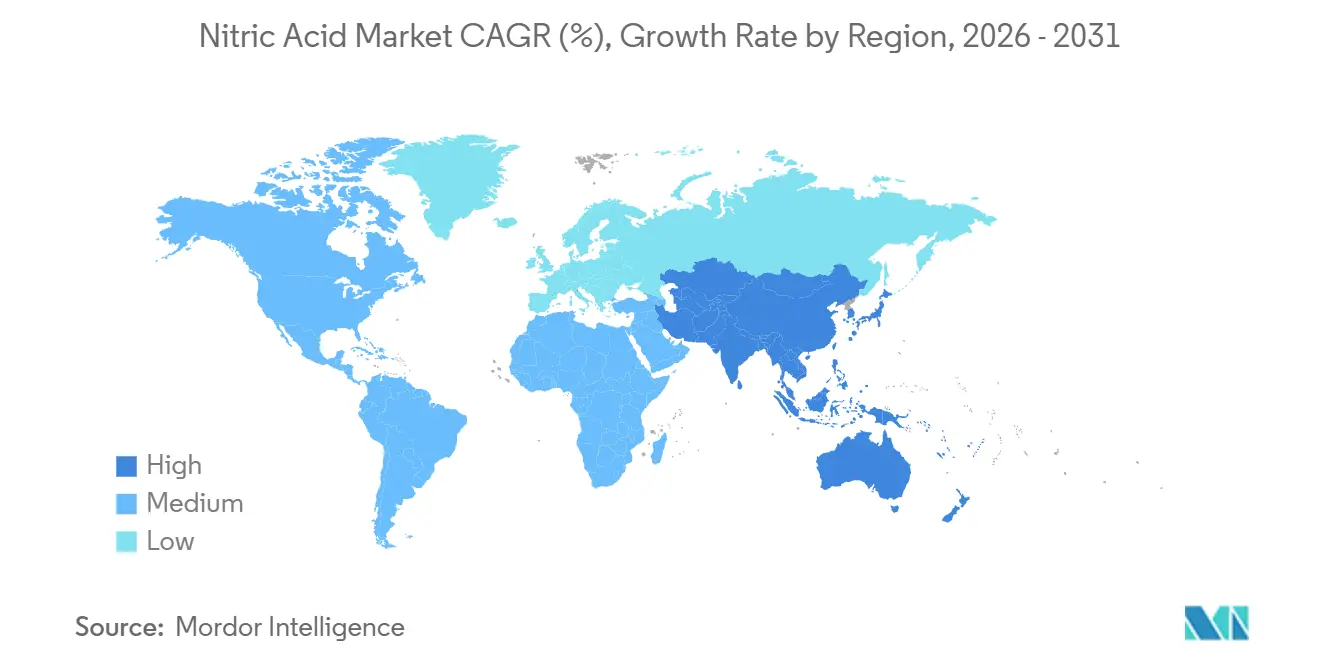
| Fastest Growing Market | Asia Pacific |
| Largest Market | Asia Pacific |
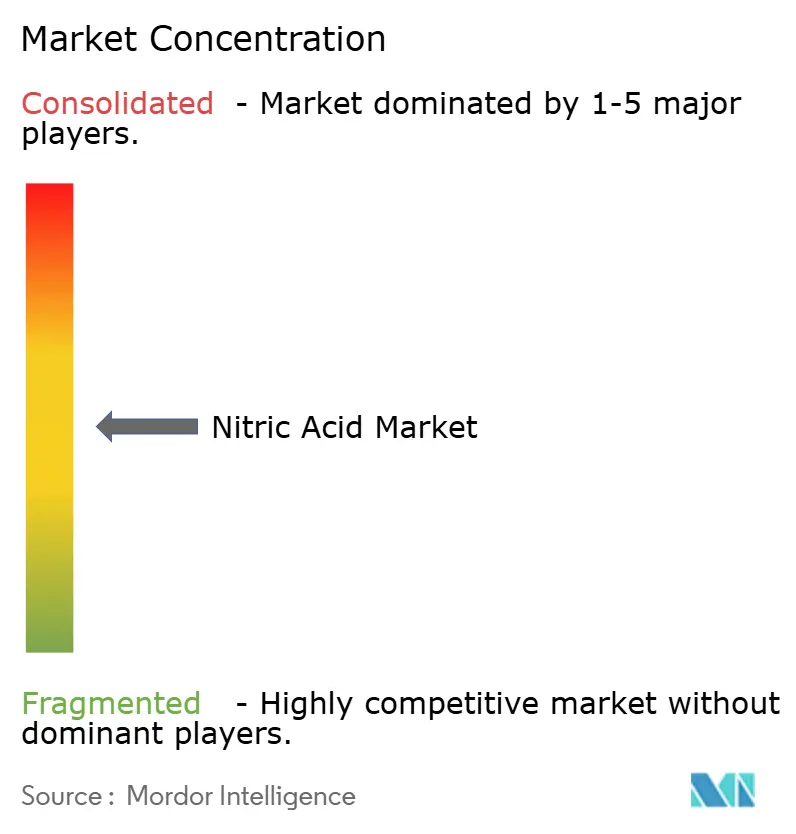
| Market Concentration | Medium |
Major Players *Disclaimer: Major Players sorted in no particular order Image © Mordor Intelligence. Reuse requires attribution under CC BY 4.0. | |
Nitric Acid Market Analysis by Mordor Intelligence
The Nitric Acid Market size is expected to increase from 69.36 million tons in 2025 to 71.39 million tons in 2026 and reach 83.48 million tons by 2031, growing at a CAGR of 3.18% over 2026-2031. Fertilizer‐grade weak acid will continue to anchor volume demand, yet concentrated grades are steadily gaining share as polyamide 6,6 and explosives applications expand. Europe’s Carbon Border Adjustment Mechanism (CBAM) is accelerating a shift toward domestically produced low-carbon calcium ammonium nitrate, while Asia-Pacific miners are driving incremental requirements for technical ammonium nitrate. Natural-gas price volatility is the primary cost risk. Strategic capital is therefore flowing either to low-cost feedstock regions or to decarbonized projects that monetize low-carbon premiums under CBAM-like policies.
Key Report Takeaways
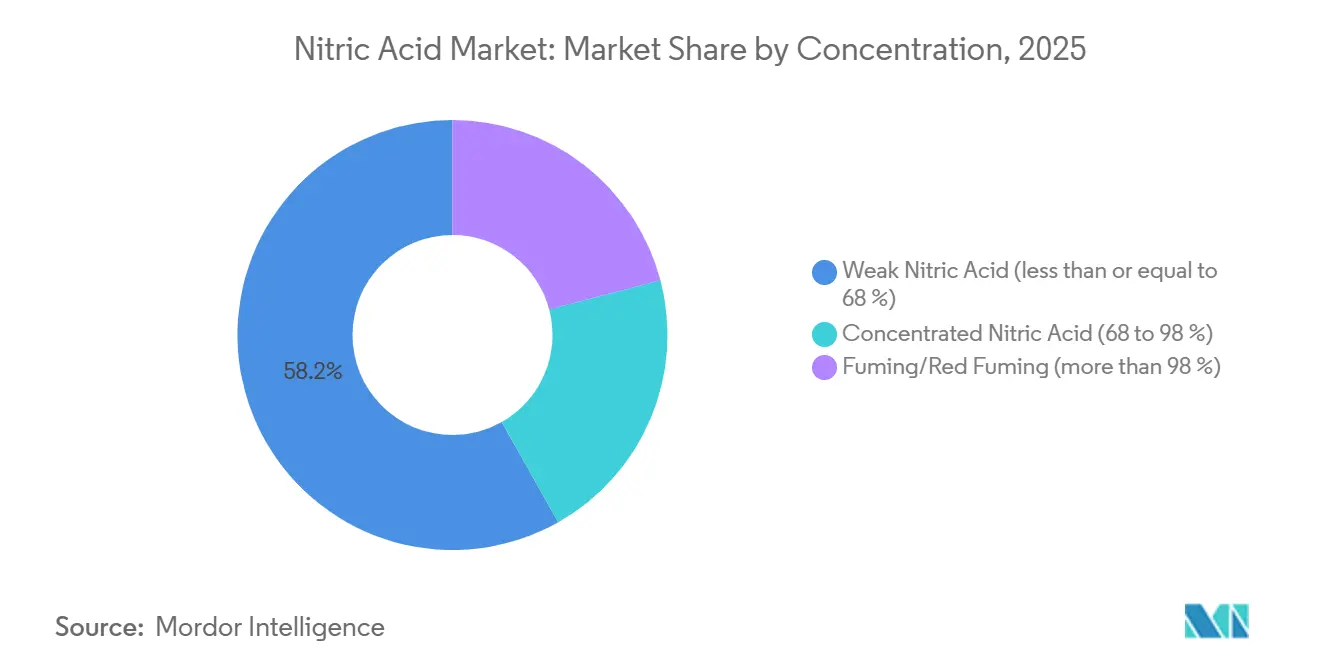
- By concentration, weak nitric acid captured 58.18% of the nitric acid market share in 2025; concentrated nitric acid is forecast to expand at a 3.64% CAGR to 2031.
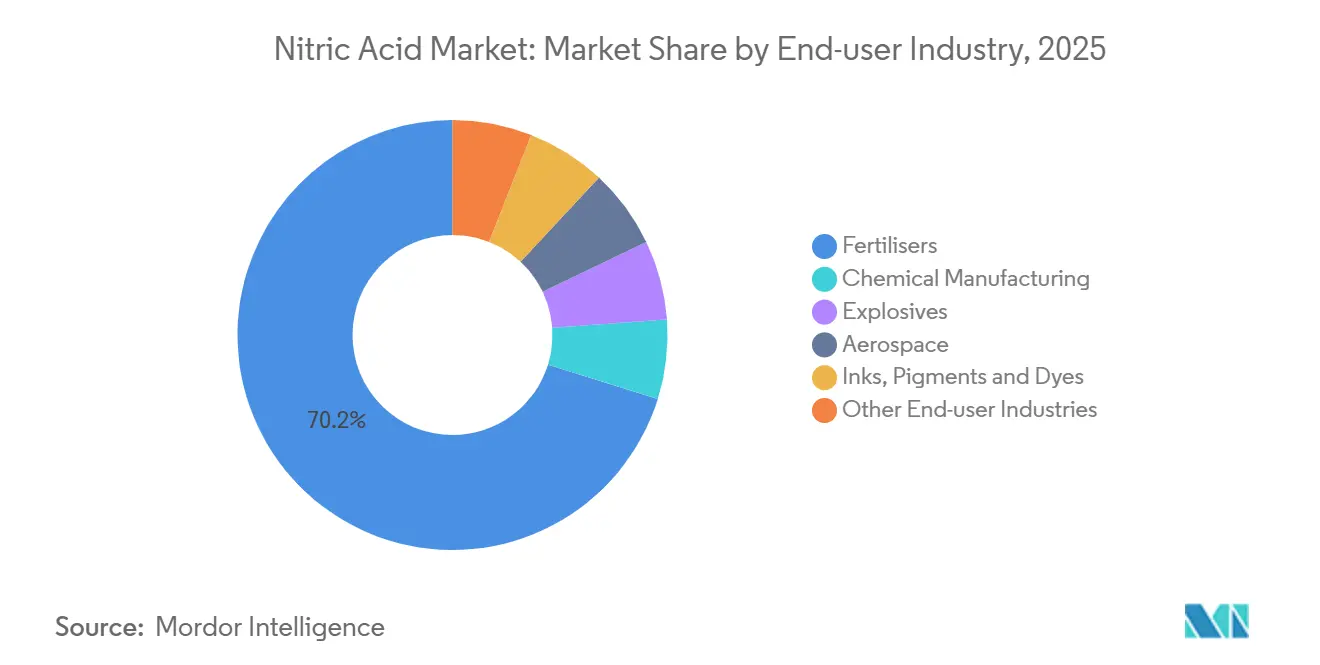
- By end-user industry, fertilizers dominated with 70.18% revenue share in 2025, while explosives led growth at a 3.97% CAGR through 2031.
- By geography, Asia-Pacific accounted for 59.01% of the nitric acid market size in 2025 and is advancing at a 3.81% CAGR to 2031.
Note: Market size and forecast figures in this report are generated using Mordor Intelligence’s proprietary estimation framework, updated with the latest available data and insights as of January 2026.
Global Nitric Acid Market Trends and Insights
Drivers Impact Analysis
| Drivers | (~) % Impact on CAGR Forecast | Geographic Relevance | Impact Timeline |
|---|---|---|---|
| Surging demand for low-carbon ammonium-nitrate fertilizers across Europe | +0.6% | Europe, with spillover to North America | Medium term (2-4 years) |
| Rising adoption of polyamide 6,6 for automotive lightweighting mandates | +0.4% | Global, concentrated in North America, Europe, and China | Medium term (2-4 years) |
| Capacity expansions in recycled-feedstock adipic-acid facilities | +0.3% | Asia-Pacific core, emerging in Europe | Long term (≥ 4 years) |
| Increasing demand from explosives manufacturing | +0.5% | Asia-Pacific (India, Indonesia, Australia), Middle East and Africa | Short term (≤ 2 years) |
| Government incentives for on-site weak-nitric-acid units in Indian pharma clusters | +0.2% | India, with pilot interest in Bangladesh and Vietnam | Medium term (2-4 years) |
| Source: Mordor Intelligence | |||
Surging Demand for Low-carbon Ammonium-nitrate Fertilizers Across Europe
In 2023, CBAM initiated transitional reporting, setting the stage for levies on embedded emissions in fertilizers starting in 2026. This move nudges European buyers towards a locally produced, low-carbon calcium ammonium nitrate, which enjoys a price premium[1]European Commission, “Carbon Border Adjustment Mechanism,” europa.eu. Highlighting this shift, ATOME Energy, with backing from a Yara offtake, is spearheading a green CAN project in Paraguay, targeting an annual output. Simultaneously, the EU's 2026 revision of the Nitrates Directive is tightening limits on manure-derived nitrogen. This change is set to indirectly boost the demand for mineral nitrates, known for their precise nutrient release. According to IFA, global ammonia capacity is projected to rise significantly by 2029. Notably, green ammonia is expected to constitute a small percentage of this capacity, positioning it as a niche yet strategic feedstock for low-carbon nitric acid. In response, European producers are increasingly integrating green ammonia, aiming to safeguard their margins and tap into premium market niches.
Rising Adoption of Polyamide 6,6 for Automotive Lightweighting Mandates
U.S. CAFE and EU Euro 7 regulations are pushing for mass reduction, leading to a surge in the use of polyamide 6,6 for under-hood and battery-pack components. Adipic acid, produced through the nitric-acid oxidation of cyclohexanol/one, meets most of the nylon-6,6 demand. A 2024 shutdown of BASF’s adipic unit in Ludwigshafen tightened the European supply, leading Invista’s plant in Victoria, Texas, to boost its nitric acid off-take. New chemical-recycling methods utilize nitric acid for depolymerizing nylon-6,6, presenting an additional growth opportunity. The trend is further bolstered by electrified powertrains, with Tesla opting for glass-fiber-reinforced PA 6,6 casings in its structural battery packs[2]Tesla Inc., “Battery Technology Update,” tesla.com.
Capacity Expansions in Recycled-feedstock Adipic-acid Facilities
The EU's Ecodesign for Sustainable Products Regulation sets minimum recycled-content thresholds, driving investments in nylon 6,6 depolymerization plants using nitric acid hydrolysis. China's 14th Five-Year Plan aims for 20% recycled content in engineering plastics by 2025, positioning the Asia-Pacific region to lead in the production of chemically recycled adipic acid. A recycling plant with significant capacity would require a notable amount of nitric acid annually, significantly impacting regional balances. DNV highlights that only a limited portion of the announced clean-ammonia capacity by 2030 is earmarked for fertilizers, suggesting a potential feedstock crunch for additional nitric units unless long-term contracts are in place.
Increasing Demand from Explosives Manufacturing
By FY 2026-27, India plans to boost its technical ammonium nitrate capacity significantly. This expansion will necessitate an additional supply of concentrated nitric acid. BCGCL’s gasification complex in Odisha is set to contribute substantially to TAN production annually, alongside an integrated nitric acid production line. As Indonesia capitalizes on its nickel surge and Africa eyes its gold and platinum ventures, the demand is evident; Orica noted an uptick in Asia-Pacific volumes for FY 2024, driven by mining needs. Adhering to ISO 13763 purity standards, the industry is anchored to high-grade acid, making substitutions less viable.
Restraints Impact Analysis
| Restraints | (~) % Impact on CAGR Forecast | Geographic Relevance | Impact Timeline |
|---|---|---|---|
| Volatile natural-gas prices squeezing ammonia-nitric margins | -0.4% | Europe, North America, with moderate impact in South Asia | Short term (≤ 2 years) |
| Ruthenium catalyst supply risk for N₂O abatement systems | -0.2% | Global, acute in Europe due to EU-ETS mandates | Medium term (2-4 years) |
| Emerging electro-nitrate routes bypassing conventional nitric acid | -0.1% | North America and Europe pilot projects, Asia-Pacific research and development | Long term (≥ 4 years) |
| Source: Mordor Intelligence | |||
Volatile Natural-gas Prices Squeezing Ammonia-nitric Margins
Ammonia synthesis consumes significant amounts of gas per ton, with feedstock accounting for the majority of cash costs. In Q4 2024, European plants operated at reduced utilization levels, with gas prices significantly higher than in the U.S., squeezing margins. CF Industries hedged a portion of its 2025 gas, securing higher gross margins at its Donaldsonville plant compared to much lower margins in Europe. With gas markets in flux, regions facing high costs might either curtail capacity or pivot to importing blue/green ammonia to avoid negative spreads.
Ruthenium Catalyst Supply Risk for N₂O Abatement Systems
Under EU-ETS Phase IV, nitric plants must reduce N₂O emissions to below a specific threshold per ton of acid, prompting installation of tertiary destruction units. Ruthenium-based catalysts deliver high efficiency but rely on a metal with a limited annual supply, primarily sourced from South Africa and Russia. Catalyst replacement every 18-24 months raises OPEX, and geopolitical disruption could stall compliance, exposing plants to allowance purchases at elevated costs.
Segment Analysis
By Concentration: Weak Acid Anchors Volume, Concentrated Grades Accelerate
In 2025, weak nitric acid commanded a 58.18% share of the nitric acid market, as integrated fertilizer complexes leaned towards a 50-60% strength for controlled neutralization. Meanwhile, concentrated grades, ranging from 68% to 98%, are projected to outpace the overall nitric acid market, growing at a 3.64% CAGR. This surge is driven by the demands of adipic acid, technical ammonium nitrate, and recycling routes, all of which prioritize higher purity and reduced water content.
The uptick in concentrated acid demand is fueled by automotive lightweighting, mandates for nylon-66 chemical recycling, and stringent quality standards for explosives. With India’s TAN expansions and Invista’s operations in the U.S. for adipic acid, the combined efforts hint at a demand surge. While fuming nitric acid has carved out a niche—primarily in hypergolic propellants and semiconductor wet etching—it stands poised for broader adoption. This potential surge hinges on the commercial scaling of NASA’s AF-M315E monopropellant for satellite fleets.
Note: Segment shares of all individual segments available upon report purchase
Get Detailed Market Forecasts at the Most Granular Levels
Download PDF
By End-user Industry: Fertilizers Dominate, Explosives Race Ahead
In 2025, fertilizers dominated the nitric acid market at 70.18% share, driven by the pivotal roles of ammonium nitrate and urea ammonium nitrate in cereal and oilseed cultivation. Meanwhile, explosives, currently holding a small market share, are the sector's fastest-growing segment at 3.97% CAGR, fueled by demand from coal, nickel, and precious-metal mining across Asia-Pacific and Africa.
Chemical manufacturing, encompassing products like adipic acid, TDI, and nitrobenzene, is witnessing a dichotomy: while European closures of adipic acid plants have curtailed regional consumption, the Asia-Pacific region is ramping up its cost-advantaged production capacity. The aerospace sector and pigment production, though representing a smaller share of the market, command premium prices; for instance, inhibited red fuming nitric acid fetches significantly higher prices compared to fertilizer acid.
Note: Segment shares of all individual segments available upon report purchase
Get Detailed Market Forecasts at the Most Granular Levels
Download PDF
Geography Analysis
Asia-Pacific dominated the nitric acid market with 59.01% volume in 2025 and is projected to grow at a 3.81% CAGR through 2031. This growth is bolstered by green-ammonia initiatives in China and a surge in explosive capacities in India. A GST reduction in India in September 2025 led to a significant drop in export prices, enhancing competitiveness across South Asia. Additionally, South Korea's Yeosu plant provides flexible options for chemical producers in Northeast Asia.
Europe grapples with elevated gas prices and carbon compliance challenges. While the CBAM initiative redirects imports from Russia and Belarus to domestic low-carbon alternatives, profit margins remain tight, leading to underutilization. Yara has unveiled a green-ammonia venture in Sluiskil, eyeing a 2028 launch to mitigate feedstock risks and capitalize on decarbonization incentives.
North America reaps benefits from its feedstock advantages. CF Industries’ facility in Donaldsonville churned out ammonia in the initial three quarters of 2024, boasting industry-leading profit margins. Meanwhile, blue-ammonia CCS initiatives are poised to furnish low-carbon nitric acid feedstock for CBAM markets. The Middle East is emerging as a key export center, with NEOM and Qatar Ammonia 7 eyeing 2026 inaugurations. In South America, demand is on the rise; Brazil set a record by importing fertilizers in 2024. This surge has spurred ATOME to target a 2027 launch for its green CAN project in Paraguay.
Get Analysis on Important Geographic Markets
Download PDF
Competitive Landscape
The global nitric acid market remains moderately fragmented. Start-ups are piloting ambient-pressure electro-nitrate routes that could undercut conventional acid in specialty niches within 5-7 years. Regional challengers are leveraging cost or proximity advantages: LSB Industries exploits cheap U.S. gas for explosives-grade acid, Hanwha’s new Yeosu unit balances Northeast Asian deficits, and ENAEX taps Chile’s copper belt. ISO 13763 purity norms fortify incumbents with established QA systems, impeding low-grade entrants.
Nitric Acid Industry Leaders
Yara
CF Industries Holdings, Inc.
OCI Global
BASF
EuroChem Group
- *Disclaimer: Major Players sorted in no particular order
Need More Details on Market Players and Competitors?
Download PDF
Recent Industry Developments
- March 2025: Gujarat Narmada Valley Fertilizers & Chemicals Ltd awarded thyssenkrupp Udhe India a contract for a 600 MTPD weak nitric acid plant, raising company capacity by 57% and supporting domestic Make in India initiatives.
- November 2024: UBE Corporation announced an expansion of high-purity nitric acid capacity at its Ube Chemical Factory to meet semiconductor and specialty polymer demand.
Global Nitric Acid Market Report Scope
Nitric acid is a colorless, highly corrosive mineral acid with the chemical formula HNO3. It can be produced through a two-step process, including the oxidation of ammonia and the absorption of nitrogen oxides produced. Nitric acid has major applications in the fertilizer industry.
The nitric acid market is segmented by concentration, end-user industry, and geography. By concentration, the market is segmented into Weak Nitric Acid, Concentrated Nitric Acid, and Fuming/Red Fuming. By end-user industry, the market is segmented into Fertilizers, Chemical Manufacturing, Explosives, Aerospace, Inks, Pigments, and Dyes, and Other Industries (Pharmaceuticals and Food Processing). The report also covers the market size and forecasts for the nitric acid market in 27 countries across the major regions. For each segment, the market sizing and forecasts have been done based on volume (Tons).
By Concentration
| Weak Nitric Acid (less than or equal to 68%) |
| Concentrated Nitric Acid (68 to 98%) |
| Fuming/Red Fuming (more than 98%) |
By End-user Industry
| Fertilisers |
| Chemical Manufacturing |
| Explosives |
| Aerospace |
| Inks, Pigments and Dyes |
| Other End-user Industries (Pharmaceuticals and Food Processing) |
By Geography
| Asia-Pacific | China |
| India | |
| Japan | |
| South Korea | |
| Indonesia | |
| Malaysia | |
| Vietnam | |
| Thailand | |
| Rest of Asia-Pacific | |
| North America | United States |
| Canada | |
| Mexico | |
| Europe | Germany |
| United Kingdom | |
| France | |
| Italy | |
| Spain | |
| Russia | |
| Turkey | |
| Nordic | |
| Rest of Europe | |
| South America | Brazil |
| Argentina | |
| Colombia | |
| Rest of South America | |
| Middle-East and Africa | Saudi Arabia |
| United Arab Emirates | |
| Qatar | |
| Nigeria | |
| Egypt | |
| South Africa | |
| Rest of Middle-East and Africa |
| By Concentration | Weak Nitric Acid (less than or equal to 68%) | |
| Concentrated Nitric Acid (68 to 98%) | ||
| Fuming/Red Fuming (more than 98%) | ||
| By End-user Industry | Fertilisers | |
| Chemical Manufacturing | ||
| Explosives | ||
| Aerospace | ||
| Inks, Pigments and Dyes | ||
| Other End-user Industries (Pharmaceuticals and Food Processing) | ||
| By Geography | Asia-Pacific | China |
| India | ||
| Japan | ||
| South Korea | ||
| Indonesia | ||
| Malaysia | ||
| Vietnam | ||
| Thailand | ||
| Rest of Asia-Pacific | ||
| North America | United States | |
| Canada | ||
| Mexico | ||
| Europe | Germany | |
| United Kingdom | ||
| France | ||
| Italy | ||
| Spain | ||
| Russia | ||
| Turkey | ||
| Nordic | ||
| Rest of Europe | ||
| South America | Brazil | |
| Argentina | ||
| Colombia | ||
| Rest of South America | ||
| Middle-East and Africa | Saudi Arabia | |
| United Arab Emirates | ||
| Qatar | ||
| Nigeria | ||
| Egypt | ||
| South Africa | ||
| Rest of Middle-East and Africa | ||
Need A Different Region or Segment?
Customize Now
Key Questions Answered in the Report
What is the projected global demand for nitric acid by 2031?
Volume is forecast to reach 83.48 million tons, up from 71.39 million tons in 2026, registering a 3.18% CAGR in the period.
Which region will contribute the largest share of new nitric acid capacity over the next five years?
Asia-Pacific, led by China’s green-ammonia builds, India’s technical ammonium-nitrate projects, and South Korea’s Yeosu expansion.
How are European carbon policies shaping producer strategies?
CBAM and EU-ETS penalties for embedded emissions are steering producers toward green or blue ammonia feedstock and incentivizing N₂O abatement investments.
Why is concentrated nitric acid growing faster than a weak acid?
Automotive lightweighting, nylon-66 chemical recycling, and higher-purity requirements for explosives drive stronger demand for 68-98% grades.


