Market Overview
| Study Period | 2017 - 2030 |
|---|---|
| Base Year For Estimation | 2024 |
| Forecast Data Period | 2025 - 2030 |
| Market Size (2025) | USD 9.73 Billion |
| Market Size (2030) | USD 15.71 Billion |
| Growth Rate (2025 - 2030) | 10.05% CAGR |
| Market Concentration | Low |
Major Players*Disclaimer: Major Players sorted in no particular order Image © Mordor Intelligence. Reuse requires attribution under CC BY 4.0. |
|

Protein Bar Market Analysis by Mordor Intelligence
The Protein Bar Market size is estimated at 9.73 billion USD in 2025, and is expected to reach 15.71 billion USD by 2030, growing at a CAGR of 10.05% during the forecast period (2025-2030).
The protein bar industry is experiencing significant transformation driven by the global fitness movement and expanding retail infrastructure. Major retail chains are aggressively expanding their presence to meet growing consumer demand, with industry leaders like Lidl operating approximately 11,200 outlets, Aldi Süd maintaining 7,200 stores, and Penny Market running 3,600 locations as of 2022. This retail expansion has made protein bars more accessible to consumers across various demographics. The increasing health consciousness among consumers has led to a surge in gym memberships and fitness activities, with approximately 49.9% of Americans reported visiting gyms at least twice weekly in 2022, indicating a strong correlation between fitness engagement and protein bar consumption.
The distribution landscape for protein bars continues to evolve with the integration of multiple retail channels. Convenience stores are strategically positioning themselves in high-traffic locations such as urban centers, gas stations, and busy intersections, enabling spontaneous purchases and catering to on-the-go consumption patterns. The rise of digital commerce has revolutionized purchasing behaviors, with online retailers leveraging advanced technologies and extensive delivery networks to provide convenient shopping experiences. This shift is particularly evident in the growing preference for mobile shopping and subscription-based purchasing models for regular protein bar sales.
Product innovation in the protein bar segment is increasingly focused on addressing specific consumer needs and preferences. Manufacturers are developing specialized variants targeting different consumer segments, including energy-boosting bars for athletes, meal replacement options for busy professionals, and sleep-support formulations for health-conscious consumers. The industry has witnessed a significant shift toward clean-label products, with brands emphasizing natural ingredients, reduced sugar content, and enhanced nutritional profiles. The fitness industry's growth in emerging markets is particularly noteworthy, with Brazil alone reporting 539,710 physical education professionals and 65,665 registered fitness establishments in 2022, indicating a robust ecosystem supporting protein bar consumption.
Regional market dynamics reflect varying levels of market maturity and consumer preferences. The Asia-Pacific region demonstrates remarkable potential, particularly in China, where the number of fitness centers increased from 128,900 in 2021 to 142,900 in 2022, indicating growing health awareness and potential for protein bar market growth. The industry is witnessing increased localization of flavors and formulations to cater to regional tastes, while maintaining international quality standards. Supermarket chains are expanding their protein bar sections, offering diverse options ranging from global brands to local alternatives, thereby creating a competitive retail environment that benefits both consumers and manufacturers.
Global Protein Bar Market Trends and Insights
There is a rising demand for protein-enriched bars by consumers indulging in different sports and fitness activities
- Across the globe, protein bars are highly preferred by Gen Z consumers as a replacement for oil-based snacks. The North American market is the largest market for protein bars in the world. In 2023, Americans were consuming snack bars as a grab-and-go convenience food.
- In the protein bar segment, brand loyalty acquires the first position under product attributes. In the global protein bar market, it was observed that 43% of consumers choose protein bars from their preferred brands. Crunch Plus, Nature Valley, One, ProBar, and MxBar are some brands that hold higher shares in the market.
- In 2023, protein bars witnessed a hike in their sales. The sales growth was linked to the healthy eating habits of consumers. Economic crises such as the COVID-19 pandemic promoted the sales of snack bars by highlighting their benefits and replacing oily stuffed snacks with healthy snack bars. In 2023, the price fluctuation of protein bars was valued at USD 2.34.
- Around the globe, the consumption of protein bars is generally viewed from a health perspective. The availability of protein bars in different flavors makes it a healthy snack among the different age groups. Around the globe, there are a few additional factors to consider in the context of protein bar consumption from a health perspective. About 70% of the global population prefers protein bars in their daily routine. One factor to consider is ingredient significance. Ingredients such as whole grain oats, vegetable oil, and dry fruits (almonds, raisins, cranberries, corn starch) are mainly affecting the product’s standards. As these ingredients provide vitamins, energy, protein, minerals, calories, etc., these are considered some of the key ingredients by the population.
Understand The Key Trends Shaping This Market
Download PDF
OTHER KEY INDUSTRY TRENDS COVERED IN THE REPORT
- The rising demand for high protein sources is likely to promote the ongoing demand for protein bars
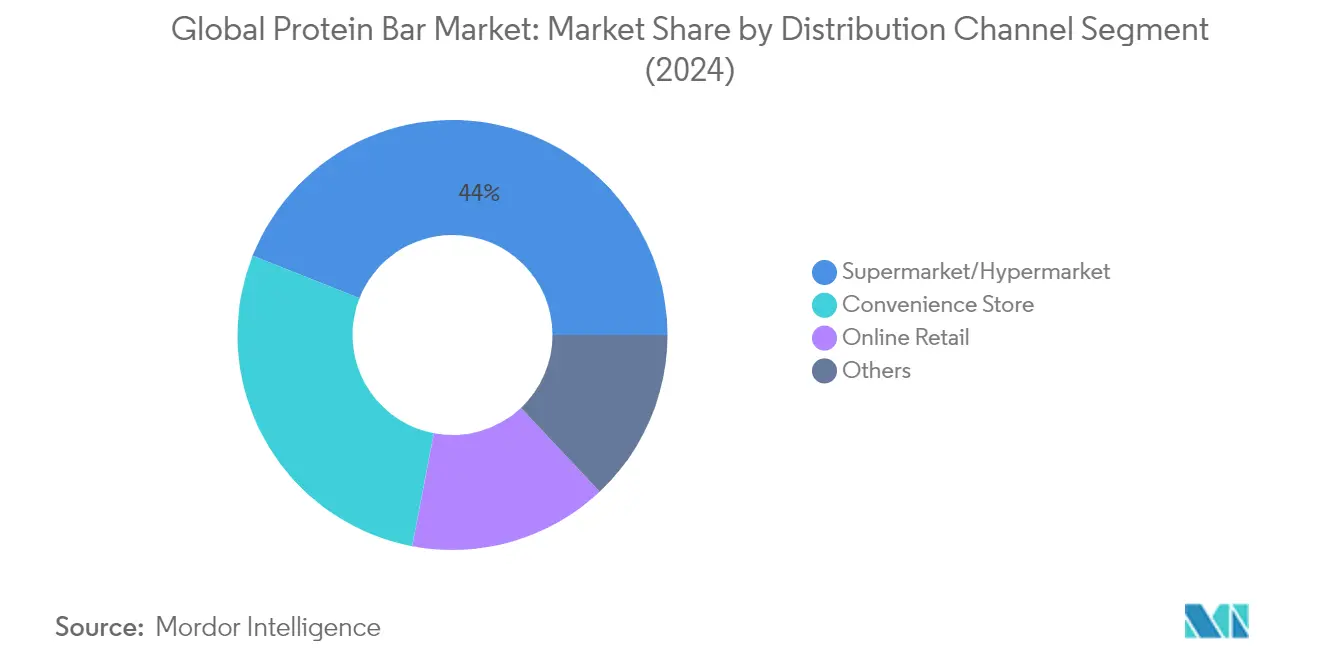
Segment Analysis: Distribution Channel
Supermarket/Hypermarket Segment in Global Protein Bar Market
The supermarket/hypermarket emerged as the dominant distribution channel in the global protein bar market, holding approximately 44% market share in 2024. The segment's leadership position is attributed to the extensive network of multinational retail chains, with major players like Lidl operating around 11,200 outlets and Aldi Süd with 7,200 outlets globally. These retail outlets typically stock a diverse selection of protein bar brands, flavors, and types, allowing consumers to choose from multiple options that suit their taste and dietary preferences. The strategic product positioning across dedicated shelves and checkout counters in these stores significantly influences impulse purchases among potential consumers. Additionally, supermarkets and hypermarkets offer competitive pricing and bulk purchase options, making them the preferred choice for cost-conscious consumers looking to stock up on protein bars.
Online Retail Store Segment in Global Protein Bar Market
The online retail channel demonstrates the most robust growth trajectory in the protein bar market, driven by increasing internet penetration, rising smartphone usage, and an expanding network of grocery delivery chains. The segment's growth is further accelerated by the convenience of one-click shopping platforms, which allow consumers to efficiently manage their shopping time for protein bars. Online retailers are strengthening their market position by offering larger product selection options, various discounts, hassle-free order cancellation/refund processes, and coupon codes to provide a seamless shopping experience. The channel's appeal is enhanced by the availability of detailed product information, customer reviews, and competitive pricing, making it increasingly popular among digitally savvy consumers seeking convenience and value in their protein bar purchases. This segment is particularly appealing to the protein bar target market, who prioritize convenience and variety.
Remaining Segments in Distribution Channel
The convenience store channel maintains a significant presence in the protein bar market, particularly benefiting from strategic locations in urban centers, gas stations, and busy intersections that enable quick, on-the-spot purchases. These stores focus on store designs and integrated technologies to enhance customer convenience while purchasing protein bars. The 'Others' category, encompassing warehouse club stores, vending machines, drug stores/pharmacies, and forecourt retailers, serves specific consumer needs through specialized distribution points. Vending machines, in particular, have gained prominence in public spaces such as airports, college campuses, shopping malls, and sports clubs, providing easy access to protein bars for on-the-go consumption. This diverse distribution network is crucial for protein bar suppliers and nutrition bar manufacturers aiming to reach the target market for protein bars effectively.
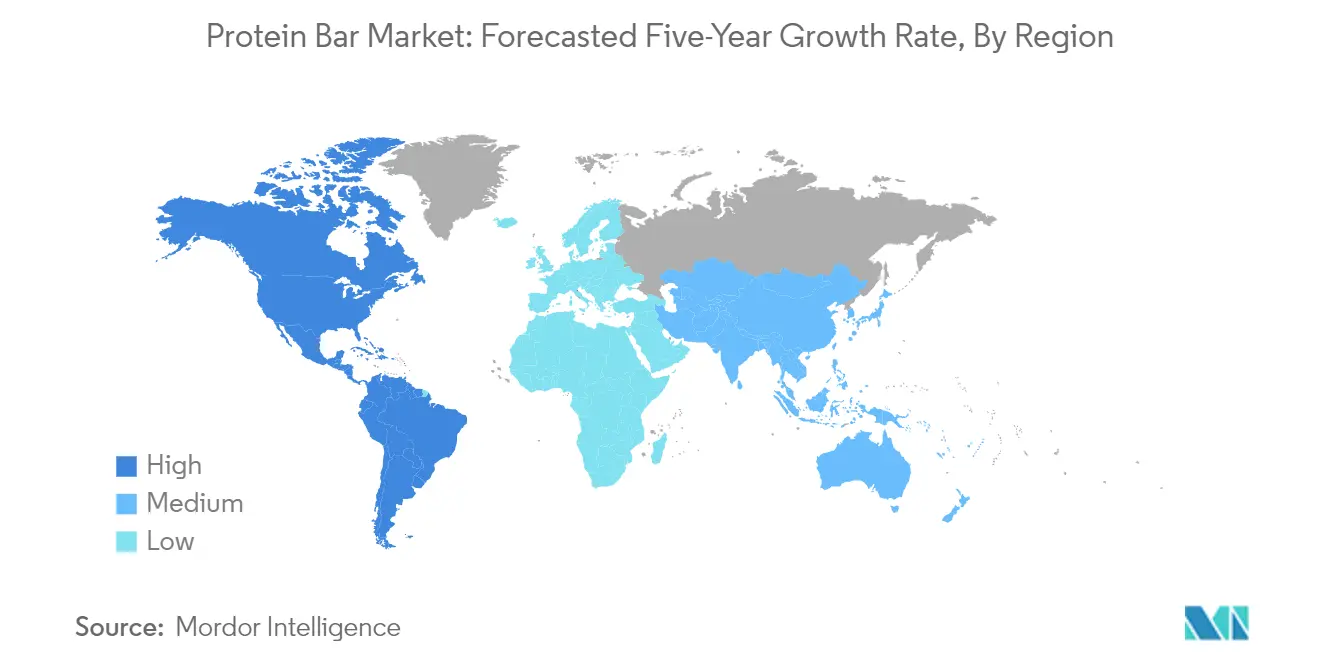
Protein Bar Market Geography Segment Analysis
Protein Bar Market in Africa
The African protein bar market demonstrates increasing consumer awareness regarding nutritional supplements and healthy snacking options. The region's market is primarily driven by South Africa, Nigeria, and Egypt, with varying levels of market penetration and consumer preferences. The growing fitness culture and increasing health consciousness among urban populations have contributed to the expanding market presence. Consumer education about protein supplementation and the importance of balanced nutrition has played a crucial role in market development across these African nations.
Protein Bar Market in South Africa
South Africa leads the African protein bar market, commanding approximately 35% of the region's market share in 2024. The country's dominance is attributed to its well-developed retail infrastructure and growing health and wellness sector. The presence of numerous fitness centers and health clubs has created a strong consumer base for protein bars. The country has witnessed significant growth in gym memberships, with over 2.26 million fitness and health club memberships recorded. South African consumers increasingly view protein bars as a convenient and healthy snacking option, particularly among urban professionals and fitness enthusiasts.
Protein Bar Market Growth Trajectory in South Africa
South Africa is projected to maintain its position as the fastest-growing market in Africa, with an anticipated growth rate of approximately 40% during 2024-2029. This exceptional growth is driven by increasing consumer awareness about healthy snacking alternatives and the rising popularity of protein-enriched products. The country's robust distribution networks, including both modern retail channels and online platforms, facilitate easy access to protein bars. The market expansion is further supported by innovative product launches featuring local flavors and ingredients, catering to diverse consumer preferences.
Protein Bar Market in Asia-Pacific
The Asia-Pacific protein bar market exhibits dynamic growth patterns across its diverse economies, including developed markets like Japan and Australia, and emerging markets like India and China. The region's market is characterized by increasing health consciousness, growing fitness trends, and rising disposable incomes. Countries like South Korea, Indonesia, and Malaysia are witnessing rapid market development due to urbanization and changing dietary preferences. The market is also influenced by the region's strong sports and athletics culture, particularly in countries like Australia and New Zealand.
Protein Bar Market in Japan
Japan dominates the Asia-Pacific protein bar market, holding approximately 40% of the regional market share in 2024. The country's leadership position is supported by its advanced retail infrastructure and strong health-conscious consumer base. Japanese consumers demonstrate a high acceptance of functional foods and nutritional supplements, with about 76% of consumers perceiving protein snacks as healthy. The market benefits from the presence of numerous health clubs and fitness centers, with over 8,500 fitness clubs operating across the country.
Protein Bar Market Growth Trajectory in South Korea
South Korea emerges as the fastest-growing market in the Asia-Pacific region, with an expected growth rate of approximately 9% during 2024-2029. The country's robust growth is driven by increasing health awareness and fitness trends among young consumers. South Korea's market expansion is supported by its well-developed retail infrastructure and strong presence of domestic and international brands. The presence of over 11,100 fitness centers has created a substantial consumer base for protein bars, while innovative product launches and marketing strategies continue to drive market growth.
Protein Bar Market in Europe
The European protein bar market demonstrates sophisticated consumer preferences and strong market penetration across multiple countries. The region encompasses diverse markets, including the United Kingdom, Germany, France, and emerging markets in Eastern Europe. Consumer awareness about health and nutrition is particularly high in Western European countries, driving demand for protein-enriched snacks. The market benefits from well-established distribution networks and a strong presence of both local and international manufacturers.
Protein Bar Market in United Kingdom
The United Kingdom leads the European protein bar market, with its dominance attributed to high consumer awareness and a strong fitness culture. The country's market is characterized by sophisticated consumer preferences and high penetration of protein bars in regular dietary habits. British consumers show a strong inclination towards functional foods, with protein bars being particularly popular among fitness enthusiasts and health-conscious individuals. The market benefits from a well-developed retail infrastructure and a strong presence of both domestic and international brands.
Protein Bar Market Growth Trajectory in Russia
Russia demonstrates the most dynamic growth in the European protein bar market, driven by increasing health consciousness and growing fitness trends. The market expansion is supported by the rising number of fitness enthusiasts and growing awareness about protein supplementation. The country's retail landscape continues to evolve, with both modern trade and online channels contributing to market growth. Russian consumers increasingly view protein bars as a convenient and healthy snacking option, particularly in urban areas.
Protein Bar Market in Middle East
The Middle Eastern protein bar market shows strong growth potential across various countries, including Saudi Arabia, UAE, Kuwait, Bahrain, Oman, and Qatar. The region's market is driven by increasing health consciousness and growing fitness trends among the younger population. Saudi Arabia leads the regional market, benefiting from its large population and well-developed retail infrastructure. The UAE emerges as the fastest-growing market, supported by its strong fitness culture and high consumer awareness about nutritional supplements. The region's market is characterized by premium product preferences and a strong presence of international brands.
Protein Bar Market in North America
The North American protein bar market demonstrates mature market characteristics with a strong presence across the United States, Canada, and Mexico. The region shows sophisticated consumer preferences and high awareness about nutritional supplements. The United States dominates the regional market, leveraging its extensive retail network and strong fitness culture. Mexico emerges as the fastest-growing market, driven by increasing health consciousness and growing fitness trends. The region's market benefits from continuous product innovations and strong marketing initiatives by both established and emerging brands.
Protein Bar Market in South America
The South American protein bar market shows significant growth potential, with Brazil and Argentina leading the regional development. The market is characterized by increasing health awareness and growing fitness trends across major urban centers. Brazil maintains its position as the largest market in the region, supported by its extensive retail network and large consumer base. Argentina demonstrates the fastest growth trajectory, driven by changing consumer preferences and increasing health consciousness. The region's market is marked by growing penetration of international brands and rising local manufacturing capabilities.
Get Analysis on Important Geographic Markets
Download PDF
Competitive Landscape
Top Companies in Protein Bar Market
The protein bar companies market is characterized by intense competition and continuous innovation among major players like Kellogg Company, Simply Good Foods, Glanbia, Mars, PepsiCo, and General Mills. Companies are heavily focused on product innovation through the introduction of new flavors, protein content variations, and specialized offerings like keto-friendly and plant-based options to meet evolving consumer preferences. Operational agility is demonstrated through strategic manufacturing facility expansions and supply chain optimizations to meet growing demand. Strategic moves in the industry primarily revolve around mergers and acquisitions to strengthen market position and expand product portfolios, exemplified by major acquisitions like Simply Good Foods' purchase of Quest Nutrition and Mars' acquisition of Kind Bars. Companies are also expanding their distribution networks across various channels, including supermarkets, convenience stores, and online platforms, while investing in direct-to-consumer capabilities.
Market Dominated by Global Food Conglomerates
The protein bar market structure is characterized by the strong presence of large multinational food and beverage conglomerates who leverage their extensive distribution networks, research capabilities, and marketing resources to maintain market leadership. These established players benefit from economies of scale in production and procurement, while also possessing the financial strength to acquire promising smaller brands to expand their portfolio. The market shows moderate consolidation with the top players controlling significant market share, though there is still room for specialized players focusing on specific consumer segments or regional markets.
The competitive landscape is evolving through strategic acquisitions and partnerships, as larger companies seek to quickly enter new market segments and gain access to innovative products and technologies. Regional players are increasingly forming partnerships with global companies to expand their reach, while some specialized manufacturers are focusing on direct-to-consumer channels to build brand loyalty. The industry also sees continuous entry of new players, particularly in the premium and specialized segments, though scaling up remains a challenge due to the established distribution networks of major protein bar companies.
Innovation and Distribution Key to Growth
Success in the protein bar market increasingly depends on companies' ability to innovate across product formulation, packaging, and marketing while maintaining strong distribution relationships. Incumbents need to focus on continuous product innovation to meet evolving consumer preferences for healthier, cleaner label products while maintaining taste and texture quality. Companies must also invest in sustainable packaging solutions and digital marketing capabilities to appeal to environmentally conscious consumers and younger demographics. Building strong relationships with retailers and expanding presence across multiple distribution channels, including e-commerce, is crucial for maintaining market share.
For contenders looking to gain ground, focusing on specialized market segments and unique value propositions offers the best path forward. This includes developing products for specific dietary requirements or lifestyle choices, such as plant-based or keto-friendly options. Success also requires building direct relationships with consumers through social media engagement and wellness community building. Companies must stay ahead of potential regulatory changes regarding nutritional claims and labeling requirements, while also managing substitution risks from other protein-rich snack alternatives. Investment in research and development capabilities and maintaining flexible manufacturing processes will be crucial for adapting to changing consumer preferences and regulatory requirements. Additionally, understanding revenue statistics for bars and leveraging branding strategies for protein bars are essential for companies aiming to differentiate themselves in a crowded market.
Protein Bar Industry Leaders
-
Glanbia Plc
-
Kellogg Company
-
Mars Incorporated
-
PepsiCo Inc.
-
Simply Good Foods Co.
- *Disclaimer: Major Players sorted in no particular order

Need More Details on Market Players and Competitors?
Download PDF
Recent Industry Developments
- May 2023: General Mills Inc. announced that it would be expanding its Nature Valley brand with the introduction of Nature Valley Savory Nut Crunch Bars.
- April 2023: Under the brand ONE Brands, The Hershey Company launched the Peanut Butter & Jelly Flavored Protein Bar. The ONE Limited Edition Peanut Butter & Jelly flavored bars are packed with 20 grams of protein, 1 gram of sugar, and the taste of peanut butter and strawberry jelly flavors.
- January 2023: The Hershey Company launched caffeinated protein bars. The range is available in two flavors: vanilla latte and caramel macchiato.
Global Protein Bar Market Report Scope
Convenience Store, Online Retail Store, Supermarket/Hypermarket, Others are covered as segments by Distribution Channel. Africa, Asia-Pacific, Europe, Middle East, North America, South America are covered as segments by Region.
Distribution Channel
| Convenience Store |
| Online Retail Store |
| Supermarket/Hypermarket |
| Others |
Region
| Africa | By Country | Egypt |
| Nigeria | ||
| South Africa | ||
| Rest of Africa | ||
| Asia-Pacific | By Country | Australia |
| China | ||
| India | ||
| Indonesia | ||
| Japan | ||
| Malaysia | ||
| New Zealand | ||
| South Korea | ||
| Rest of Asia-Pacific | ||
| Europe | By Country | Belgium |
| France | ||
| Germany | ||
| Italy | ||
| Netherlands | ||
| Russia | ||
| Spain | ||
| Switzerland | ||
| Turkey | ||
| United Kingdom | ||
| Rest of Europe | ||
| Middle East | By Country | Bahrain |
| Kuwait | ||
| Oman | ||
| Qatar | ||
| Saudi Arabia | ||
| United Arab Emirates | ||
| Rest of Middle East | ||
| North America | By Country | Canada |
| Mexico | ||
| United States | ||
| Rest of North America | ||
| South America | By Country | Argentina |
| Brazil | ||
| Rest of South America |
| Distribution Channel | Convenience Store | ||
| Online Retail Store | |||
| Supermarket/Hypermarket | |||
| Others | |||
| Region | Africa | By Country | Egypt |
| Nigeria | |||
| South Africa | |||
| Rest of Africa | |||
| Asia-Pacific | By Country | Australia | |
| China | |||
| India | |||
| Indonesia | |||
| Japan | |||
| Malaysia | |||
| New Zealand | |||
| South Korea | |||
| Rest of Asia-Pacific | |||
| Europe | By Country | Belgium | |
| France | |||
| Germany | |||
| Italy | |||
| Netherlands | |||
| Russia | |||
| Spain | |||
| Switzerland | |||
| Turkey | |||
| United Kingdom | |||
| Rest of Europe | |||
| Middle East | By Country | Bahrain | |
| Kuwait | |||
| Oman | |||
| Qatar | |||
| Saudi Arabia | |||
| United Arab Emirates | |||
| Rest of Middle East | |||
| North America | By Country | Canada | |
| Mexico | |||
| United States | |||
| Rest of North America | |||
| South America | By Country | Argentina | |
| Brazil | |||
| Rest of South America | |||
Need A Different Region or Segment?
Customize Now
Market Definition
- Milk and White Chocolate - Milk chocolates is a solid chocolate made with milk (in the form of either milk powder, liquid milk, or condensed milk) and cocoa solids. White chocolate is made from cocoa butter and milk and contains no cocoa solids whatsoever. The scope includes regular chocolates, low-sugar, and sugar-free variants
- Toffees & Nougats - Toffees include hard, chewy, and small or one-bite candies marketed with labels as toffee or toffee-like confectionery. Nougat is a chewy confection with almond, sugar, and egg white as a basic ingredient; and it originated in Europe and Middle East countries.
- Cereals Bars - A snack composed of breakfast cereal that has been compressed into a bar shape and is held together with a form of edible adhesive. The scope includes snack bars made with cereals such as rice, oats, corn, etc. mixed with a binding syrup. These also include products labeled as cereal bars, cereal treat bars, or grain bars.
- Chewing Gum - This is a preparation for chewing, usually made of flavored and sweetened chicle or such substitutes as polyvinyl acetate. The types of chewing gums included in the scope are sugar-chewing gums and sugar-free chewing gums
| Keyword | Definition |
|---|---|
| Dark Chocolate | Dark chocolate is a form of chocolate containing cocoa solids and cocoa butter without the milk. |
| White Chocolate | White chocolate is the type of chocolate containing the highest percentage of milk solids, typically around or over 30 percent. |
| Milk Chocolate | Milk chocolate is made from dark chocolate that has a low cocoa solid content and higher sugar content, plus a milk product. |
| Hard Candy | A candy made of sugar and corn syrup boiled without crystallizing. |
| Toffees | A hard, chewy, often brown sweet that is made from sugar boiled with butter. |
| Nougats | A chewy or brittle candy containing almonds or other nuts and sometimes fruit. |
| Cereal bar | A cereal bar is a bar-shaped food product, made by pressing cereals and usually dried fruit or berries, which are in most cases held together by glucose syrup. |
| Protein bar | Protein bars are nutrition bars that contain a high proportion of protein to carbohydrates/fats. |
| Fruit & Nut bar | These are often based on dates with other dried fruit and nut additions and, in some cases, flavorings. |
| NCA | The National Confectioners Association is an American trade organization that promotes chocolate, candy, gum and mints, and the companies that make these treats. |
| CGMP | Current good manufacturing practices are those conforming to the guidelines recommended by relevant agencies. |
| Unstandardized foods | Unstandardized foods are those that do not have a standard of identity or that deviate from a prescribed standard in any manner. |
| GI | The glycemic index (GI) is a way of ranking carbohydrate-containing foods based on how slowly or quickly they are digested and increase blood glucose levels over a period of time |
| Skimmed milk powder | Skimmed milk powder is obtained by removing water from pasteurized skim milk by spray-drying. |
| Flavanols | Flavanols are a group of compounds found in cocoa, tea, apples, and many other plant-based foods and beverages. |
| WPC | Whey protein concentrate- the substance obtained by the removal of sufficient nonprotein constituents from pasteurized whey so that the finished dry product contains greater than 25% protein. |
| LDL | Low density Lipoprotein- the bad cholesterol |
| HDL | High density Lipoprotein- the good cholesterol |
| BHT | butylated Hydroxytoluene is a lab-made chemical that is added to foods as a preservative. |
| Carrageenan | Carrageenan is an additive used to thicken, emulsify, and preserve foods and drinks. |
| Free form | Not containing certain ingredients, such as gluten, dairy, or sugar. |
| Cocoa butter | It is a fatty substance obtained from cocoa beans, used in the manufacture of confectionery. |
| Pastellies | A type of of Brazilian candy made from sugar, eggs, and milk. |
| Draggees | Small, round candies that are coated with a hard sugar shell |
| CHOPRABISCO | Royal Belgian Association of the chocolate, pralines, biscuit, and confectionery industry- A trade association that represents the Belgian chocolate industry. |
| European Directive 2000/13 | A European Union directive that regulates the labeling of food products |
| Kakao-Verordnung | The German chocolate ordinance, a set of regulations that define what can be labeled as "chocolate" in Germany. |
| FASFC | Federal Agency for the Safety of the Food Chain |
| Pectin | A natural substance that is derived from fruits and vegetables. It is used in confectionery to create a gel-like texture. |
| Invert sugars | A type of sugar that is made up of glucose and fructose. |
| Emulsifier | A substance that helps to mix to liquids that does not mix together. |
| Anthocyanins | A type of flavonoid that is responsible for the red, purple, and blue colors of confectionery. |
| Functional Foods | Foods that have been modified to provide additional health benefits beyond basic nutrition. |
| Kosher certificate | This certification verifies that the ingredients, production process including all machinery, and/or food-service process complies with the standards of Jewish dietary law |
| Chicory root extract | A natural extract from the chicory root that is a good source of fiber, calcium, phosphorous, and folate |
| RDD | Recommended daily dose |
| Gummies | A chewy gelatin-based candy that is often flavored with fruit. |
| Nutraceuticals | Food or dietary supplements that are claimed to have health benefits. |
| Energy bars | Snack bars that are high in carbohydrates and calories are designed to provide energy on the go. |
| BFSO | Belgian Food Safety Organization for the food chain. |
Need More Details on Market Definition?
Ask a Question
Research Methodology
Mordor Intelligence follows a four-step methodology in all our reports.
- Step-1: Identify Key Variables: In order to build a robust forecasting methodology, the variables and factors identified in Step 1 are tested against available historical market numbers. Through an iterative process, the variables required for market forecast are set, and the model is built on the basis of these variables.
- Step-2: Build a Market Model: Market-size estimations for the forecast years are in nominal terms. Inflation is not a part of the pricing, and the average selling price (ASP) is kept constant throughout the forecast period for each country.
- Step-3: Validate and Finalize: In this important step, all market numbers, variables, and analyst calls are validated through an extensive network of primary research experts from the market studied. The respondents are selected across levels and functions to generate a holistic picture of the market studied.
- Step-4: Research Outputs: Syndicated Reports, Custom Consulting Assignments, Databases & Subscription Platforms

Get More Details On Research Methodology
Download PDF


