Market Overview
| Study Period | 2021 - 2031 |
|---|---|
| Forecast Data Period | 2026 - 2031 |
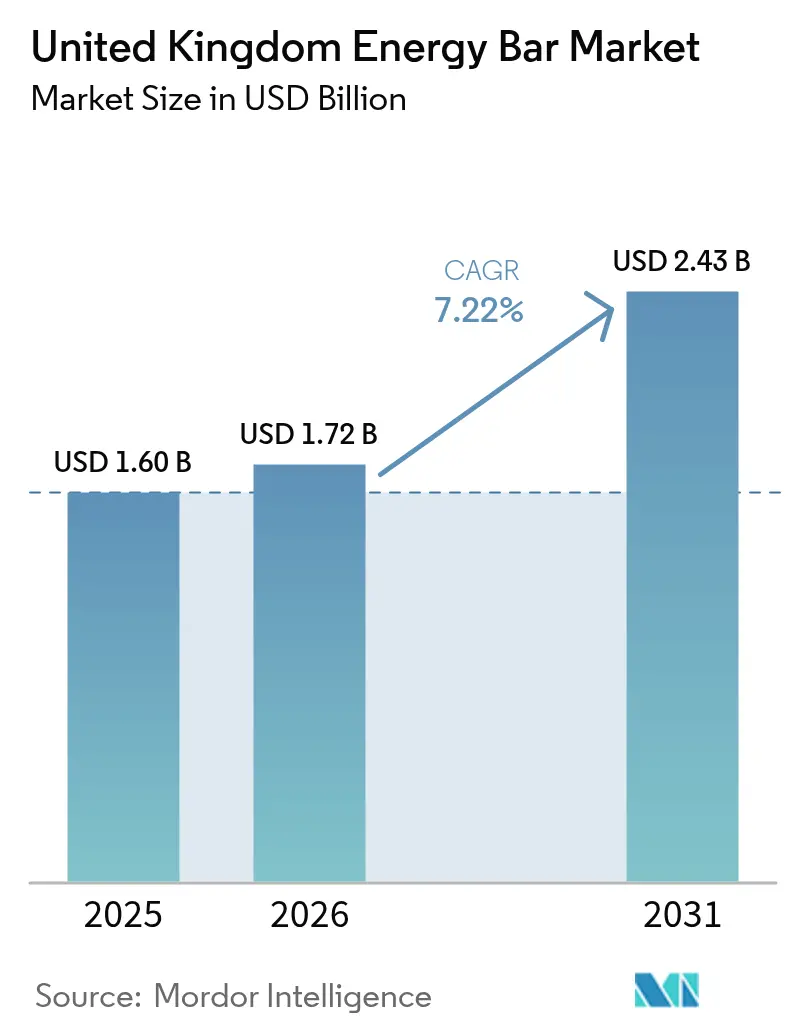
| Base Year Market Size (2025) | USD 1.6 Billion |
| Market Size (2026) | USD 1.72 Billion |
| Market Size (2031) | USD 2.43 Billion |
| Growth Rate (2026 - 2031) | 7.22% CAGR |
| Market Concentration | Medium |
Major Players *Disclaimer: Major Players sorted in no particular order Image © Mordor Intelligence. Reuse requires attribution under CC BY 4.0. | |
United Kingdom Energy Bar Market Analysis by Mordor Intelligence
The UK energy bar market size is expected to grow from USD 1.6 billion in 2025 to USD 1.72 billion in 2026 and is forecast to reach USD 2.43 billion by 2031 at 7.22% CAGR over 2026-2031. Demand accelerates as HFSS legislation rewards low-sugar formulations, while a 16.9% national gym membership rate channels sports-nutrition habits into everyday snacking. Competitive rivalry intensifies as multinational food groups acquire specialist brands to secure compliant product pipelines and hedge against volatile cocoa and nut costs[1]Browne Jacobson, “Update on HFSS Regulations,” brownejacobson.com. Digital-first business models and subscription bundles deepen consumer engagement, while sustainably sourced packaging gains momentum as the Plastic Packaging Tax rises to EUR 223.69 per tonne in 2025.
Key Report Takeaways
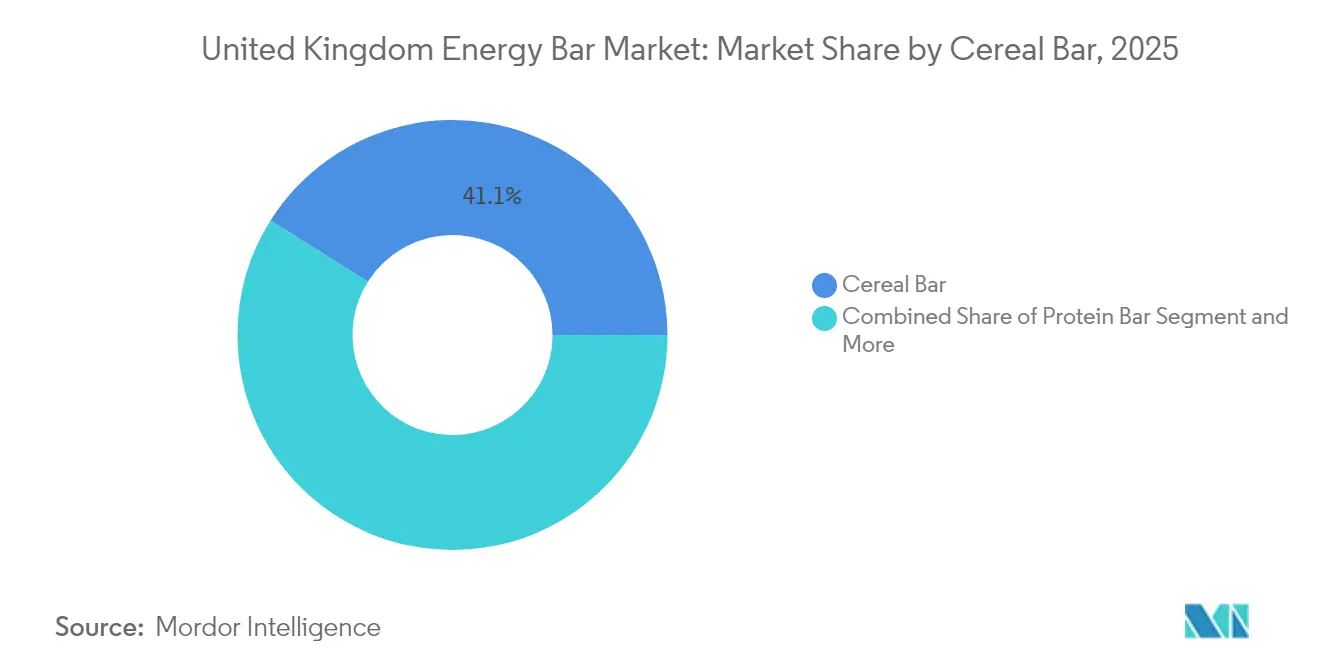
- By product type, cereal bars led with a 41.07% UK energy bar market share in 2025, and protein bars are projected to expand at a 7.44% CAGR through 2031.
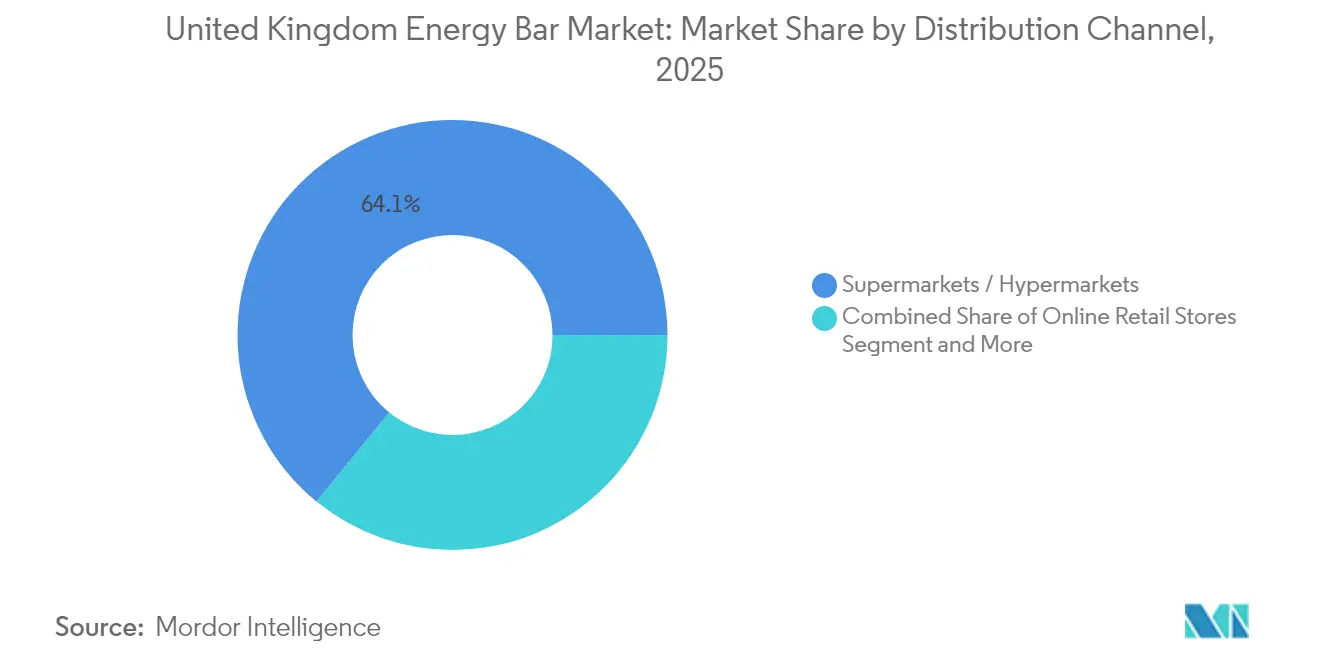
- By distribution channel, supermarkets and hypermarkets held 64.11% of the UK energy bar market size in 2025, and online retail is poised for a 9.11% CAGR through 2031.
Note: Market size and forecast figures in this report are generated using Mordor Intelligence’s proprietary estimation framework, updated with the latest available data and insights as of 2026.
United Kingdom Energy Bar Market Trends and Insights
Drivers Impact Analysis*
| Driver | (~) % Impact on CAGR Forecast | Geographic Relevance | Impact Timeline |
|---|---|---|---|
| HFSS regulation accelerates demand for high-protein, low-sugar bars | +2.1% | England, Wales, Scotland, Northern Ireland | Short term (≤ 2 years) |
| On-the-go meal-replacement snacking culture | +1.8% | England core, spillover to Scotland, Wales | Medium term (2-4 years) |
| Growing sports & fitness participation | +1.5% | England, Scotland urban | Medium term (2-4 years) |
| Private-label price disruption in discounters | +1.3% | England, Scotland, Wales | Short term (≤ 2 years) |
| Creatine-infused multifunctional bars capture supplement spend | +0.9% | England, Scotland | Long term (≥ 4 years) |
| AI-driven D2C personalisation & subscription bundles | +0.8% | England, Scotland urban | Long term (≥ 4 years) |
| Source: Mordor Intelligence | |||
HFSS regulation accelerates demand for high-protein, low-sugar bars
HFSS curbs restrict non-compliant snacks from aisle-end and checkout displays, pushing manufacturers to reformulate energy bars so they score below 4 on the Nutrient Profiling Model[2]ISBA, “HFSS Advertising Restrictions Guidance,” isba.org.uk. Grenade and Trek have introduced naturally sweetened ranges boasting up to 47% sugar reduction yet maintaining sensory quality, preserving eligibility for both in-store promotions and post-2025 advertising. Formulators increasingly double protein content and add fibers or chicory-root inulin to improve satiety and glycaemic response. Brands also invest in high-intensity natural sweeteners such as stevia or monk-fruit to minimize total sugars without compromising taste. Ingredient suppliers report a double-digit rise in UK inquiries for soluble corn fiber, reflecting the rush to secure compliant bulking agents that support clean-label claims.
On-the-go meal-replacement snacking culture
Remote working and hybrid commuting patterns shorten lunch breaks, encouraging 70% of adults to purchase lunch outside the home at least occasionally[3]Food Standards Agency, “Eating Occasions Research,” food.gov.uk. Energy bars fit seamlessly into these new eating windows thanks to portability, portion control, and nutritional transparency. Brands target time-pressed Gen Z and millennial workers with “breakfast-to-desk” packs that bundle protein bars with ready-to-drink coffee. The growing popularity of high-protein breakfast biscuits signals further cross-category convergence that blurs lines between bars and bakery. Retailers capitalize by merchandising meal-replacement bars beside chilled smoothies, positioning the duo as a complete macro-balanced solution for commuters. Subscription platforms reinforce habitual consumption by auto-shipping thirty-count assortments calibrated to daily breakfast needs.
Growing sports & fitness participation
With 11.5 million gym memberships and sector revenue rising to GBP 5.7 billion in 2024, the UK fitness economy underpins regular usage occasions for performance-oriented bars6. Pre-workout consumers gravitate toward energy-dense bars featuring 3 g creatine and 200 mg caffeine, while recovery-focused users buy high-protein versions fortified with 3 g leucine. Partnerships between bar brands and fitness chains, such as Anytime Fitness stocking Grenade Carb Killa at reception desks, position products within arm’s reach of core users. E-commerce fitness retailers bundle bars with whey powder and shaker bottles to raise average order value. Activity-tracking apps integrate branded reward tokens redeemable for bars, stitching product trials into digital workout ecosystems.
Private-label price disruption in discounters
Discounters like Aldi and Lidl price their 15-g protein bars 25% below branded equivalents, driving a 9.4% value uplift in private-label snacking during 2024. Retailers leverage scale to secure long-term ingredient contracts, mitigating cocoa shocks and passing savings on to shoppers facing cost-of-living headwinds. Branded manufacturers respond by shrinking multipack sizes to hit key price points while preserving premium positioning through superior flavor and added vitamins. Some contract-manufacturers embrace a dual-supply model, producing both retailer exclusives and own brands, thereby hedging against cannibalization. The private-label advance presses leading players to intensify brand storytelling that emphasizes provenance, ethical sourcing, and functional superiority.
Restraints Impact Analysis*
| Restraint | (~) % Impact on CAGR Forecast | Geographic Relevance | Impact Timeline |
|---|---|---|---|
| Volatile nut & cocoa input costs | -1.7% | England, Scotland, Wales, Northern Ireland | Short term (≤ 2 years) |
| HFSS promotion & placement restrictions | -1.2% | England, Wales, Scotland, Northern Ireland | Medium term (2-4 years) |
| ‘Ultra-processed food’ backlash | -0.9% | England urban centers; Scotland & Wales emerging | Long term (≥ 4 years) |
| Plastic Packaging Tax & recycling-compliance costs | -0.6% | United Kingdom (nationwide) | Short term (≤ 2 years) |
| Source: Mordor Intelligence | |||
Volatile nut & cocoa input costs
Cocoa futures spiked to GBP 10,000 per tonne in April 2024, triple June 2023 levels, before stabilizing near GBP 7,600, squeezing gross margins on chocolate-coated bars. Almond and peanut markets face similar turbulence amid California droughts and Indian export levies. Brands with limited hedging capacity see unit costs rise 12% quarter-on-quarter, prompting either retail price hikes or reformulations that swap cocoa butter for palm kernel oil—steps that risk consumer backlash. Larger players diversify suppliers across West Africa, Latin America, and Southeast Asia while pre-buying inventory to lock in prices. Some launch SKUs featuring sunflower-seed or chickpea crisps to cut nut usage, retaining texture while moderating exposure to price swings.
HFSS promotion & placement restrictions
Since October 2022, HFSS items lost access to checkout and aisle-end displays, cutting impulse visibility by 32 percentage points in major grocers. Online ad bans commencing October 2025 will erase social-media retargeting for non-compliant bars, forcing a pivot to owned e-mail lists and influencer seeding. Brands face incremental design costs to fit “low-sugar” callouts onto smaller packs and trial QR-code storytelling to offset shelf-edge constraints. Retailers charge higher listing fees for compliant placements, transferring compliance economics downstream. The UK energy bar market expects a two-tier structure in which compliant SKUs enjoy promotional freedom and command premium pricing, while legacy recipes retreat to lower-traffic store zones.
*Our forecasts treat driver/restraint impacts as directional, not additive. The impact forecasts reflect baseline growth, mix effects, and variable interactions.
Segment Analysis
By Product Type: Protein Bars Drive Category Evolution
Cereal bars commanded 41.07% of UK energy bar market share in 2025, but protein bars are on track for a 7.44% CAGR that could lift their slice of UK energy bar market size from 35.00% in 2025 to more than 40.00% by 2031. The protein surge aligns with mainstream fitness culture and HFSS incentives that reward high-protein density. Cereal formats remain vital in family baskets where familiar flavors and price points resonate, yet they suffer promotional disadvantages without reformulation. Fruit-and-nut bars ride the clean-label wave, though costlier almonds and dates compress margins unless offset by premium positioning.
Manufacturers layer vitamins D and B12 into protein bars to claim immunity and energy benefits, differentiating beyond macronutrients. Grenade’s “Oreo White” limited edition sold 2 million units within six months, highlighting demand for indulgent taste wrapped in fitness credentials. Conversely, cereal bar reformulations grapple with fiber additions that can harden textures, triggering consumer complaints. R&D teams deploy enzymatic treatments to maintain chewiness. The UK energy bar market rewards brands that pair sensory indulgence with legitimate protein delivery, raising category expectations across all sub-types.


By Distribution Channel: Digital Transformation Accelerates
Supermarkets and hypermarkets held 64.11% of UK energy bar market size in 2025 courtesy of expansive shelf facings and multibuy promos. Yet online channels, growing at 9.11% CAGR, are forecast to surpass 15.00% penetration by 2031 as D2C boxes and grocery e-commerce mature. Retail tech improvements like predictive replenishment nudges keep pantry stocks topped without shopper effort.
Brick-and-mortar remains crucial for trial; 40% of first-time purchasers still discover bars via impulse grabs at checkout. Retailers experiment with nutritionally tiered planograms that segregate HFSS-compliant SKUs, helping shoppers navigate health claims. Convenience stores, benefiting from commuter footfall, adopt contactless micro-store formats in rail hubs, selling protein bars at breakfast peaks. The UK energy bar market thus sees channels blending: click-and-collect orders drive people in-store, where cross-promotions with bottled water stimulate incremental spend.
Geography Analysis
England leads the UK energy bar market, driven by a GBP 34,000 median disposable household income that supports premium purchases and subscriptions. Londoners consume energy bars twice weekly, compared to rural areas where consumption is biweekly. Greater Manchester mirrors London’s trends due to its growing tech sector and 24-hour convenience culture. England’s concentration of co-packing facilities reduces freight costs and enables quick limited-edition product launches. Scotland contributes a mid-single-digit market share, with Glasgow’s 15% annual growth in boutique gyms and the "Paths for All" initiative boosting demand for portable nutrition. Retailers in Scotland adapt to smaller household sizes by offering smaller multipacks.
Wales leverages sports sponsorships with rugby union clubs to enhance category visibility, while higher diabetes rates push retailers toward low-sugar assortments and HFSS-compliant products. The government’s goal to halve childhood obesity by 2030 accelerates innovation in snack formulations. Northern Ireland benefits from its compact geography, enabling efficient last-mile delivery for D2C businesses offering two-day shipping. A 28% rise in consumer preference for clean-label, oat-based bars highlights health-conscious trends, while cross-border price differences occasionally lead to "bar-runs," prompting retailers to align pricing strategies.
Competitive Landscape
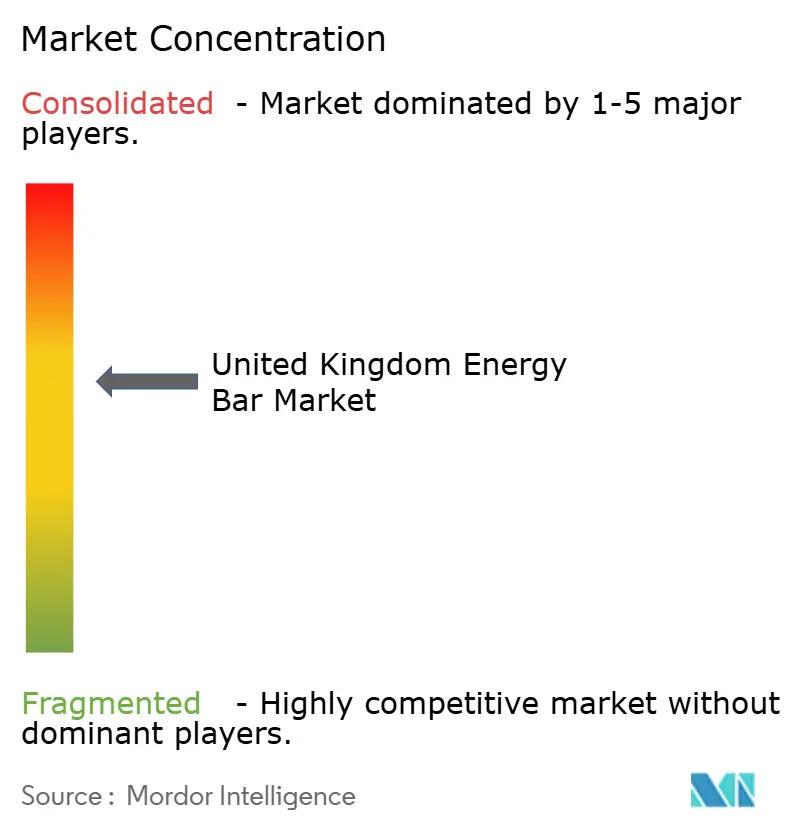
The UK energy bar market, with a moderate concentration index of 6, balances between oligopoly and fragmentation. Mondelez International leads with Grenade’s 2024 value share growth, leveraging chocolate-bar expertise for HFSS-compliant protein formats. Kellogg Company re-entered in January 2025 with Special K Protein Bars, using brand heritage to secure supermarket listings. Fulfil Nutrition, majority-owned by Ferrero, is scaling rapidly through co-packed operations and out-of-store sampling. Meanwhile, Aldi and Lidl’s private-label lines near a combined double-digit market share, pushing branded players to focus on functional claims over price. Smaller disruptors like Tribe Foods are attracting venture capital to pioneer adaptogen-infused bars, reflecting investor interest in health-focused niches.
Ingredient suppliers are innovating with high-melt chocolate compounds to reduce shrinkage during summer logistics, while strategic partnerships are gaining traction. Glanbia supplies whey crisps to multiple brands, and Amazon sponsors virtual fitness events, bundling Prime vouchers with bar multipacks. Companies with in-house nutrition scientists are fast-tracking HFSS reformulations, gaining competitive advantages such as wider shelf space and advertising exemptions. The UK energy bar sector rewards both economies of scale and agile, science-driven innovation.
United Kingdom Energy Bar Industry Leaders
Mondelēz International, Inc.
Kellogg Company
General Mills, Inc
Unilever PLC
Glanbia PLC
- *Disclaimer: Major Players sorted in no particular order

Recent Industry Developments
- April 2025: UK-based protein bar brand Trek has launched a new high-protein, low-sugar range, positioning itself as a pioneer in the sports nutrition sector by using only naturally sourced ingredients and no artificial sweeteners or chemical additives.
- January 2025: Tribe, the natural energy bar challenger, has raised GBP 2.4 million in new funding to launch the UK's first energy bar range incorporating adaptogens, debuting its “Protein + Focus” bar made with lion’s mane mushroom and eight adaptogens.


United Kingdom Energy Bar Market Report Scope
Energy bars are nutritional bars made with cereals, vitamins, and flavorings that are meant to provide instant energy. The United Kingdom's energy bar market is segmented by type and distribution channel. Based on type, the market is segmented into organic energy bars and conventional energy bars. Further, based on distribution channels, the market is segmented into supermarkets/hypermarkets, convenience stores, specialty stores, online retail stores, and other distribution channels. For each segment, the market sizing and forecasts have been done on the basis of value (in USD million).
By Type
| Cereal/Granola Bars |
| Protein-Rich Bars |
| Fruit and Nut Bars |
By Distribution Channel
| Supermarkets/Hypermarkets |
| Convenience Stores |
| Specialty Stores |
| Online Retail Stores |
| Other Distribution Channels |
| By Type | Cereal/Granola Bars |
| Protein-Rich Bars | |
| Fruit and Nut Bars | |
| By Distribution Channel | Supermarkets/Hypermarkets |
| Convenience Stores | |
| Specialty Stores | |
| Online Retail Stores | |
| Other Distribution Channels |


Key Questions Answered in the Report
What is the current value of the UK energy bar market?
The category generated USD 1.72 billion in 2026.
How fast is the market expected to grow?
Forecasts indicate a 7.22% CAGR, taking value to USD 2.43 billion by 2031.
Which product segment is growing the quickest?
Protein bars are on track for a 7.44% CAGR through 2031.
Which sales channel is expanding the fastest?
Online retail is projected to post a 9.11% CAGR, lifted by subscriptions and D2C models.
Page last updated on:


