Market Overview
| Study Period | 2017 - 2030 |
|---|---|
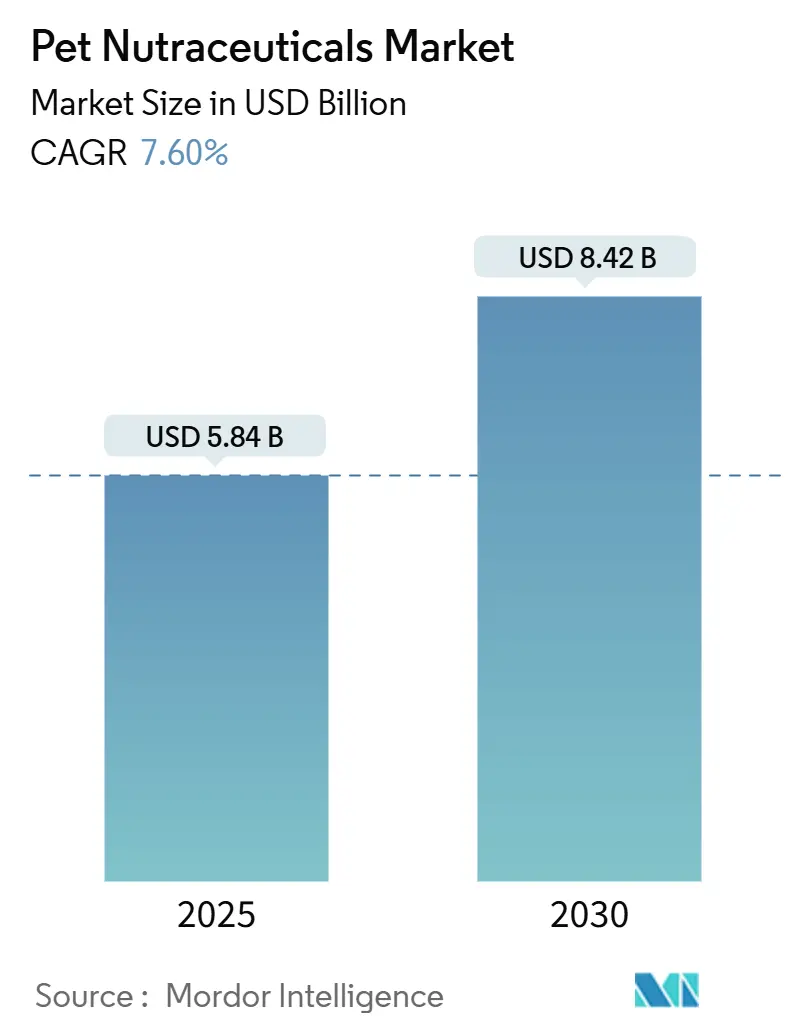
| Market Size (2025) | USD 5.84 Billion |
| Market Size (2030) | USD 8.42 Billion |
| Growth Rate (2025 - 2030) | 7.60% CAGR |
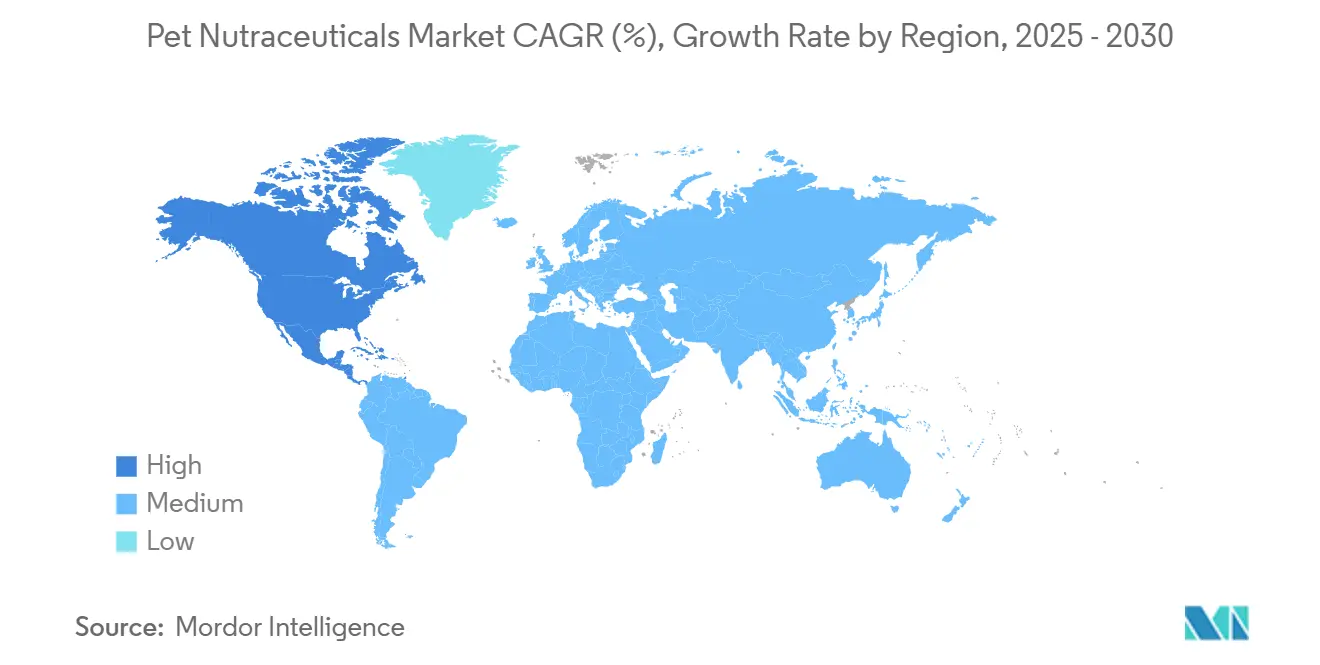
| Fastest Growing Market | Africa |
| Largest Market | North America |
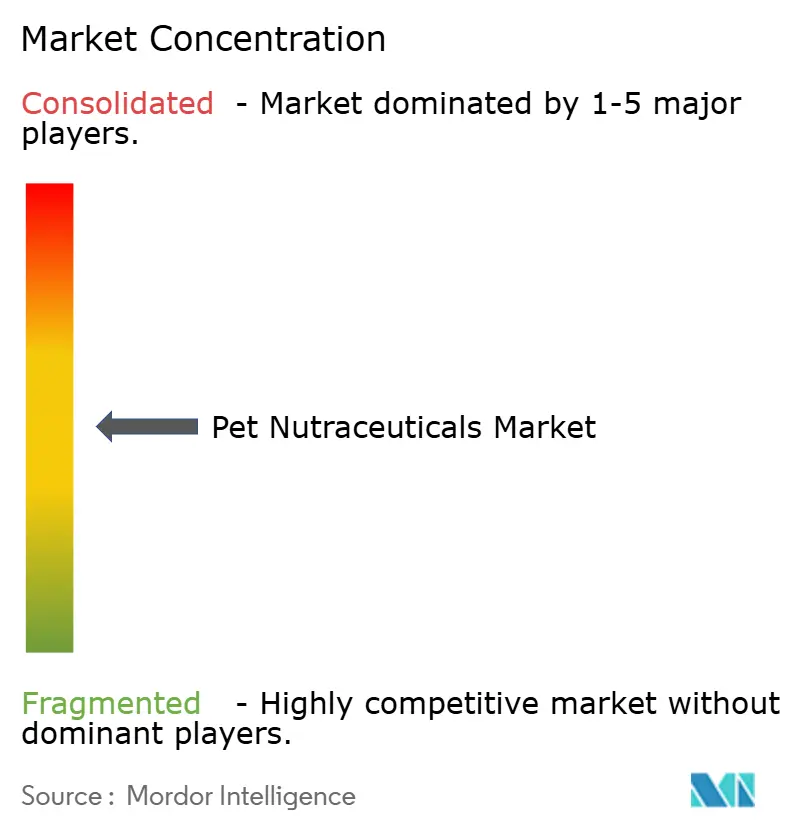
| Market Concentration | Medium |
Major Players
*Disclaimer: Major Players sorted in no particular order Image © Mordor Intelligence. Reuse requires attribution under CC BY 4.0. |
|
Pet Nutraceuticals Market Analysis by Mordor Intelligence
The pet nutraceuticals market size is estimated to be USD 5.84 billion in 2025 and is projected to reach USD 8.42 billion by 2030, growing at a CAGR of 7.60% through 2030. Robust gains stem from the ongoing humanization of pets, expanding veterinary endorsement of functional ingredients, and growing consumer willingness to treat preventive care as an essential household expense. Demand rises most sharply for premium formulations that target joint mobility, weight management, cognitive health, and digestive balance. Supply-side momentum stems from ingredient innovation, particularly algae-based omega-3 oils, and from digital subscription models that enhance dosing compliance. Competitive intensity remains moderate and consolidated as established pet food majors expand their wellness lines, while niche supplement specialists drive rapid product development cycles.
Key Report Takeaways
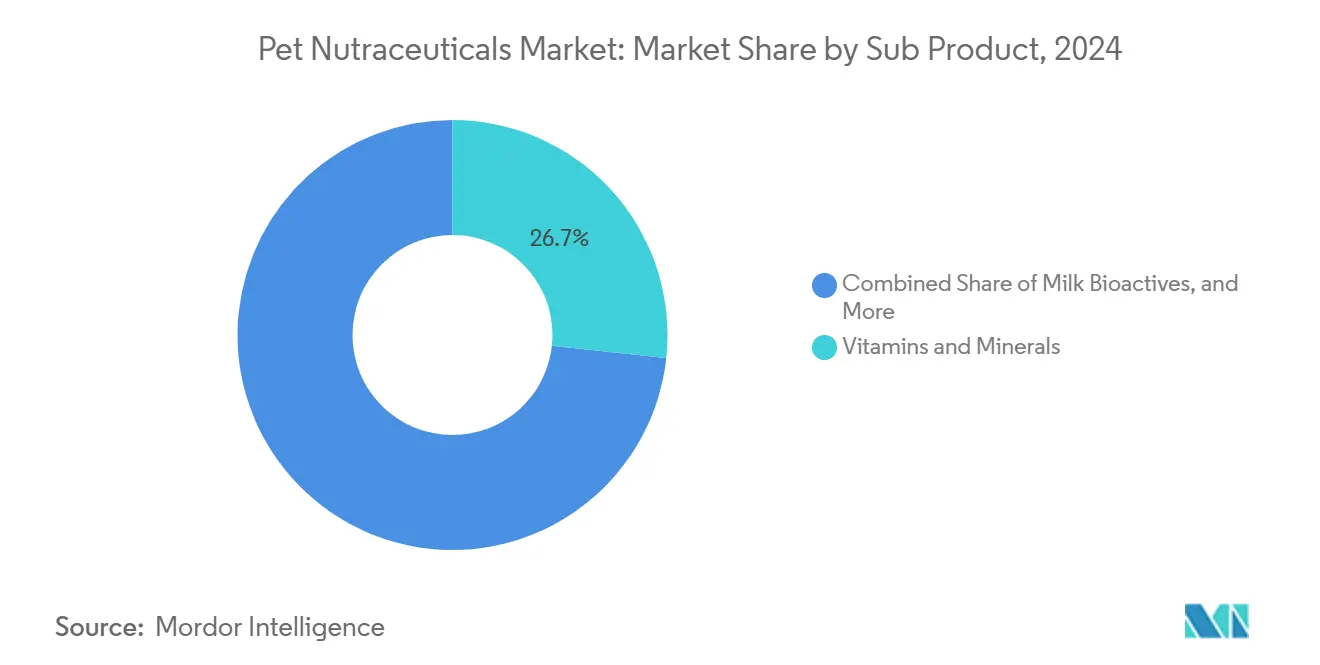
- By sub-product, vitamins and minerals led the pet nutraceuticals market, accounting for 26.7% of the market size in 2024, and this segment is projected to post the fastest CAGR of 8.2% through 2030.
- By pet type, dogs accounted for 58.0% of the pet nutraceuticals market share in 2024, while the cat segment is anticipated to expand at an 8.2% CAGR through 2030.
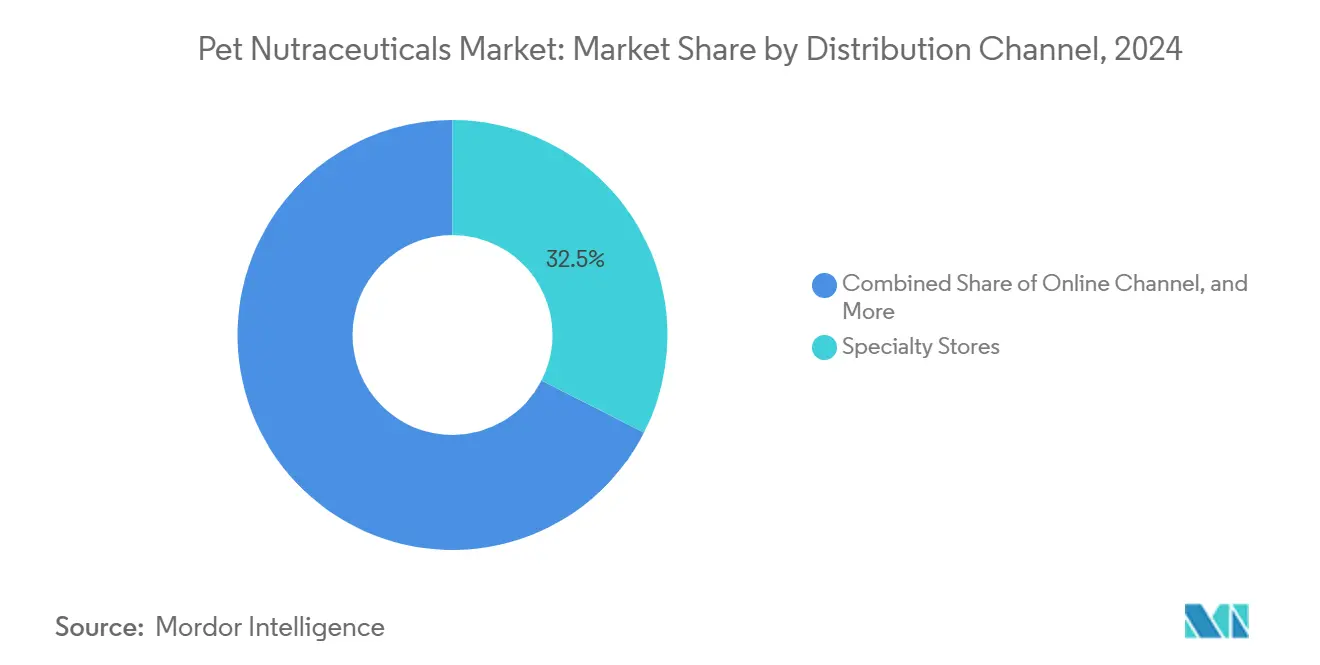
- By distribution channel, specialty stores held a 32.5% share of the pet nutraceuticals market size in 2024, while online channels were projected to record the highest 8.7% CAGR through 2030.
- By geography, North America commanded a 44.5% share of the 2024 baseline, whereas the Africa region is on track for a leading 9.2% CAGR through 2030.
Global Pet Nutraceuticals Market Trends and Insights
Drivers Impact Analysis
| Driver | (~) % Impact on CAGR Forecast | Geographic Relevance | Impact Timeline |
|---|---|---|---|
| Humanization of pets drives functional nutrition demand | +1.2% | Global, strongest in North America and Europe | Medium term (2-4 years) |
| Rising incidence of pet obesity and chronic diseases | +0.8% | North America and Europe are the primary, expanding to the Asia-Pacific region | Long term (≥ 4 years) |
| Premiumization elevates spend on wellness products | +1.1% | North America, Europe, and urban Asia-Pacific markets | Medium term (2-4 years) |
| Tele-veterinary platforms push nutraceutical subscriptions | +0.9% | North America and Europe, emerging in the Asia-Pacific | Short term (≤ 2 years) |
| Algae-derived Omega-3 adoption amid sustainability mandates | +0.7% | In Europe and North America, regulatory influence is spreading globally | Long term (≥ 4 years) |
| EFSA (European Food Safety Authority) approvals spur inclusion of postbiotics | +0.6% | Europe is primary, with spillover to aligned regulatory jurisdictions | Medium term (2-4 years) |
| Source: Mordor Intelligence | |||
Understand The Key Trends Shaping This Market
Download PDF
Humanization of Pets Drives Functional Nutrition Demand
Pet owners increasingly apply human health paradigms to their animals, creating demand for nutraceuticals that mirror trends in human functional foods and dietary supplements. This behavioral shift is evident in purchasing decisions, as 41% of United States consumers purchased pet supplements in 2022. The humanization trend extends beyond basic nutrition to targeted wellness solutions, with owners seeking products that address specific health concerns, such as joint mobility, cognitive function, and digestive health. Premium positioning becomes less price-sensitive when framed as preventive healthcare rather than optional treats. The trend accelerates as millennials and Gen Z consumers, who grew up with pets as family members, enter peak pet ownership years with higher disposable incomes and a willingness to invest in pet wellness.
Rising Incidence of Pet Obesity and Chronic Diseases
Veterinary data show increasing prevalence of obesity-related conditions in companion animals, creating clinical demand for nutraceuticals that support weight management and metabolic health. The Association for Pet Obesity Prevention reports that over 50% of dogs and cats in developed markets are overweight or obese, driving veterinary recommendations for supplements that support healthy metabolism and joint function in 2022[1]Source: Association for Pet Obesity Prevention, “Pet Obesity Statistics,” petobesityprevention.org. Chronic conditions like arthritis, diabetes, and digestive disorders create ongoing treatment protocols where nutraceuticals complement pharmaceutical interventions. This medical necessity positioning differentiates functional supplements from discretionary treats, enabling premium pricing and repeat purchase patterns.
Premiumization Elevates Spend on Wellness Products
Consumer willingness to pay premium prices for perceived health benefits creates a market space for high-margin nutraceutical products that command higher prices compared to basic pet foods. The premiumization trend reflects broader consumer behavior where health and wellness justify price premiums across categories, from organic foods to functional beverages. Pet owners exhibit similar purchasing patterns, with specialty retailers reporting strong growth in products positioned as functional treats or wellness supplements, rather than basic nutrition. This pricing power enables companies to invest in research, quality ingredients, and marketing that further reinforce premium positioning. The trend particularly benefits direct-to-consumer brands that can capture full retail margins while building direct relationships with health-conscious pet owners.
Tele-Veterinary Platforms Push Nutraceutical Subscriptions
Digital veterinary platforms increasingly integrate nutraceutical recommendations into their service offerings, creating new distribution channels that bypass traditional retail. In 2024, Walmart's partnership with Pawp for telehealth services exemplifies how major retailers are building integrated pet health ecosystems that include subscription services for supplements. These platforms leverage veterinary credibility to recommend specific products while offering convenient subscription delivery that ensures compliance and repeat revenue. The model particularly appeals to busy pet owners who value professional guidance combined with convenient fulfillment.
Restraints Impact Analysis
| Restraint | (~) % Impact on CAGR Forecast | Geographic Relevance | Impact Timeline |
|---|---|---|---|
| Fragmented regulatory definitions across regions | -0.9% | Global, particularly complex in multi-region launches | Long term (≥ 4 years) |
| Premium pricing limits uptake in developing markets | -0.7% | Asia-Pacific emerging markets, South America, the Middle East, and Africa | Medium term (2-4 years) |
| Krill-oil supply volatility from conservation quotas | -0.4% | In global supply chains, the cost impact varies by formulation | Short term (≤ 2 years) |
| E-commerce claim scrutiny leads to product delistings | -0.5% | North America and Europe primarily, expanding globally | Short term (≤ 2 years) |
| Source: Mordor Intelligence | |||
Fragmented Regulatory Definitions Across Regions
The absence of harmonized global standards for pet nutraceutical classification creates compliance complexity that constrains multi-region product launches and increases regulatory costs. The FDA's (Food and Drug Administration) recent guidance documents aim to clarify the boundary between pet foods and drugs, but significant gaps remain in defining functional ingredients and health claims. The European Food Safety Authority (EFSA) maintains different approval pathways for pet food additives compared to pet food to supplements, whereas Asia-Pacific markets each have distinct regulatory frameworks that require separate dossier preparation. This fragmentation particularly impacts smaller companies that lack resources for multiple regulatory submissions, creating barriers to entry and limiting innovation.
Premium Pricing Limits Uptake in Developing Markets
High-margin nutraceutical products remain largely inaccessible to price-sensitive consumers in emerging markets, constraining volume growth in regions with otherwise favorable demographic trends. While pet ownership grows rapidly in markets like Brazil, India, and Southeast Asia, disposable income levels cannot support the premium pricing that characterizes developed market nutraceuticals. Local manufacturers in these regions often lack access to specialized ingredients or quality certifications that justify premium positioning, creating a gap between basic pet foods and functional supplements. This pricing constraint becomes more acute during economic downturns when discretionary spending on pet wellness products faces pressure.
Segment Analysis
By Sub Product: Vitamins Drive Broad-Spectrum Appeal
Vitamins and minerals capture the largest pet nutraceuticals market size at 26.7% in 2024, reflecting their established safety profiles and broad veterinary acceptance across multiple health applications. This segment benefits from decades of research in human nutrition that translates readily to companion animal applications, creating consumer familiarity and professional confidence in recommending these supplements. This segment's leadership position is primarily driven by pets' specific daily requirements for vitamins and minerals to support their growth, energy production, and overall well-being.
The vitamins and minerals segment also demonstrates the fastest growth at 8.2% CAGR through 2030, suggesting that broad-spectrum nutritional support remains the primary entry point for pet owners exploring functional nutrition. Hill's Pet Nutrition's ActivBiome technology exemplifies innovation in this space, combining traditional vitamins with prebiotic fibers to support digestive health [2]Source: Hill’s Pet Nutrition, “ActivBiome+ Technology Launch,” hillspet.com. The segment has gained significant traction due to increasing awareness among pet owners regarding the importance of these essential nutrients in maintaining optimal pet health.
Note: Segment shares of all individual segments available upon report purchase
Get Detailed Market Forecasts at the Most Granular Levels
Download PDF
By Pets: Canine Dominance Reflects Spending Patterns
Dogs command 58.0% of the pet nutraceuticals market size in 2024, reflecting both their larger average body size, which requires higher dosages, and typically higher per-pet spending by dog owners compared to cat owners. The canine segment would benefit from more extensive veterinary research on breed-specific health concerns, enabling targeted product development for conditions such as hip dysplasia in large breeds or cognitive decline in senior dogs.
Cats demonstrate the fastest growth at an 8.2% CAGR through 2030, driven by an evolving understanding of feline metabolism and an increasing willingness of cat owners to invest in preventive health measures. The growth reflects broader trends in feline medicine, where specialized nutrition is playing an increasingly important role in managing conditions such as chronic kidney disease and diabetes. The rising awareness among cat owners about preventive healthcare and the importance of nutritional supplements is contributing to the segment's expansion.
By Distribution Channel: Specialty Stores Balance Expertise With Convenience
Specialty stores accounted for the largest share of the pet nutraceuticals market, representing 32.5% in 2024. This dominance is attributed to their ability to offer expert guidance and a curated selection of premium brands that often require customer education for proper use. These stores play a key role by collaborating with local veterinarians, who refer clients seeking specific nutritional support. This professional endorsement supports premium pricing and strengthens their market position.
Online channels are projected to demonstrate the fastest growth at an 8.7% CAGR through 2030, driven by subscription models that ensure consistent dosing compliance and direct-to-consumer brands that capture full retail margins. This channel's prominence is driven by several key factors, including the convenience of shopping from anywhere at any time, a wide range of products, and efficient delivery services to the home. Major e-commerce platforms, including Chewy, Amazon, Petco, Zooplus, and Fetch, have played a crucial role in expanding the accessibility of nutraceuticals. E-commerce platforms are increasingly offering features such as automated subscription services, personalized product recommendations, and detailed product information, making it easier for pet owners to make informed decisions about nutraceutical purchases.
Note: Segment shares of all individual segments available upon report purchase
Get Detailed Market Forecasts at the Most Granular Levels
Download PDF
Geography Analysis
North America dominates the global landscape, holding a 44.5% market share in 2024, driven by high pet ownership rates, established veterinary infrastructure, and consumer willingness to invest in preventive pet healthcare. The region benefits from advanced regulatory frameworks that provide clear guidance for manufacturers while building consumer confidence in product safety and efficacy.
Europe captures a significant market share in 2024, with regulatory leadership from EFSA (European Food Safety Authority) creating pathways for novel ingredients, such as postbiotics, which subsequently gain acceptance in other markets. The region's emphasis on sustainability drives the adoption of algae-based omega-3 alternatives and environmentally responsible packaging, setting trends that influence global product development. Growth prospects remain solid as pet humanization trends accelerate across Western Europe, while Eastern European markets offer opportunities for expansion as disposable incomes rise.
Africa demonstrates the highest growth rates at 9.2% CAGR through 2030, reflecting early-stage market development where basic pet ownership trends intersect with growing awareness of nutritional health benefits. The region benefits from a robust distribution network, including veterinary clinics, pet specialty stores, and online retail channels, which has significantly improved product accessibility for pet owners.
Get Analysis on Important Geographic Markets
Download PDF
Competitive Landscape
The pet nutraceuticals market exhibits moderate consolidation, with large multinational corporations holding a 37.6% market share in 2024, due to their diverse portfolios in pet care. Key players, including Mars, Incorporated, Vetoquinol, Nestlé (Purina), Alltech, and ADM, leverage their established brand presence, extensive distribution networks, and significant research capabilities to maintain their leadership positions. The market includes a mix of pure-play pet nutrition companies and diversified conglomerates with pet care divisions. While global players dominate the premium segment with advanced formulations and branded products, regional players remain competitive in specific geographic markets by offering competitive pricing and leveraging their deep understanding of local consumer needs.
Merger and acquisition activities in the pet nutraceuticals market are primarily driven by large companies aiming to expand their product portfolios and geographic presence. Businesses with specialized supplement formulations or strong regional market positions are particularly attractive targets for acquisition. Vertical integration is another notable trend, with companies acquiring raw material suppliers and distribution channels to gain greater control over their supply chains and enhance market reach. Additionally, strategic partnerships between manufacturers and research institutions are increasingly common, focusing on the development of innovative formulations and the validation of product efficacy.
Technology adoption has emerged as a key differentiator in the market. Companies are integrating digital platforms, subscription models, and data analytics to strengthen customer relationships and optimize product development processes. In 2024, Vetnique Labs' acquisition of Lintbells for USD 45 million highlights the ongoing consolidation trend, where established players acquire innovative brands to broaden their product offerings and expand their geographic footprint[3]Source: Vetnique Labs, “Lintbells Acquisition Announcement,” vetniquelabs.com.
Pet Nutraceuticals Industry Leaders
-
Mars, Incorporated
-
Vetoquinol
-
Nestle (Purina)
-
Alltech
-
ADM
- *Disclaimer: Major Players sorted in no particular order
Need More Details on Market Players and Competitors?
Download PDF
Recent Industry Developments
- December 2024: Nestlé Purina committed USD 4.5 million to veterinary school partnerships and established a new deep tech innovation center focused on pet health solutions. The initiative aims to strengthen professional recommendations for Purina's expanding supplement portfolio while developing next-generation functional ingredients through academic collaboration and startup partnerships.
- June 2023: ADM launched seven turnkey pet health formulas specifically designed for European markets, featuring algae-based omega-3 and postbiotic ingredients that align with EFSA regulatory preferences. The launch represents ADM's strategy to move beyond ingredient supply into finished product development, targeting private label manufacturers and emerging brands seeking regulatory-compliant formulations
- March 2023: Mars Petcare has entered the supplements market with the launch of Pedigree Multivitamins. This product line includes three types of soft chews formulated to address the essential needs of pets. Pedigree Multivitamins are designed to support immunity, enhance digestion, and promote joint health in pets.
Global Pet Nutraceuticals Market Report Scope
Milk Bioactives, Omega-3 Fatty Acids, Probiotics, Proteins and Peptides, Vitamins and Minerals are covered as segments by Sub Product. Cats, Dogs are covered as segments by Pets. Convenience Stores, Online Channel, Specialty Stores, Supermarkets/Hypermarkets are covered as segments by Distribution Channel. Africa, Asia-Pacific, Europe, North America, South America are covered as segments by Region.
Sub Product
| Milk Bioactives |
| Omega-3 Fatty Acids |
| Probiotics |
| Proteins and Peptides |
| Vitamins and Minerals |
| Other Nutraceuticals |
Pets
| Cats |
| Dogs |
| Other Pets |
Distribution Channel
| Convenience Stores |
| Online Channel |
| Specialty Stores |
| Supermarkets/Hypermarkets |
| Other Channels |
Region
| Africa | By Country | South Africa |
| Rest of Africa | ||
| Asia-Pacific | By Country | Australia |
| China | ||
| India | ||
| Indonesia | ||
| Japan | ||
| Malaysia | ||
| Philippines | ||
| Taiwan | ||
| Thailand | ||
| Vietnam | ||
| Rest of Asia-Pacific | ||
| Europe | By Country | France |
| Germany | ||
| Italy | ||
| Netherlands | ||
| Poland | ||
| Russia | ||
| Spain | ||
| United Kingdom | ||
| Rest of Europe | ||
| North America | By Country | Canada |
| Mexico | ||
| United States | ||
| Rest of North America | ||
| South America | By Country | Argentina |
| Brazil | ||
| Rest of South America |
| Sub Product | Milk Bioactives | ||
| Omega-3 Fatty Acids | |||
| Probiotics | |||
| Proteins and Peptides | |||
| Vitamins and Minerals | |||
| Other Nutraceuticals | |||
| Pets | Cats | ||
| Dogs | |||
| Other Pets | |||
| Distribution Channel | Convenience Stores | ||
| Online Channel | |||
| Specialty Stores | |||
| Supermarkets/Hypermarkets | |||
| Other Channels | |||
| Region | Africa | By Country | South Africa |
| Rest of Africa | |||
| Asia-Pacific | By Country | Australia | |
| China | |||
| India | |||
| Indonesia | |||
| Japan | |||
| Malaysia | |||
| Philippines | |||
| Taiwan | |||
| Thailand | |||
| Vietnam | |||
| Rest of Asia-Pacific | |||
| Europe | By Country | France | |
| Germany | |||
| Italy | |||
| Netherlands | |||
| Poland | |||
| Russia | |||
| Spain | |||
| United Kingdom | |||
| Rest of Europe | |||
| North America | By Country | Canada | |
| Mexico | |||
| United States | |||
| Rest of North America | |||
| South America | By Country | Argentina | |
| Brazil | |||
| Rest of South America | |||
Need A Different Region or Segment?
Customize Now
Market Definition
- FUNCTIONS - Pet foods are usually intended to provide complete and balanced nutrition to the pet but are primarily used as functional products. The scope includes the food and supplements consumed by pets including veterinary diets. Supplements/nutraceuticals that are directly supplied to pets are considered within the scope.
- RESELLERS - Companies engaged in reselling of pet food without value addition have been excluded from the market scope, in order to avoid double counting.
- END CONSUMERS - Pet owners are considered to be the end-consumers in the market studied.
- DISTRIBUTION CHANNELS - Supermarkets/hypermarkets, specialty stores, convenience stores, online channels and other channels are considered within the scope. The stores which are exclusively providing pet related basic and custom products are considered within the scope of specialty stores.
| Keyword | Definition |
|---|---|
| Pet Food | The scope of pet food includes the food that is eatable by pets including food, treats, veterinary diets, and nutraceuticals/supplements. |
| Food | Food is animal feed intended for consumption by pets. It is formulated to provide essential nutrients and meet the dietary needs of various types of pets, including dogs, cats, and other animals. These are generally segmented into dry and wet pet foods. |
| Dry Pet Food | Dry pet foods may be extruded/baked (kibbles) or flaked. They have a lower moisture content, typically around 12-20%. |
| Wet Pet Food | Wet pet food, also known as canned pet food or moist pet food, generally has a higher moisture content compared to dry pet food, often ranging from 70-80%. |
| Kibbles | Kibbles are dry, processed pet food in small, bite-sized pieces or pellets. They are specifically formulated to provide balanced nutrition for various domestic animals, such as dogs, cats, and other animals. |
| Treats | Pet Treats are special food items or rewards given to pets, to show affection, and encourage good behavior. They are especially used during training. Pet treats are made from various combinations of meat or meat-derived materials with other ingredients. |
| Dental Treats | Pet dental treats are specialized treats that are formulated to promote good oral hygiene in pets. |
| Crunchy Treats | It is a type of pet treat that has a firm and crispy texture which can be a good source of nutrition for pets. |
| Soft and chewy treats | Soft and Chewy pet treats are a type of pet food product that is formulated to be easy to chewy and digest. They are usually made from soft and pliable ingredients, such as meat, poultry, or vegetables, that have been blended and formed into bite-sized pieces or strips. |
| Freeze-dried & Jerky Treats | Freeze-dried and jerky treats are snacks given to pets, that are prepared through a special preservation process, without damaging the nutritional content, resulting in long-lasting, nutrient-rich treats. |
| Urinary Tract Disease Diets | These are commercial diets that are specifically formulated to promote urinary health and reduce the risk of urinary tract infections and other urinary problems. |
| Renal Diets | These are specialized pet foods formulated to support the health of pets with kidney disease or renal insufficiency. |
| Digestive Sensitivity Diets | Digestive-sensitive diets are specially formulated to meet the nutritional needs of pets with digestive issues such as food intolerances, allergies, and sensitivities. These diets are designed to be easily digestible and to reduce the symptoms of digestive problems in pets. |
| Oral Care Diets | Oral care diets for pets are specially formulated diets produced to promote oral health and hygiene in pets. |
| Grain-Free Pet Food | Pet food that does not contain common grains like wheat, corn, or soy. Grain-free diets are often preferred by pet owners seeking alternative options or if their pets have specific dietary sensitivities. |
| Premium Pet Food | High-quality pet food formulated with superior ingredients often offers additional nutritional benefits compared to standard pet food. |
| Natural Pet Food | Pet food made from natural ingredients, with minimal processing and without artificial preservatives. |
| Organic Pet Food | Pet food is produced using organic ingredients, free from synthetic pesticides, hormones, and genetically modified organisms (GMOs). |
| Extrusion | A manufacturing process used to produce dry pet food, where ingredients are cooked, mixed, and shaped under high pressure and temperature. |
| Other Pets | Other pets include birds, fish, rabbits, hamsters, ferrets, and reptiles. |
| Palatability | The taste, texture, and aroma of pet food influence its appeal and acceptance by pets. |
| Complete and Balanced Pet Food | Pet food that provides all essential nutrients in appropriate proportions to meet the nutritional needs of pets without additional supplementation. |
| Preservatives | These are the substances that are added to pet food to extend its shelf life and prevent spoilage. |
| Nutraceuticals | Food products that offer health benefits beyond basic nutrition, often contain bioactive compounds with potential therapeutic effects. |
| Probiotics | Live beneficial bacteria that promote a healthy balance of gut flora, supporting digestive health and immune function in pets. |
| Antioxidants | Compounds that help neutralize harmful free radicals in the body, promoting cellular health and supporting the immune system in pets. |
| Shelf-Life | The duration of which pet food remains safe and nutritionally viable for consumption after its production date. |
| Prescription diet | Specialized pet food formulated to address specific medical conditions under veterinary supervision. |
| Allergen | A substance that can cause allergic reactions in some pets, leading to food allergies or sensitivities. |
| Canned food | Wet pet food that is packed in cans and contains higher moisture content than dry food. |
| Limited ingredient diet (LID) | Pet food formulated with a reduced number of ingredients to minimize potential allergens. |
| Guaranteed Analysis | The minimum or maximum levels of certain nutrients present in pet food. |
| Weight management | Pet food designed to help pets maintain a healthy weight or support weight loss efforts. |
| Other Nutraceuticals | It includes prebiotics, antioxidants, digestive fiber, enzymes, essential oils and herbs. |
| Other Veterinary Diets | It includes weight management diets, skin and coat health, cardiac care, and joint care. |
| Other Treats | It includes rawhides, mineral blocks, lickables, and catnips. |
| Other Dry Foods | It includes cereal flakes, mixers, meal toppers, freeze-dried foods, and air-dried foods. |
| Other Animals | It includes birds, fish, reptiles, and small animals (rabbits, ferrets, hamsters). |
| Other Distribution Channels | It includes veterinary clinics, local unregulated stores, and feed and farm stores. |
| Proteins and Peptides | Proteins are large molecules composed of basic units called amino acids which help in the growth and development of pets. Peptides are the short string of 2 to 50 amino acids. |
| Omega-3 fatty acids | Omega-3 fatty acids are essential polyunsaturated fats that play a crucial role in the overall health and well-being of Pets |
| Vitamins | Vitamins are the essential organic compounds that are essential for vital physiological functioning. |
| Minerals | Minerals are naturally occurring inorganic substances that are essential for various physiological functions in pets. |
| CKD | Chronic Kidney Disease |
| DHA | Docosahexaenoic Acid |
| EPA | Eicosapentaenoic Acid |
| ALA | Alpha-linolenic Acid |
| BHA | Butylated Hydroxyanisol |
| BHT | Butylated Hydroxytoluene |
| FLUTD | Feline Lower Urinary Tract Disease |
Need More Details on Market Definition?
Ask a Question
Research Methodology
Mordor Intelligence follows a four-step methodology in all our reports.
- Step-1: IDENTIFY KEY VARIABLES: In order to build a robust forecasting methodology, the variables and factors identified in Step-1 are tested against available historical market numbers. Through an iterative process, the variables required for market forecast are set and the model is built on the basis of these variables.
- Step-2: Build a Market Model: Market-size estimations for the forecast years are in nominal terms. Inflation is not a part of the pricing, and the average selling price (ASP) is kept constant throughout the forecast period.
- Step-3: Validate and Finalize: In this important step, all market numbers, variables and analyst calls are validated through an extensive network of primary research experts from the market studied. The respondents are selected across levels and functions to generate a holistic picture of the market studied.
- Step-4: Research Outputs: Syndicated Reports, Custom Consulting Assignments, Databases & Subscription Platforms

Get More Details On Research Methodology
Download PDF


