Pet Veterinary Diet Market Size and Share
Market Overview
| Study Period | 2021 - 2031 |
|---|---|
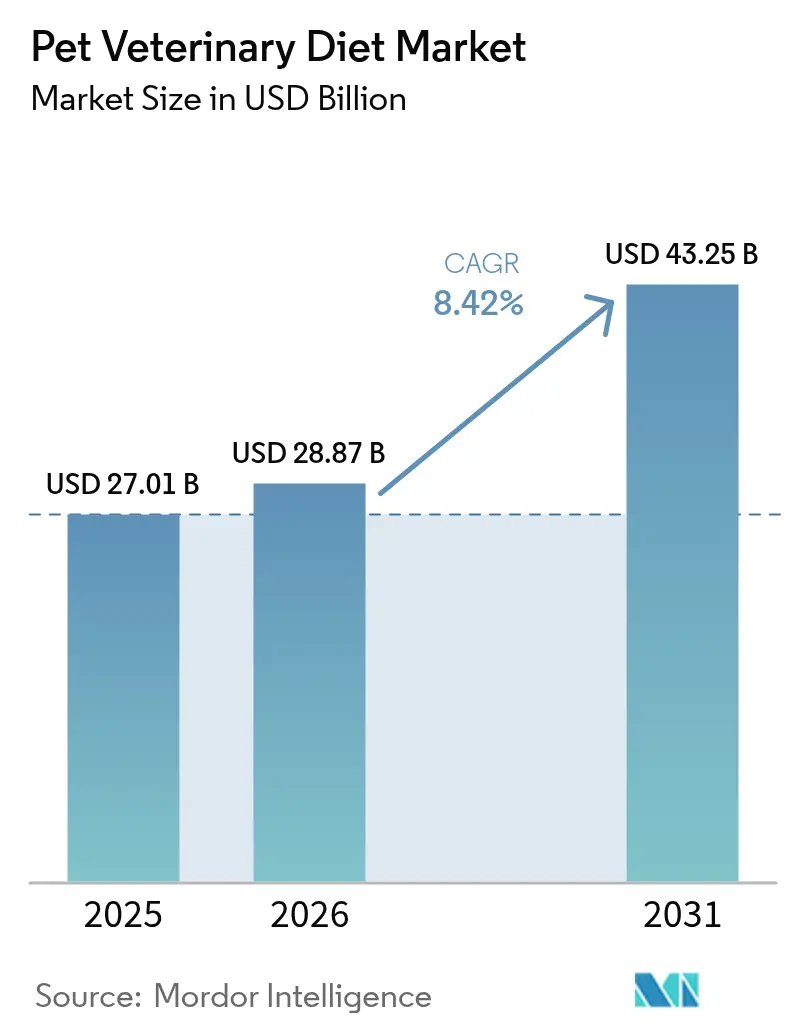
| Market Size (2026) | USD 28.87 Billion |
| Market Size (2031) | USD 43.25 Billion |
| Growth Rate (2026 - 2031) | 8.42% CAGR |
| Fastest Growing Market | Africa |
| Largest Market | North America |
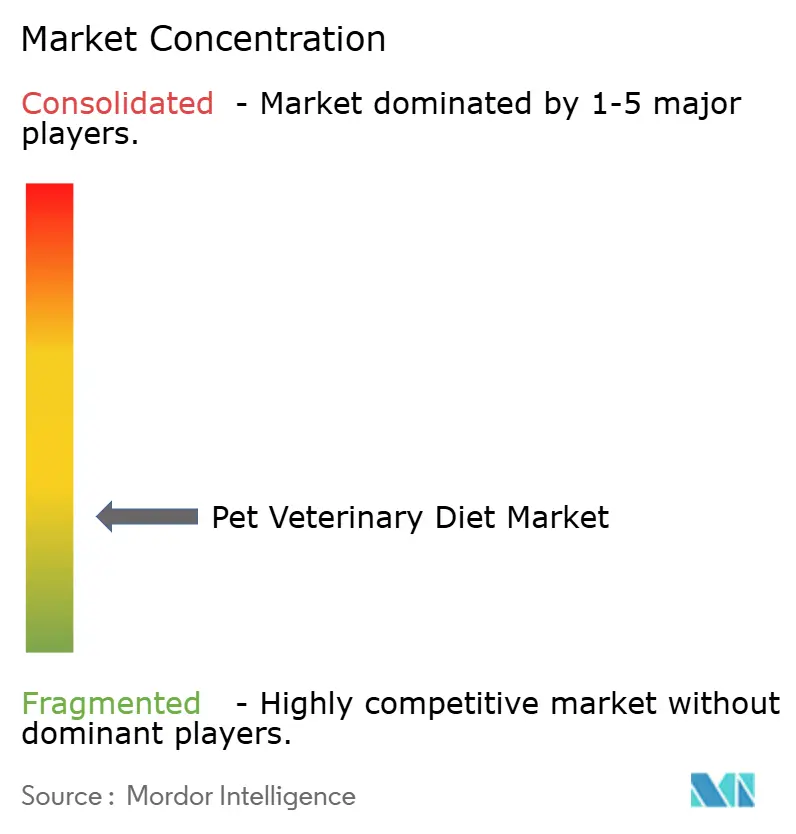
| Market Concentration | Low |
Major Players
*Disclaimer: Major Players sorted in no particular order Image © Mordor Intelligence. Reuse requires attribution under CC BY 4.0. |
|
Pet Veterinary Diet Market Analysis by Mordor Intelligence
The pet veterinary diet market size is projected to expand from USD 27.01 billion in 2025 and USD 28.87 billion in 2026 to USD 43.25 billion by 2031, registering a CAGR of 8.42% between 2026 to 2031. Rising diagnoses of chronic diseases, growth in remote prescription channels, and rapid ingredient innovation are accelerating demand, while clinic consolidation is concentrating prescription authority among a shrinking number of corporate veterinary groups. Artificial intelligence nutrition engines are enabling personalized meal plans, reducing the reliance on traditional one-size-fits-all renal and digestive formulas. Tele-veterinary platforms such as Vetster shorten the path from diagnosis to at-home delivery, expanding therapeutic access beyond clinic walls. At the same time, premium pricing remains a headwind in cost-sensitive households, tempering mass uptake even as clinical need rises.
Key Report Takeaways
- By sub-product, digestive sensitivity diets held 17.7% of the pet veterinary diet market share in 2025, while oral care diets are forecasted to grow at a 9.0% CAGR through 2031.
- By pet type, dogs accounted for 53.2% of the pet veterinary diet market size in 2025 and are projected to expand at a 9.7% CAGR through 2031.
- By distribution channel, the online channel led with 28.4% of the market size in 2025, and is anticipated to advance at a 10.6% CAGR through 2031.
- By geography, North America commanded the largest share, 48.5% in 2025, while Africa is projected to have the fastest growth rate of 11.3% up to 2031.
- The pet veterinary diet market exhibits fragmented competition, with major multinational companies such as Mars, Incorporated, Nestlé Purina PetCare (Nestlé S.A.), Colgate-Palmolive Company (Hill’s Pet Nutrition, Inc.), General Mills, Inc. (Blue Buffalo Pet Products, Inc.), and Schell & Kampeter, Inc. (Diamond Pet Foods) dominating the market in 2025.
Note: Market size and forecast figures in this report are generated using Mordor Intelligence’s proprietary estimation framework, updated with the latest available data and insights as of 2026.
Global Pet Veterinary Diet Market Trends and Insights
Drivers Impact Analysis*
| Driver | (~) % Impact on CAGR Forecast | Geographic Relevance | Impact Timeline |
|---|---|---|---|
| Advanced microbiome-targeted formulations | +1.0% | North America and Western Europe lead global adoption | Medium term (2-4 years) |
| Artificial intelligence driven personalized subscription diets | +1.1% | North America, Europe, and urban Asia-Pacific | Medium term (2-4 years) |
| Expansion of tele-veterinary prescription platforms | +1.1% | North America, Australia, and selected European markets | Short term (≤ 2 years) |
| Rising prevalence of chronic pet diseases | +1.5% | Global, with highest caseloads in North America and Europe | Long term (≥ 4 years) |
| Growing pet humanization and premium spending | +1.0% | North America, Europe, Middle East, and urban Asia-Pacific | Long term (≥ 4 years) |
| Accelerating launches of post-biotic functional ingredients | +0.9% | North America, Europe, and Japan | Medium term (2-4 years) |
| Source: Mordor Intelligence | |||


Advanced Microbiome-Targeted Formulations
Precision fermentation and species-specific probiotics are redefining gastrointestinal therapeutics. Native Microbials and Zesty Paws commercialized canine-derived Lactobacillus strains in 2025, filling the long-standing efficacy gap between human and pet probiotics. Emerging suppliers such as Kingdom Supercultures are fermenting metabolites that mimic probiotic outputs without live organisms, reducing regulatory friction. As these ingredients improve stability and efficacy, clinicians are increasingly confident in recommending microbiome diets during first-line treatment, elevating their contribution to overall growth in the pet veterinary diet market.
Artificial Intelligence Driven Personalized Subscription Diets
Algorithms now integrate diagnostic, genomic, and behavioral data to create tailored macronutrient ratios, delivered in various formats such as frozen, fresh, or gently cooked meals. Farmina Genius AI introduced a free, AI-driven pet health and nutrition plan in 2024, providing 24/7 customized meal plans, behavioral guidance, and health monitoring for dogs and cats based on their age, breed, and health conditions. Mars, Incorporated has made significant investments to connect electronic medical records from its clinics to its direct-to-consumer kitchens, enabling a streamlined process that minimizes the time between prescription and production. Hardware innovations are also making their way into the kitchen, with ChefPaw’s countertop cooker designed to automatically prepare veterinarian-approved recipes, with a considerable number of units anticipated to be distributed in the near future. Personalization not only improves compliance but also overcomes the shelf-space constraints often associated with corporate clinics, thereby expanding access to therapeutic formulations.
Expansion of Tele-Veterinary Prescription Platforms
The growth of tele-veterinary prescription platforms is driving the pet veterinary diet market by eliminating geographical limitations, improving access to specialized nutrition for chronic conditions, and simplifying prescription renewal processes. Remote care has removed geographic barriers, with Vetster facilitating numerous online visits and prescribing treatment in a significant portion of cases. California's AB 1535 was enacted in 2023 and became operative on January 1, 2024. This bill authorizes a California-licensed veterinarian to establish a Veterinarian-Client-Patient Relationship (VCPR) through telehealth [1]Source: California Legislature, "California Legislative Information AB 1535," leginfo.legislature.ca.gov. These policy shifts divert prescriptions from brick-and-mortar outlets to e-commerce, lifting the online share of the pet veterinary diet market and tightening the feedback loop between diet adherence and clinical outcomes.
Rising Prevalence of Chronic Pet Diseases
Obesity, diabetes, and chronic kidney disease are moving from niche to mainstream caseloads. In 2024, 33% of cat owners and 35% of dog owners in the United States reported their pets as overweight or obese, up from 28% for cats and 17% for dogs in 2023 [2]Source: Association for Pet Obesity Prevention, “2024 Pet Obesity Survey and Nutration Survey Highlights,” petobesityprevention.org. Chronic kidney disease affects senior cats, driving lifelong dependence on phosphorus-restricted diets. iCatCare published updated diabetes management guidelines in 2025, highlighting low-carbohydrate therapeutic diets as the primary intervention. This protocol change is contributing to significant growth in diabetic formulations across Europe and North America. The chronic disease burden is especially pronounced in aging pet populations, as the life expectancy of dogs and cats has increased by 2 to 3 years over the past decade due to advancements in preventive care, resulting in a larger group requiring long-term dietary management.
Restraints Impact Analysis*
| Restraint | (~) % Impact on CAGR Forecast | Geographic Relevance | Impact Timeline |
|---|---|---|---|
| Premium pricing limits mass adoption | -1.2% | Global, most acute in lower-income emerging markets | Short term (≤ 2 years) |
| Stringent prescription and labeling regulations | -0.8% | North America, Europe, and Australia | Long term (≥ 4 years) |
| Veterinary clinic consolidation squeezing shelf space | -0.6% | North America and Western Europe | Medium term (2-4 years) |
| Growing scrutiny over sustainability claims | -0.5% | Europe, North America, and Australia | Medium term (2-4 years) |
| Source: Mordor Intelligence | |||
Premium Pricing Limits Mass Adoption
Therapeutic diets are significantly more expensive than maintenance foods, with costs often being nearly half to double higher, which limits their adoption even after a veterinary diagnosis. For example, Hill’s Pet Nutrition, Inc.'s Prescription Diet k/d is priced considerably higher per pound compared to a similar maintenance product. According to Banfield data, a substantial proportion of pet owners who receive a recommendation for therapeutic diets choose not to purchase them due to financial concerns. In India, the cost of a small bag of Royal Canin renal diet represents a notable portion of the average monthly discretionary income in secondary cities, creating barriers to market penetration. In Brazil, inflation has further widened the price gap, with therapeutic diet costs rising faster than the increase in renal disease diagnoses. This underscores the challenge of pricing elasticity, which remains a critical factor in shaping strategies within the pet veterinary diet market.
Stringent Prescription and Labeling Regulations
Regulatory hurdles inflate launch costs and extend time-to-market for challengers. Association of American Feed Control Officials guidelines require nutrient profiles supported by feeding trials, a barrier that smaller firms struggle to finance [3]Source: Association of American Feed Control Officials, “Official Publication,” aafco.org. Europe’s 2024 therapeutic framework introduced mandatory caps on phosphorus and sodium, forcing the reformulation of 18 products and delaying releases by 9 months. Amendments to Japan's Pet Food Safety Act mandate contaminant testing, which incurs additional costs. In Australia, online prescription sales are restricted unless a veterinarian has uploaded a script, hindering the growth of e-commerce sales. While these regulatory measures aim to protect consumers, they also reinforce the dominance of established players in the pet veterinary diet market.
*Our forecasts treat driver/restraint impacts as directional, not additive. The impact forecasts reflect baseline growth, mix effects, and variable interactions.
Segment Analysis
By Sub Product: Digestive Sensitivity Lead, Oral Care Diets Outpaces
Digestive sensitivity is the largest sub product and accounted for 17.7% of the pet veterinary diet market share in 2025. Hill’s Pet Nutrition, Inc.'s i/d and Royal Canin Gastrointestinal dominate prescriptions because gastrointestinal disorders afflict a significant portion of dogs at least once in their lives. Veterinarian endorsement drives high compliance and repeat purchase, sustaining a resilient revenue core even during economic slowdowns. Competitive differentiation now centers on prebiotic blends and postbiotic metabolites that speed symptom relief and boost palatability, helping maintain share against emerging specialty SKUs.
Oral care diets are forecast to expand at a 9.0% CAGR through 2031, the swiftest among all sub-products, as dental disease affects the majority of dogs over age 3. Hill’s Pet Nutrition, Inc.'s t/d employs fiber-matrix kibble that reduces plaque within four weeks. Manufacturers are layering enzymatic coatings and breath-freshening botanicals to strengthen value propositions, while tele-veterinary platforms bundle dental screenings with diet subscriptions. As owner awareness grows, oral-care solutions are positioned to deliver outsized upside to overall pet veterinary diet market share gains through 2031.


By Pets: Dogs Dominate, Cats Steady
Dogs are the largest pet type and accounted for 53.2% of the pet veterinary diet market size in 2025, and are growing fastest at a 9.7% CAGR through 2031, underpinned by higher obesity and diabetes incidence as well as owner propensity to spend. Breed-specific formulas targeting Labrador retriever weight control and German shepherd digestion are lifting average selling prices and clinic margins. Canine therapeutic mixtures benefit from stronger emotional bonds and daily outdoor activity routines, which in turn foster observable improvements that reinforce adherence.
Cats lag dogs in revenue but exhibit an entrenched dependence on renal and urinary diets due to the prevalence of chronic kidney disease. Feline chronic kidney disease occurs in the majority of cats older than 10. Low-phosphorus and protein-restricted blends slow disease progression and lock in lifetime purchase value. Future momentum may shift as continuous glucose monitors become feline-sized, enabling more precise carbohydrate calibration and nudging the cat segment toward faster growth inside the wider pet veterinary diet market.
By Distribution Channel: Online Platforms Surge
The online channel is the largest distribution channel, accounting for 28.4% of the pet veterinary diet market in 2025 and rising at a 10.6% CAGR through 2031. Prescription upload portals improve compliance processes, while auto-replenishment ensures high retention rates. Chewy experienced significant growth in therapeutic revenue, which outpaced the performance of its maintenance food segment. Tele-veterinary partnerships drive prescription volume toward e-commerce platforms by offering more affordable consultations, further enhancing the convenience cycle.
Brick-and-mortar specialty stores and veterinary clinics held a significant share of the pet veterinary diet market in 2025, but face SKU rationalization imposed by corporate ownership groups. Supermarkets and hypermarkets account for a notable share of the market, but they are steadily losing ground as over-the-counter formulas increasingly move online. Convenience stores and rural feed outlets serve hard-to-reach geographies, but a limited assortment curbs their expansion potential. As digital penetration deepens, incumbents are racing to integrate prescription validation, cold-chain logistics, and personalized packaging into a single buyer journey.

Geography Analysis
North America was the largest geography and retained 48.5% of the pet veterinary diet market share in 2025, supported by advanced veterinary infrastructure and strict clinical oversight that favor evidence-backed brands. Royal Canin leverages Mars, Incorporated’s 2,300-clinic network to streamline diagnosis-to-dispense workflows, while Hill’s Pet Nutrition, Inc. maintains share through independent-practice loyalty programs. Canada’s provincial regulations require in-person exams before prescription renewal, limiting online migration of domestic therapeutic volume. Mexico’s market expanded as urban clinics proliferated, though high import duties still restrict full product assortments to premium pet boutiques.
Africa is forecast to register an 11.3% CAGR through 2031, as South African Veterinary Council guideline harmonization builds clinician confidence. Gulf Cooperation Council countries liberalized import testing, enabling quicker entry for European and North American suppliers under the United Arab Emirates' pet food safety standards. Europe held a significant share of the pet veterinary diet market, with regulatory harmonization under the Federation of European Pet Food Industry guidelines supporting cross-border product launches. In Germany, the implementation of transparent labeling requirements for phosphorus levels and fishery certifications resulted in the reformulation of a substantial portion of renal diets. Sales in the United Kingdom saw notable growth after the Pet Food Manufacturers Association emphasized the economic advantages of preventive nutrition. France, the Netherlands, and Poland recorded significant growth, driven by e-commerce expansion and higher clinic density.
The Asia-Pacific region contributes significantly to the global market value, with Japan playing a leading role due to the Pet Food Safety Act, which requires certification ensuring therapeutic imports are free from contaminants. In China, the expansion of urban pet ownership cultures has supported market growth, although unclear prescription regulations continue to encourage gray-market online sales. India has seen advancements driven by increased awareness among affluent households, though the market remains highly price-sensitive. Southeast Asian countries have collectively shown growth, supported by the rise of emerging middle classes and the expansion of veterinary practices in major urban centers.


Competitive Landscape
The pet veterinary diet market exhibits fragmented competition, with major multinational companies such as Mars, Incorporated, Nestlé Purina PetCare (Nestlé S.A.), Colgate-Palmolive Company (Hill’s Pet Nutrition, Inc.), General Mills, Inc. (Blue Buffalo Pet Products, Inc.), and Schell & Kampeter, Inc. (Diamond Pet Foods) dominating the market in 2025. Mars, Incorporated integrates diagnosis, prescription, and fulfillment through its hospital chain, positioning Royal Canin as the default choice at the point of care. Colgate-Palmolive Company (Hill’s Pet Nutrition, Inc.) responds with peer-reviewed trials and clinic-exclusive pricing rebates that reinforce brand credibility among practitioners. Nestlé Purina PetCare (Nestlé S.A.) leans on in-clinic sampling and continuing-education sponsorship to secure shelf space.
Fragmentation is creeping upward as regional players seize niches. Farmina Pet Foods Holding leverages the Genius AI engine to bypass generic formulas and capture data-rich recurring revenue. Affinity Petcare S.A. (Agrolimen, S.A.) uses ISO 22000 certification to anchor Middle Eastern entry, while Wellness Pet Company partners with 500 independent clinics to circumvent corporate buying restrictions.
Ingredient innovation is another competitive fault line. Archer Daniels Midland Company chases proprietary post-biotic compounds that deliver gut-health benefits without live organisms, sidestepping shelf-life constraints. Patent activity surged in 2025 as large and small firms locked in exclusivity around microbiome actives and personalization algorithms. In response, global regulators have begun building frameworks for data-driven nutritional claims, a move that will reward those with deep scientific and compliance resources.
Pet Veterinary Diet Industry Leaders
-
Mars, Incorporated
-
Nestlé Purina PetCare (Nestlé S.A.)
-
Colgate-Palmolive Company (Hill’s Pet Nutrition, Inc.)
-
General Mills, Inc. (Blue Buffalo Pet Products, Inc.)
-
Schell & Kampeter, Inc. (Diamond Pet Foods)
- *Disclaimer: Major Players sorted in no particular order

Recent Industry Developments
- February 2026: Wynwood Dog Food Co. has expanded its FRESH RX line with two new fresh prescription diets, such as Low Fat Digestive Support and Weight + Mobility Support. These formulations feature a novel protein source, highly digestible ingredients, and added prebiotics and probiotics.
- December 2025: The Nutriment Company (TNC), a European producer of premium fresh pet food, has established a seven-member Science Board to promote evidence-based natural pet nutrition. The board, comprising internal specialists and external experts, will provide strategic guidance, support research initiatives, and advise on the development of raw, minimally processed foods, including veterinary diets.
- June 2025: Royal Canin has introduced Fresh Health Nutrition, a new range of gently cooked, frozen dog food designed to meet the nutritional needs of specific life stages (Puppy, Adult, Senior). Developed with veterinary expertise, the product line features real ingredients such as chicken, pork, beef, and vegetables, and excludes corn, wheat, and soy.
- May 2025: Betagro has introduced new premium, human-grade pet food formulas, including five enhanced Perfecta Veterinary Diet options for dogs and cats, as well as the new CAT n joy Grain Free line for allergy-sensitive cats. Developed in collaboration with veterinarians, these products are designed to promote health, longevity, and coat quality.


Global Pet Veterinary Diet Market Report Scope
A pet veterinary diet, also known as a therapeutic or prescription diet, is a specialized pet food scientifically formulated to help manage, treat, or prevent specific medical conditions, including kidney disease, allergies, and obesity. The Pet Veterinary Diet Market Report is Segmented by Sub Product (Diabetes, Digestive Sensitivity, Oral Care Diets, Renal, Urinary Tract Disease, Derma Diets, Obesity Diets, and Other Veterinary Diets), by Pets (Cats, Dogs, and Other Pets), by Distribution Channel (Convenience Stores, Online Channel, Specialty Stores, Supermarkets/Hypermarkets, and Other Channels), and by Geography (North America, Europe, Asia-Pacific, South America, Middle East, and Africa). The Market Forecasts are Provided in Terms of Value (USD) and Volume (Metric Tons)
| Diabetes |
| Renal |
| Urinary Tract Disease |
| Digestive Sensitivity |
| Oral Care Diets |
| Derma Diets |
| Obesity Diets |
| Other Veterinary Diets |
| Cats |
| Dogs |
| Other Pets |
| Convenience Stores |
| Online Channel |
| Specialty Stores |
| Supermarkets/Hypermarkets |
| Other Channels |
| North America | Canada |
| Mexico | |
| United States | |
| Rest of North America | |
| Europe | France |
| Germany | |
| Italy | |
| Netherlands | |
| Poland | |
| Russia | |
| Spain | |
| United Kingdom | |
| Rest of Europe | |
| Asia-Pacific | Australia |
| China | |
| India | |
| Indonesia | |
| Japan | |
| Malaysia | |
| Philippines | |
| Taiwan | |
| Thailand | |
| Vietnam | |
| Rest of Asia-Pacific | |
| South America | Argentina |
| Brazil | |
| Rest of South America | |
| Middle East | Saudi Arabia |
| United Arab Emirates | |
| Turkey | |
| Rest of Saudi Arabia | |
| Africa | South Africa |
| Rest of Africa |
| By Sub Product | Diabetes | |
| Renal | ||
| Urinary Tract Disease | ||
| Digestive Sensitivity | ||
| Oral Care Diets | ||
| Derma Diets | ||
| Obesity Diets | ||
| Other Veterinary Diets | ||
| By Pets | Cats | |
| Dogs | ||
| Other Pets | ||
| By Distribution Channel | Convenience Stores | |
| Online Channel | ||
| Specialty Stores | ||
| Supermarkets/Hypermarkets | ||
| Other Channels | ||
| By Geography | North America | Canada |
| Mexico | ||
| United States | ||
| Rest of North America | ||
| Europe | France | |
| Germany | ||
| Italy | ||
| Netherlands | ||
| Poland | ||
| Russia | ||
| Spain | ||
| United Kingdom | ||
| Rest of Europe | ||
| Asia-Pacific | Australia | |
| China | ||
| India | ||
| Indonesia | ||
| Japan | ||
| Malaysia | ||
| Philippines | ||
| Taiwan | ||
| Thailand | ||
| Vietnam | ||
| Rest of Asia-Pacific | ||
| South America | Argentina | |
| Brazil | ||
| Rest of South America | ||
| Middle East | Saudi Arabia | |
| United Arab Emirates | ||
| Turkey | ||
| Rest of Saudi Arabia | ||
| Africa | South Africa | |
| Rest of Africa | ||


Market Definition
- FUNCTIONS - Pet foods are usually intended to provide complete and balanced nutrition to the pet but are primarily used as functional products. The scope includes the food and supplements consumed by pets including veterinary diets. Supplements/nutraceuticals that are directly supplied to pets are considered within the scope.
- RESELLERS - Companies engaged in reselling of pet food without value addition have been excluded from the market scope, in order to avoid double counting.
- END CONSUMERS - Pet owners are considered to be the end-consumers in the market studied.
- DISTRIBUTION CHANNELS - Supermarkets/hypermarkets, specialty stores, convenience stores, online channels and other channels are considered within the scope. The stores which are exclusively providing pet related basic and custom products are considered within the scope of specialty stores.
| Keyword | Definition |
|---|---|
| Pet Food | The scope of pet food includes the food that is eatable by pets including food, treats, veterinary diets, and nutraceuticals/supplements. |
| Food | Food is animal feed intended for consumption by pets. It is formulated to provide essential nutrients and meet the dietary needs of various types of pets, including dogs, cats, and other animals. These are generally segmented into dry and wet pet foods. |
| Dry Pet Food | Dry pet foods may be extruded/baked (kibbles) or flaked. They have a lower moisture content, typically around 12-20%. |
| Wet Pet Food | Wet pet food, also known as canned pet food or moist pet food, generally has a higher moisture content compared to dry pet food, often ranging from 70-80%. |
| Kibbles | Kibbles are dry, processed pet food in small, bite-sized pieces or pellets. They are specifically formulated to provide balanced nutrition for various domestic animals, such as dogs, cats, and other animals. |
| Treats | Pet Treats are special food items or rewards given to pets, to show affection, and encourage good behavior. They are especially used during training. Pet treats are made from various combinations of meat or meat-derived materials with other ingredients. |
| Dental Treats | Pet dental treats are specialized treats that are formulated to promote good oral hygiene in pets. |
| Crunchy Treats | It is a type of pet treat that has a firm and crispy texture which can be a good source of nutrition for pets. |
| Soft and chewy treats | Soft and Chewy pet treats are a type of pet food product that is formulated to be easy to chewy and digest. They are usually made from soft and pliable ingredients, such as meat, poultry, or vegetables, that have been blended and formed into bite-sized pieces or strips. |
| Freeze-dried & Jerky Treats | Freeze-dried and jerky treats are snacks given to pets, that are prepared through a special preservation process, without damaging the nutritional content, resulting in long-lasting, nutrient-rich treats. |
| Urinary Tract Disease Diets | These are commercial diets that are specifically formulated to promote urinary health and reduce the risk of urinary tract infections and other urinary problems. |
| Renal Diets | These are specialized pet foods formulated to support the health of pets with kidney disease or renal insufficiency. |
| Digestive Sensitivity Diets | Digestive-sensitive diets are specially formulated to meet the nutritional needs of pets with digestive issues such as food intolerances, allergies, and sensitivities. These diets are designed to be easily digestible and to reduce the symptoms of digestive problems in pets. |
| Oral Care Diets | Oral care diets for pets are specially formulated diets produced to promote oral health and hygiene in pets. |
| Grain-Free Pet Food | Pet food that does not contain common grains like wheat, corn, or soy. Grain-free diets are often preferred by pet owners seeking alternative options or if their pets have specific dietary sensitivities. |
| Premium Pet Food | High-quality pet food formulated with superior ingredients often offers additional nutritional benefits compared to standard pet food. |
| Natural Pet Food | Pet food made from natural ingredients, with minimal processing and without artificial preservatives. |
| Organic Pet Food | Pet food is produced using organic ingredients, free from synthetic pesticides, hormones, and genetically modified organisms (GMOs). |
| Extrusion | A manufacturing process used to produce dry pet food, where ingredients are cooked, mixed, and shaped under high pressure and temperature. |
| Other Pets | Other pets include birds, fish, rabbits, hamsters, ferrets, and reptiles. |
| Palatability | The taste, texture, and aroma of pet food influence its appeal and acceptance by pets. |
| Complete and Balanced Pet Food | Pet food that provides all essential nutrients in appropriate proportions to meet the nutritional needs of pets without additional supplementation. |
| Preservatives | These are the substances that are added to pet food to extend its shelf life and prevent spoilage. |
| Nutraceuticals | Food products that offer health benefits beyond basic nutrition, often contain bioactive compounds with potential therapeutic effects. |
| Probiotics | Live beneficial bacteria that promote a healthy balance of gut flora, supporting digestive health and immune function in pets. |
| Antioxidants | Compounds that help neutralize harmful free radicals in the body, promoting cellular health and supporting the immune system in pets. |
| Shelf-Life | The duration of which pet food remains safe and nutritionally viable for consumption after its production date. |
| Prescription diet | Specialized pet food formulated to address specific medical conditions under veterinary supervision. |
| Allergen | A substance that can cause allergic reactions in some pets, leading to food allergies or sensitivities. |
| Canned food | Wet pet food that is packed in cans and contains higher moisture content than dry food. |
| Limited ingredient diet (LID) | Pet food formulated with a reduced number of ingredients to minimize potential allergens. |
| Guaranteed Analysis | The minimum or maximum levels of certain nutrients present in pet food. |
| Weight management | Pet food designed to help pets maintain a healthy weight or support weight loss efforts. |
| Other Nutraceuticals | It includes prebiotics, antioxidants, digestive fiber, enzymes, essential oils and herbs. |
| Other Veterinary Diets | It includes weight management diets, skin and coat health, cardiac care, and joint care. |
| Other Treats | It includes rawhides, mineral blocks, lickables, and catnips. |
| Other Dry Foods | It includes cereal flakes, mixers, meal toppers, freeze-dried foods, and air-dried foods. |
| Other Animals | It includes birds, fish, reptiles, and small animals (rabbits, ferrets, hamsters). |
| Other Distribution Channels | It includes veterinary clinics, local unregulated stores, and feed and farm stores. |
| Proteins and Peptides | Proteins are large molecules composed of basic units called amino acids which help in the growth and development of pets. Peptides are the short string of 2 to 50 amino acids. |
| Omega-3 fatty acids | Omega-3 fatty acids are essential polyunsaturated fats that play a crucial role in the overall health and well-being of Pets |
| Vitamins | Vitamins are the essential organic compounds that are essential for vital physiological functioning. |
| Minerals | Minerals are naturally occurring inorganic substances that are essential for various physiological functions in pets. |
| CKD | Chronic Kidney Disease |
| DHA | Docosahexaenoic Acid |
| EPA | Eicosapentaenoic Acid |
| ALA | Alpha-linolenic Acid |
| BHA | Butylated Hydroxyanisol |
| BHT | Butylated Hydroxytoluene |
| FLUTD | Feline Lower Urinary Tract Disease |


Research Methodology
Mordor Intelligence follows a four-step methodology in all our reports.
- Step-1: IDENTIFY KEY VARIABLES: In order to build a robust forecasting methodology, the variables and factors identified in Step-1 are tested against available historical market numbers. Through an iterative process, the variables required for market forecast are set and the model is built on the basis of these variables.
- Step-2: Build a Market Model: Market-size estimations for the forecast years are in nominal terms. Inflation is not a part of the pricing, and the average selling price (ASP) is kept constant throughout the forecast period.
- Step-3: Validate and Finalize: In this important step, all market numbers, variables and analyst calls are validated through an extensive network of primary research experts from the market studied. The respondents are selected across levels and functions to generate a holistic picture of the market studied.
- Step-4: Research Outputs: Syndicated Reports, Custom Consulting Assignments, Databases & Subscription Platforms


