Market Overview
| Study Period | 2020 - 2031 |
|---|---|
| Base Year For Estimation | 2025 |
| Forecast Data Period | 2026 - 2031 |
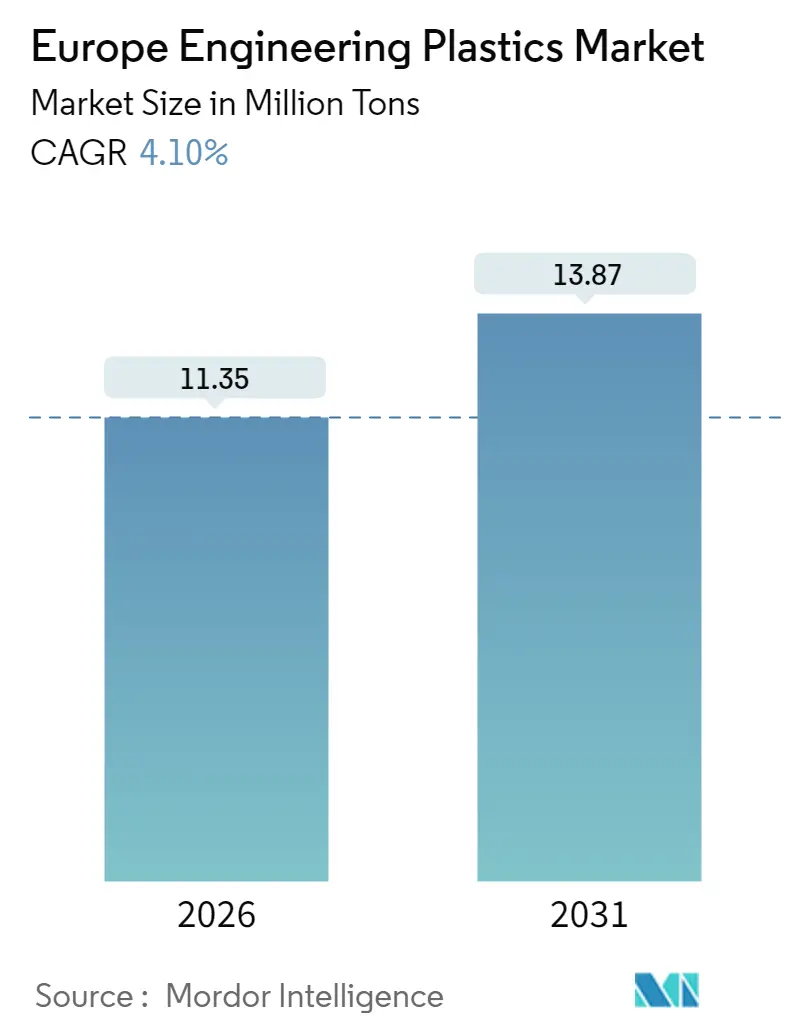
| Market Volume (2026) | 11.35 Million tons |
| Market Volume (2031) | 13.87 Million tons |
| Growth Rate (2026 - 2031) | 4.10% CAGR |
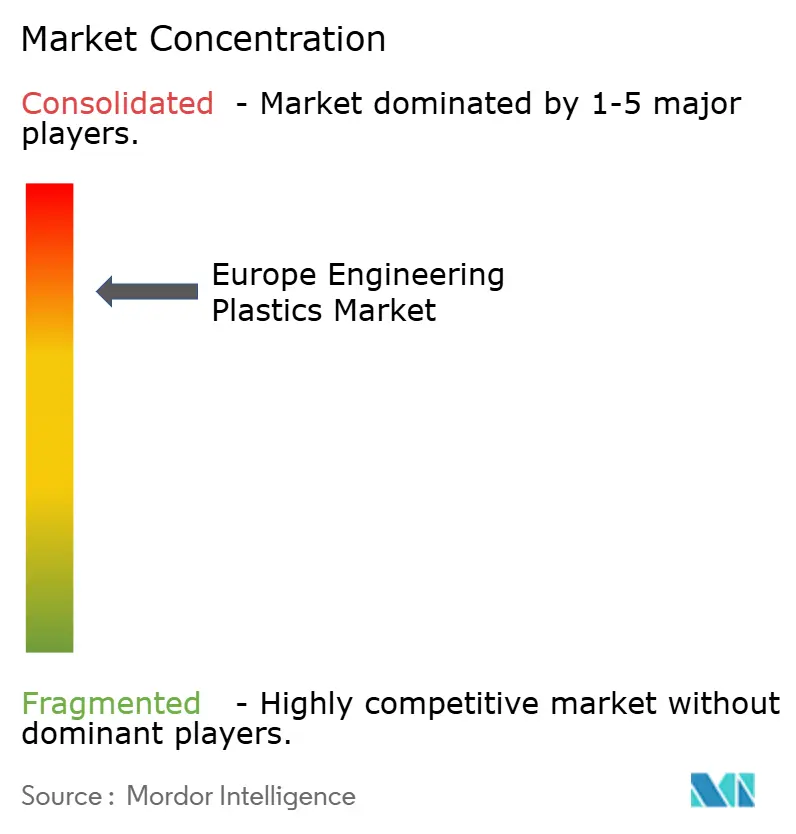
| Market Concentration | High |
Major Players *Disclaimer: Major Players sorted in no particular order Image © Mordor Intelligence. Reuse requires attribution under CC BY 4.0. | |
Europe Engineering Plastics Market Analysis by Mordor Intelligence
The Europe Engineering Plastics Market was valued at 10.90 Million tons in 2025 and estimated to grow from 11.35 Million tons in 2026 to reach 13.87 Million tons by 2031, at a CAGR of 4.10% during the forecast period (2026-2031). The upswing reflects sustained substitution of metal and glass in mobility, electronics, and packaging as manufacturers prioritize lightweighting, thermal management, and circular-economy compliance. Automakers moving toward battery-electric platforms demand polymers that offset battery mass, while aerospace primes call for thermoplastic composites to streamline assembly costs. In electronics, high-temperature, radar-transparent grades enable densely packed chipsets and ADAS sensor housings that must remain dimensionally stable. Tightened EU recycled-content mandates add urgency, rewarding firms with feedstock-secure recycling loops. Competitive intensity is shaped by portfolio realignments that channel R&D toward specialty, higher-margin formulations and amplify scale benefits across global supply chains.
Key Report Takeaways
- By resin type, Polyethylene Terephthalate captured 53.56% of Europe engineering plastics market share in 2025, while Styrene Copolymers are projected to expand at a 4.97% CAGR through 2031.
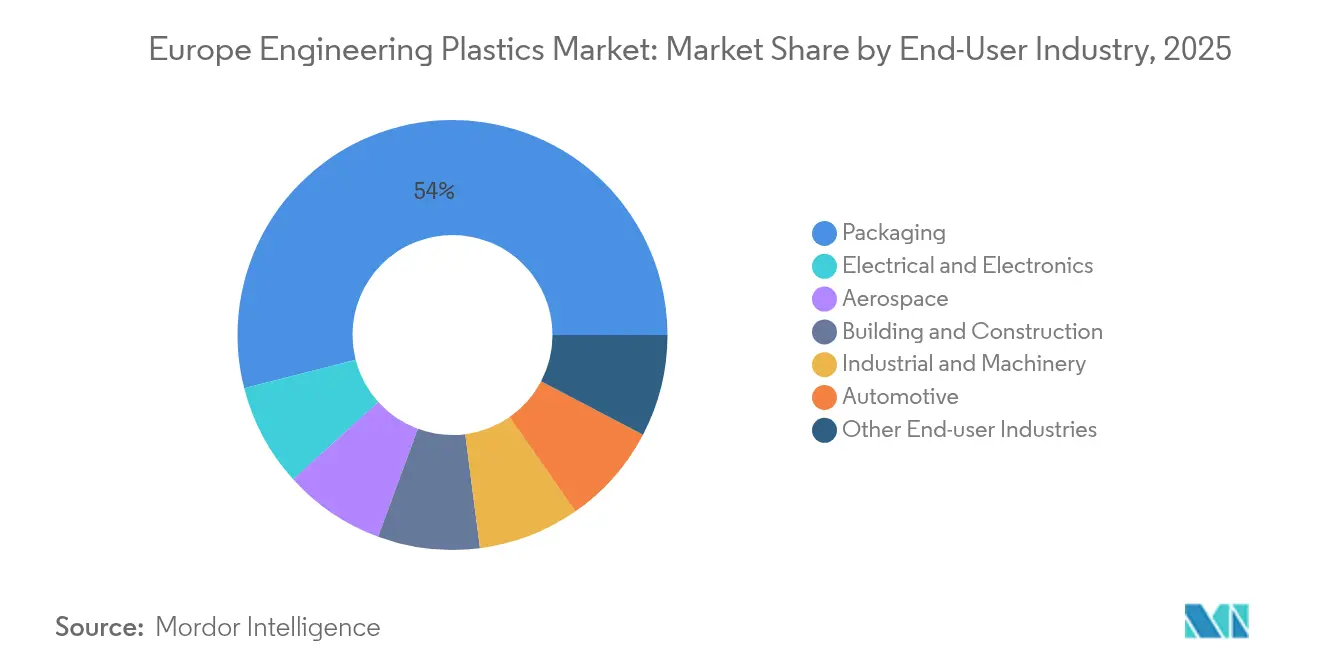
- By end-user industry, packaging commanded 53.98% share of the Europe engineering plastics market size in 2025, and electrical & electronics is advancing at a 5.63% CAGR through 2031.
- By geography, Rest of Europe accounted for 40.67% of volume in 2025; the United Kingdom is forecast to grow at a 4.36% CAGR to 2031.
Note: Market size and forecast figures in this report are generated using Mordor Intelligence’s proprietary estimation framework, updated with the latest available data and insights as of January 2026.
Europe Engineering Plastics Market Trends and Insights
Drivers Impact Analysis
| Driver | (~) % Impact on CAGR Forecast | Geographic Relevance | Impact Timeline |
|---|---|---|---|
| Lightweighting push in automotive & aerospace | +1.20% | Germany, France, UK, Italy | Medium term (2-4 years) |
| Electronics miniaturization & thermal needs | +1.40% | Germany, Netherlands, Ireland | Short term (≤ 2 years) |
| EU Green Deal recycled-content targets | +0.90% | EU-wide, led by Germany, France | Long term (≥ 4 years) |
| Radar-transparent plastics for ADAS | +0.80% | Germany, Sweden, France | Medium term (2-4 years) |
| Circular hubs for rigid PU-foam recycling | +0.60% | Germany, Netherlands, Belgium | Long term (≥ 4 years) |
| Source: Mordor Intelligence | |||
Understand The Key Trends Shaping This Market
Download PDF
Lightweighting push in automotive & aerospace
European OEMs intensify polymer uptake to meet fleet-wide CO₂ ceilings without sacrificing occupant safety or assembly speed. Thermoplastic composites slash component mass by up to 50% relative to aluminum and trim cycle times nearly 80% compared with thermosets, a productivity gain welcomed by lean aerospace production cells. Airbus platform suppliers such as Premium AEROTEC validate large fuselage sections produced with automated tape-laying, signaling readiness for wider fuselage adoption. On-road, EV skateboard architectures rely on glass-fiber-reinforced polyamide housings that protect battery modules while remaining weldable to metal crash structures. Germany’s automotive clusters channel Horizon Europe funds into hybrid molding lines that co-overmold polymers onto ultrathin steel, merging stiffness with corrosion resistance. As fuel-cost-savvy airlines firm up narrow-body orderbooks, the Europe engineering plastics market embeds itself as a structural enabler of next-generation mobility.
Electronics miniaturization & thermal management needs
Chiplet architectures and 2.5-D packaging escalate heat flux, prompting device makers to specify carbon-fiber-filled PEEK and graphite-enhanced PPS for sockets and test handlers. PEEK grades retain mechanical integrity above 200 °C, preventing warpage during plasma cleaning cycles common in Fab+1 lines. Ireland’s leading substrate assemblers report throughput gains after switching from ceramic to polymer heater blocks that deliver faster thermal ramp rates. Dutch photonics startups, leveraging generous EU Chips Act credits, co-design polymer waveguide carriers that halve assembly misalignment defects versus glass. Mass-balance-attributed polyamides with 80% bio-feedstock uptake let contract manufacturers display carbon-reduced PCBs to brand-name smartphone OEMs. As data-center densification tops CIO agendas, rack builders turn to conduction-optimized polycarbonate blends that dissipate Joule heat without adding weight, sustaining demand within the Europe engineering plastics market.
EU Green Deal & mandatory recycled-content targets
The Packaging and Packaging Waste Regulation (PPWR) compels brand owners to increase recycled content in contact-sensitive applications, propelling capital toward both mechanical and chemical reclaim ventures. Germany alone risks a 3.5 million-ton shortage of high-purity recyclate by 2030, a gap that widens bargaining power for vertically integrated resin makers. Over 50 polymers achieved ISCC+ mass-balance certification in 2024, with Europe absorbing 60% of global allocation certificates. LyondellBasell’s new German hub marries solvent-based dissolution with depolymerization reactors to recover engineering-grade polyamides from scrapped white-goods casings, a pioneering closed loop for durable uses. Consumer-goods majors lock in multiyear offtake contracts, de-risking plant payback and buffering the Europe engineering plastics market from virgin-price swings. Companies mastering circular feedstock logistics secure competitive insulation against volatile naphtha benchmarks.
Radar-transparent plastics for ADAS integration
Level-4 autonomy prototypes integrate 12-plus radar units per vehicle, requiring exterior fascia that allow unimpeded signal propagation yet withstand curb impacts. BASF has formulated low-dielectric-constant polyamides that pass stringent 77 GHz transparency tests while meeting Class-A paint specifications. Swedish Tier-1s validate the grades in bumper corners, enabling hidden-sensor aesthetics without acrylic radomes. Self-healing thermoplastic polyurethane films under testing at Karlsruhe Institute of Technology autonomously repair micro-cracks within 10 minutes at 60 °C, preserving electromagnetic clarity over the vehicle life. French legislative drafts may mandate obstacle-detection redundancy, increasing radar count per car and escalating polymer demand. The Europe engineering plastics market therefore aligns with ADAS-driven volumes earlier than other regions that lag on safety-package penetration.
Restraints Impact Analysis
| Restraint | (~) % Impact on CAGR Forecast | Geographic Relevance | Impact Timeline |
|---|---|---|---|
| High energy & feedstock costs in Europe | -1.10% | Germany, Netherlands, Belgium | Short term (≤ 2 years) |
| Automotive demand volatility & supply-chain risk | -0.80% | Germany, France, Italy, Czech Republic | Medium term (2-4 years) |
| Scarcity of high-purity PCR streams | -0.50% | EU-wide, acute in Germany, France | Long term (≥ 4 years) |
| Source: Mordor Intelligence | |||
Automotive demand volatility & supply-chain risk
Semiconductor shortages eased in 2024, but procurement chiefs keep buffer inventories that dampen just-in-time efficiencies. German production slipped low single digits in Q3 2024, hurting polyamide bead call-offs for under-the-hood connectors[1]Covestro, “Financial Highlights Q3 2024,” COVESTRO.COM . EV adoption adds design complexity: battery casings spur demand, yet declining ICE intake manifolds subtract volume in the same factory, complicating capacity planning. Brexit customs protocols lengthen lead times into UK assembly lines, prompting dual-sourcing that dilutes supplier share. Geopolitical tensions over rare-earth magnets threaten traction-motor output, back-propagating uncertainty across polymer coating volumes. Such volatility trims utilization rates in the Europe engineering plastics market until orderbooks stabilize around new drivetrain norms.
Scarcity of high-purity PCR engineering-plastic streams
Consumer-goods curbside systems collect mixed flakes with variable IV and contamination that render them unsuitable for high-stiffness parts. Automotive grades require chlorine below 50 ppm, a purity seldom met by mechanical recyclers. Chemical-recycling startups promise specification-equivalent output, yet only pilot quantities flow today, delaying OEM circularity targets. The EC contemplates design-for-recycling rules that may limit additive packages, but implementation lies several years out, prolonging feedstock tightness within the Europe engineering plastics market.
Segment Analysis
By Resin Type: PET dominance faces specialty-polymer challenge
Polyethylene Terephthalate led the resin stack with a 53.56% volume share in 2025, anchored by beverage and rigid-food packaging that lean on its clarity and barrier properties. This supremacy secures base-load throughput for multilayer bottle blowers across Western Europe, supporting economies of scale that resist displacement. Nonetheless, the Europe engineering plastics market size for Styrene Copolymers is projected to grow 4.97% CAGR as interior trim and infotainment housings switch to matte-surface ABS blends offering low-gloss finishes demanded by premium automakers.
Commodity PET converters broaden portfolios with chemically recycled grades certified via mass balance, defending share against bio-based polyesters that tout lower carbon footprints. Fluoropolymers occupy a niche yet lucrative corridor; ETFE wire coatings withstand 155 °C long-term exposure qualifying them for hybrid-drive harnesses. Polyamide 6 and 66 grades gain from lightweighting, but caprolactam price swings challenge cost parity with polypropylene-glass composites. LCP satisfies micro-LED backplane assemblies thanks to sub-0.04% CTE, a property prized as pixel pitch shrinks. Across these families, recycled and biofeedstock options multiply, signaling an era where sustainability traits rival mechanical performance as selection criteria in the Europe engineering plastics market.

Note: Segment shares of all individual segments available upon report purchase
Get Detailed Market Forecasts at the Most Granular Levels
Download PDF
By End-User Industry: Packaging leadership challenged by electronics growth
Packaging retained 53.98% share in 2025, a testament to entrenched food-grade line assets and synchronized bottle-to-bottle recycling loops across Germany and France. Global CPG majors anchor long-term resin demand through off-take contracts that guarantee rPET supply, safeguarding high-volume flows even in cyclical downturns. However, the electrical & electronics corridor is forecast to log the fastest 5.63% CAGR, propelled by EU ambitions to capture 20% of world chip output and by proliferating consumer wearables that incorporate polymer frames.
The Europe engineering plastics market nurtures mid-sized contract molders specializing in EMI-shielded housings, combining stainless-steel fiber infill with PC-ABS matrices to meet 5G device criteria. Automotive’s polymer consumption plateaus as ICE components sunset, yet battery-pack insulation layers call for flame-retardant PPO and PPS blends. Aerospace additively manufactures PEKK clips certified under FAR25 regulations, nudging the industry toward on-demand spares logistics. Industrial machinery maintains stable uptake, with POM gear wheels replacing machined brass in servo drives, trimming weight and noise. Consequently, sector diversification tempers volatility and underpins steady revenue in the Europe engineering plastics market.
Note: Segment shares of all individual segments available upon report purchase
Get Detailed Market Forecasts at the Most Granular Levels
Download PDF
Geography Analysis
Rest of Europe, aggregating Eastern states, controlled 40.67% of 2025 consumption, underscoring the migration of extrusion and compounding lines to cost-effective Poland, Hungary, and Slovakia. These locations lure German Tier-1s with proximity to OEM plants and access to EU structural funds for automation. Local universities collaborate with resin majors to stand up testing labs, shortening qualification cycles and embedding know-how locally. Logistics corridors via the Adriatic ports cut transit to Mediterranean buyers, reinforcing regional autonomy.
Germany, while yielding volume share, remains the technology heartbeat of the Europe engineering plastics market. Its automotive cluster dictates global compound specifications, and its chemical complexes along the Rhine produce high-purity monomers that feed satellite compounding plants across the continent. Federal subsidies advance electrolysis hydrogen, paving a pathway to lower-carbon adiponitrile for nylon chains. France leverages aerospace gravitas around Toulouse, demanding thermoplastic composite stringers and PEI avionics brackets. National nuclear life-extension programs call for radiation-tolerant PEEK cable sheaths, a small but price-elastic niche.
The United Kingdom, expanding at 4.36% CAGR, capitalizes on sovereign supply-chain policies that redirect defense and satellite contracts toward domestic molders. Government “Made Smarter” grants upgrade robotic injection presses, elevating throughput and offsetting higher labor costs. Free-port customs regimes in Teesside incentivize recyclable-content imports for re-extrusion, feeding a circular export loop back to mainland Europe. Although Brexit adds compliance overhead, agile SMEs exploit their design agility to win bespoke aerospace and medical parts orders, fueling above-average growth in the Europe engineering plastics market.
Competitive Landscape
The Europe engineering plastics market exhibits consolidated concentration. Strategic consolidation defines current rivalry. The EUR 3.7 billion LANXESS–Advent joint venture built from DSM’s Engineering Materials assets now commands roughly EUR 3 billion in sales, paring duplicate SKUs and focusing R&D on high-heat polyamides. Evonik targets EUR 1 billion profit uplift by 2027, heightening emphasis on VESTAKEEP PEEK and sustainable PA12 derived from biogas, which collectively contribute 45% of group sales. Portfolio pruning among conglomerates sees LANXESS exit urethanes entirely, while Covestro re-invests ADNOC takeover premium into chemical-recycling pilots for polycarbonate, diffusing competitive advantage into circularity.
Technology differentiation compounds scale effects. BASF channels digital twin modeling to predict flow-induced fiber orientation, trimming customer mold-trial time by 30% and deepening stickiness. SABIC doubles PEI capacity to cater to data-center liquid-cooling manifolds, absorbing demand swiftly that niche players cannot fulfill. Victrex leverages medical clean-room expansions to lock in long-term orthopedic implant contracts insulated from automotive cycles. Trinseo’s price hikes amid energy turbulence test customer loyalty, but its color-matched ABS library remains unrivaled for infotainment aesthetics.
Sustainability credentials increasingly override purely cost-based selection. LyondellBasell’s mechanical-chemical hybrid recycling hub secures feedstock for OEM take-back programs, promising scope-3 credit allocation that produce designers value[2]LyondellBasell News, LYONDELLBASELL.COM . Arkema invests in CO₂-derived methyl methacrylate pilot plants, anticipating regulation that penalizes fossil-based monomers. Firms lagging on environmental metrics risk specification exclusion as EU public procurement embeds carbon-footprint scoring. Consequently, competitive edge in the Europe engineering plastics market now intertwines material science, circular economics, and scale synergies.
Europe Engineering Plastics Industry Leaders
Arkema
BASF
Covestro AG
LANXESS
Solvay
- *Disclaimer: Major Players sorted in no particular order
Need More Details on Market Players and Competitors?
Download PDF
Recent Industry Developments
- January 2025: BASF's Performance Materials division has fully transitioned all its European sites to renewable electricity, encompassing Engineering Plastics, Polyurethanes, Thermoplastic Polyurethanes, and Specialty Polymers. The focus on sustainability in the engineering plastics market is boosting demand for eco-friendly materials and driving innovation.
- March 2024: Covestro has inaugurated a new production plant at its Antwerp site in Belgium, dedicated to the industrial-scale manufacturing of polycarbonate copolymers. These high-quality plastics have diverse applications, particularly in the electrical, electronics, and healthcare industries.
Europe Engineering Plastics Market Report Scope
Aerospace, Automotive, Building and Construction, Electrical and Electronics, Industrial and Machinery, Packaging are covered as segments by End User Industry. Fluoropolymer, Liquid Crystal Polymer (LCP), Polyamide (PA), Polybutylene Terephthalate (PBT), Polycarbonate (PC), Polyether Ether Ketone (PEEK), Polyethylene Terephthalate (PET), Polyimide (PI), Polymethyl Methacrylate (PMMA), Polyoxymethylene (POM), Styrene Copolymers (ABS and SAN) are covered as segments by Resin Type. France, Germany, Italy, Russia, United Kingdom are covered as segments by Country.By Resin Type
| Fluoropolymer | Ethylenetetrafluoroethylene (ETFE) |
| Fluorinated Ethylene-propylene (FEP) | |
| Polytetrafluoroethylene (PTFE) | |
| Polyvinylfluoride (PVF) | |
| Polyvinylidene Fluoride (PVDF) | |
| Other Sub Resin Types | |
| Liquid Crystal Polymer (LCP) | |
| Polyamide (PA) | Aramid |
| Polyamide (PA) 6 | |
| Polyamide (PA) 66 | |
| Polyphthalamide | |
| Polybutylene Terephthalate (PBT) | |
| Polycarbonate (PC) | |
| Polyether Ether Ketone (PEEK) | |
| Polyethylene Terephthalate (PET) | |
| Polyimide (PI) | |
| Polymethyl Methacrylate (PMMA) | |
| Polyoxymethylene (POM) | |
| Styrene Copolymers (ABS, SAN) |
By End-User Industry
| Aerospace |
| Automotive |
| Building and Construction |
| Electrical and Electronics |
| Industrial and Machinery |
| Packaging |
| Other End-user Industries |
By Geography
| Germany |
| France |
| United Kingdom |
| Italy |
| Russia |
| Rest of Europe |
| By Resin Type | Fluoropolymer | Ethylenetetrafluoroethylene (ETFE) |
| Fluorinated Ethylene-propylene (FEP) | ||
| Polytetrafluoroethylene (PTFE) | ||
| Polyvinylfluoride (PVF) | ||
| Polyvinylidene Fluoride (PVDF) | ||
| Other Sub Resin Types | ||
| Liquid Crystal Polymer (LCP) | ||
| Polyamide (PA) | Aramid | |
| Polyamide (PA) 6 | ||
| Polyamide (PA) 66 | ||
| Polyphthalamide | ||
| Polybutylene Terephthalate (PBT) | ||
| Polycarbonate (PC) | ||
| Polyether Ether Ketone (PEEK) | ||
| Polyethylene Terephthalate (PET) | ||
| Polyimide (PI) | ||
| Polymethyl Methacrylate (PMMA) | ||
| Polyoxymethylene (POM) | ||
| Styrene Copolymers (ABS, SAN) | ||
| By End-User Industry | Aerospace | |
| Automotive | ||
| Building and Construction | ||
| Electrical and Electronics | ||
| Industrial and Machinery | ||
| Packaging | ||
| Other End-user Industries | ||
| By Geography | Germany | |
| France | ||
| United Kingdom | ||
| Italy | ||
| Russia | ||
| Rest of Europe | ||
Need A Different Region or Segment?
Customize Now
Market Definition
- End-user Industry - Packaging, Electrical & Electronics, Automotive, Building & Construction, and Others are the end-user industries considered under the engineering plastics market.
- Resin - Under the scope of the study, consumption of virgin resins like Fluoropolymer, Polycarbonate, Polyethylene Terephthalate, Polybutylene Terephthalate, Polyoxymethylene, Polymethyl Methacrylate, Styrene Copolymers, Liquid Crystal Polymer, Polyether Ether Ketone, Polyimide, and Polyamide in the primary forms are considered. Recycling has been provided separately under its individual chapter.
| Keyword | Definition |
|---|---|
| Acetal | This is a rigid material that has a slippery surface. It can easily withstand wear and tear in abusive work environments. This polymer is used for building applications such as gears, bearings, valve components, etc. |
| Acrylic | This synthetic resin is a derivative of acrylic acid. It forms a smooth surface and is mainly used for various indoor applications. The material can also be used for outdoor applications with a special formulation. |
| Cast film | A cast film is made by depositing a layer of plastic onto a surface then solidifying and removing the film from that surface. The plastic layer can be in molten form, in a solution, or in dispersion. |
| Colorants & Pigments | Colorants & Pigments are additives used to change the color of the plastic. They can be a powder or a resin/color premix. |
| Composite material | A composite material is a material that is produced from two or more constituent materials. These constituent materials have dissimilar chemical or physical properties and are merged to create a material with properties unlike the individual elements. |
| Degree of Polymerization (DP) | The number of monomeric units in a macromolecule, polymer, or oligomer molecule is referred to as the degree of polymerization or DP. Plastics with useful physical properties often have DPs in the thousands. |
| Dispersion | To create a suspension or solution of material in another substance, fine, agglomerated solid particles of one substance are dispersed in a liquid or another substance to form a dispersion. |
| Fiberglass | Fiberglass-reinforced plastic is a material made up of glass fibers embedded in a resin matrix. These materials have high tensile and impact strength. Handrails and platforms are two examples of lightweight structural applications that use standard fiberglass. |
| Fiber-reinforced polymer (FRP) | Fiber-reinforced polymer is a composite material made of a polymer matrix reinforced with fibers. The fibers are usually glass, carbon, aramid, or basalt. |
| Flake | This is a dry, peeled-off piece, usually with an uneven surface, and is the base of cellulosic plastics. |
| Fluoropolymers | This is a fluorocarbon-based polymer with multiple carbon-fluorine bonds. It is characterized by high resistance to solvents, acids, and bases. These materials are tough yet easy to machine. Some of the popular fluoropolymers are PTFE, ETFE, PVDF, PVF, etc. |
| Kevlar | Kevlar is the commonly referred name for aramid fiber, which was initially a Dupont brand for aramid fiber. Any group of lightweight, heat-resistant, solid, synthetic, aromatic polyamide materials that are fashioned into fibers, filaments, or sheets is called aramid fiber. They are classified into Para-aramid and Meta-aramid. |
| Laminate | A structure or surface composed of sequential layers of material bonded under pressure and heat to build up to the desired shape and width. |
| Nylon | They are synthetic fiber-forming polyamides formed into yarns and monofilaments. These fibers possess excellent tensile strength, durability, and elasticity. They have high melting points and can resist chemicals and various liquids. |
| PET preform | A preform is an intermediate product that is subsequently blown into a polyethylene terephthalate (PET) bottle or a container. |
| Plastic compounding | Compounding consists of preparing plastic formulations by mixing and/or blending polymers and additives in a molten state to achieve the desired characteristics. These blends are automatically dosed with fixed setpoints usually through feeders/hoppers. |
| Plastic pellets | Plastic pellets, also known as pre-production pellets or nurdles, are the building blocks for nearly every product made of plastic. |
| Polymerization | It is a chemical reaction of several monomer molecules to form polymer chains that form stable covalent bonds. |
| Styrene Copolymers | A copolymer is a polymer derived from more than one species of monomer, and a styrene copolymer is a chain of polymers consisting of styrene and acrylate. |
| Thermoplastics | Thermoplastics are defined as polymers that become soft material when it is heated and becomes hard when it is cooled. Thermoplastics have wide-ranging properties and can be remolded and recycled without affecting their physical properties. |
| Virgin Plastic | It is a basic form of plastic that has never been used, processed, or developed. It may be considered more valuable than recycled or already used materials. |
Need More Details on Market Definition?
Ask a Question
Research Methodology
Mordor Intelligence follows a four-step methodology in all our reports.
- Step-1: Identify Key Variables: The quantifiable key variables (industry and extraneous) pertaining to the specific product segment and country are selected from a group of relevant variables & factors based on desk research & literature review; along with primary expert inputs. These variables are further confirmed through regression modeling (wherever required).
- Step-2: Build a Market Model: In order to build a robust forecasting methodology, the variables and factors identified in Step-1 are tested against available historical market numbers. Through an iterative process, the variables required for market forecast are set and the model is built on the basis of these variables.
- Step-3: Validate and Finalize: In this important step, all market numbers, variables and analyst calls are validated through an extensive network of primary research experts from the market studied. The respondents are selected across levels and functions to generate a holistic picture of the market studied.
- Step-4: Research Outputs: Syndicated Reports, Custom Consulting Assignments, Databases & Subscription Platforms

Get More Details On Research Methodology
Download PDF


