
Market Overview
| Study Period | 2021 - 2031 |
|---|---|
| Market Volume (2026) | 47.70 kilotons |
| Market Volume (2031) | 62.26 kilotons |
| Growth Rate (2026 - 2031) | 5.47 % |
| Fastest Growing Market | Asia Pacific |
| Largest Market | Asia Pacific |
| Market Concentration | Medium |
Major Players *Disclaimer: Major Players sorted in no particular order Image © Mordor Intelligence. Reuse requires attribution under CC BY 4.0. | |
Iodine Market Analysis by Mordor Intelligence
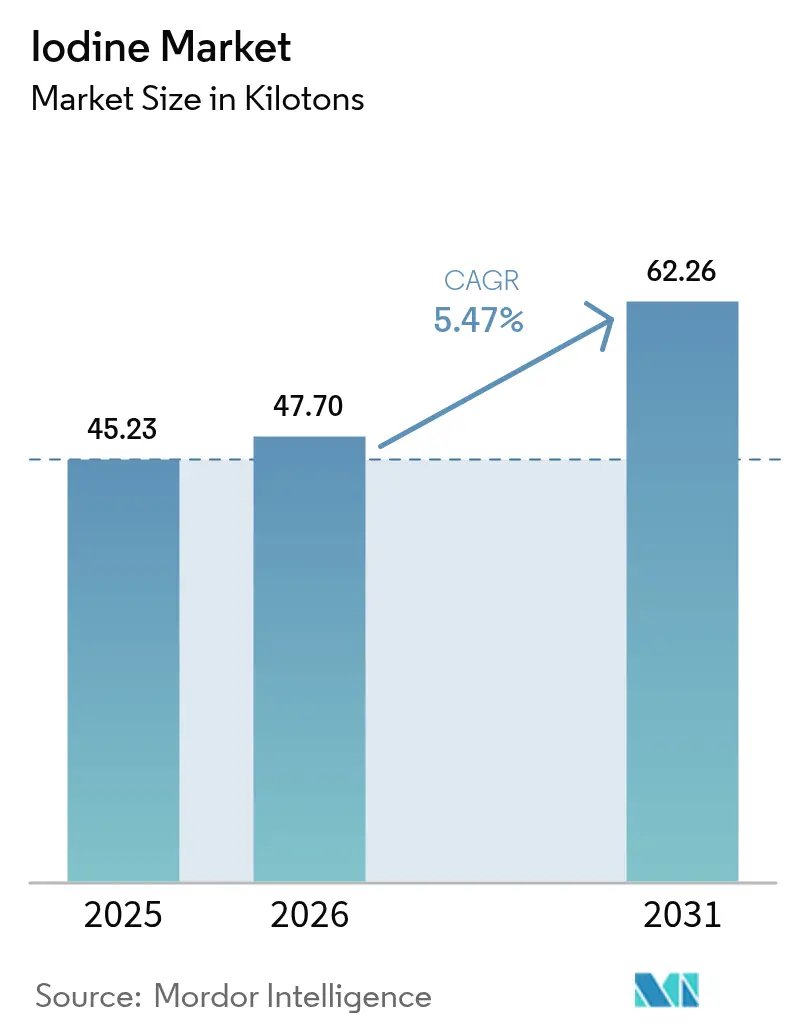
The Iodine Market size is projected to expand from 45.23 kilotons in 2025 and 47.70 kilotons in 2026 to 62.26 kilotons by 2031, registering a CAGR of 5.47% between 2026 to 2031. Structural shifts are broadening demand beyond traditional pharmaceuticals and nutrition, most notably toward low-carbon fluorochemical catalysts and next-generation aqueous battery electrolytes that position iodine as a critical enabler of decarbonization strategies. Spot prices climbed 40% in 2024 to USD 38,000 per ton as Chilean caliche output tightened, signaling sustained supply risk for buyers that lack long-term contracts. Underground brine operators are scaling proprietary extraction technologies to mitigate weather-driven volatility, while closed-loop recycling programs in Europe and Japan are beginning to recapture medical-grade molecules, albeit at modest volumes. Grid-scale zinc-iodine batteries that deliver more than 10,000 charge–discharge cycles are moving from laboratory proof-of-concept toward industrial pilots, underpinning a potential step-change in industrial offtake during the latter half of the forecast period.
Key Report Takeaways
- By source, caliche ore held 50.88% of the iodine market share in 2025, while underground brine extraction is projected to expand at a 5.56% CAGR through 2031.
- By form, organic compounds accounted for 48.23% of the iodine market size in 2025; inorganic salts and complexes represent the fastest-growing form segment at a 5.68% CAGR through 2031.
- By end-user industry, the medical segment captured 46.93% of 2025 volume and is advancing at a 5.66% CAGR through 2031.
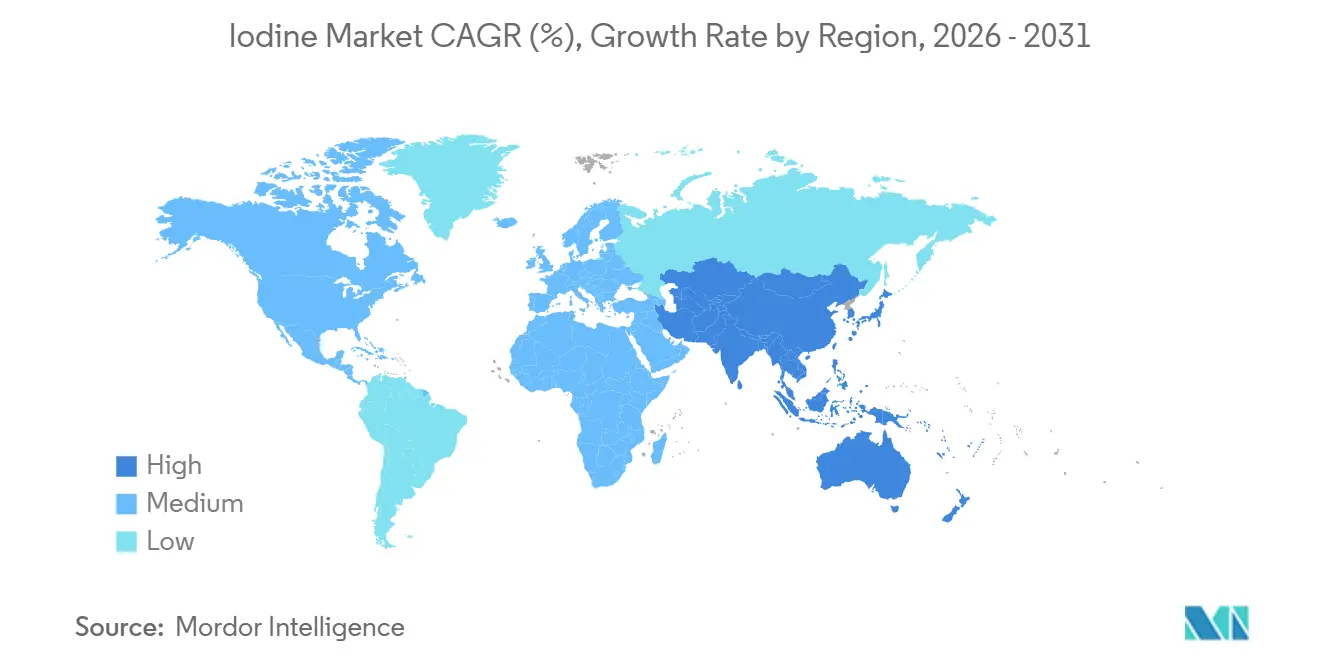
- By geography, Asia-Pacific commanded 34.31% of 2025 demand and is outpacing all regions with a 6.89% CAGR through 2031.
Note: Market size and forecast figures in this report are generated using Mordor Intelligence’s proprietary estimation framework, updated with the latest available data and insights as of 2026.
Market Trends and Insights
Drivers Impact Analysis of Iodine Market*
| Driver | (~) % Impact on CAGR Forecast | Geographic Relevance | Impact Timeline |
|---|---|---|---|
| Rising Demand for X-Ray/CT Contrast Media | +1.2% | Global, with concentration in North America, Europe, and urban Asia-Pacific | Medium term (2-4 years) |
| Government-Mandated Salt Iodization Programs | +0.8% | Global, particularly India, Sub-Saharan Africa, Southeast Asia | Long term (≥ 4 years) |
| Expansion of LCD/OLED Polarizer Film Manufacturing | +0.9% | Asia-Pacific core (China, South Korea, Japan), spill-over to North America | Short term (≤ 2 years) |
| Rapid Adoption of Iodine-Based Electrolytes in Next-Gen Aqueous Batteries | +1.4% | Global, early adoption in China, US, EU for grid-scale storage | Medium term (2-4 years) |
| Regulatory Push for Low-Carbon Fluorochemical Routes That Require Iodine Catalysts | +0.6% | North America and EU, with emerging interest in Japan | Long term (≥ 4 years) |
| Source: Mordor Intelligence | |||
Rising Demand for X-Ray/CT Contrast Media
Roughly 75 million diagnostic exams per year use iodinated contrast agents, and about 48% of U.S. CT scans require contrast enhancement. GE Healthcare invested USD 30 million in its Cork, Ireland plant during 2024 to secure additional supply as global contrast demand is expected to double within a decade. Photon-counting CT technology lowers per-patient iodine usage by around 10% per 5 keV energy bin, yet absolute volumes keep rising as screening programs expand. SQM signed multi-year feedstock contracts with pharmaceutical intermediaries to lock in medical-grade output at premium pricing, insulating revenue from commodity swings. The WHO lists iodinated contrast agents on its essential medicines inventory, guaranteeing baseline procurement even in low-income health systems.
Government-Mandated Salt Iodization Programs
Roughly 88% of households used iodized salt in 2024, up from 86% in 2020, yet more than 2 billion people remain at risk of deficiency. India’s 2024 mandate for double fortification with iodine and iron has lifted per-kilogram iodine loading, expanding the iodine market across rural retail channels. Southeast Asian and Sub-Saharan regulators are tightening compliance audits, raising the technical threshold for suppliers that must now document ISO 9001 traceability. Low-purity grades funneled into fortification create a price floor that stabilizes producer cash flows during cyclical downturns in higher-spec segments. UNICEF’s bulk procurement favors vendors with proven logistics, elevating barriers for small regional entrants.
Expansion of LCD/OLED Polarizer Film Manufacturing
Iodine-doped polyvinyl alcohol enables the dichroic polarizing layer in LCD and OLED displays at concentrations up to 5 mol %. Kuraray is adding 38 million m² of optical-grade PVA film capacity, supporting growth in large-screen TVs and automotive cockpit displays. ISE Chemicals estimates polarizer films already absorb roughly 8% of global iodine, and share is expected to grow as foldable phones and augmented-reality headsets scale. China controls over half of global LCD capacity, concentrating demand in Guangdong and Jiangsu where proximity to Japanese and Chilean supply chains trims freight costs. South Korean panel makers protect margins through proprietary iodine purification, preserving long-term contracts over volatile spot purchases.
Regulatory Push for Low-Carbon Fluorochemical Routes
Iodine catalyzes isomerization steps in low-GWP fluorochemical manufacturing, a pathway favored by the EU F-Gas phase-down and Kigali Amendment compliance schedules. Organoiodine mediators in electrocatalytic chlorination reduce greenhouse emissions compared with chlorine-intensive sequences. Producers that retrofit plants to iodine-enabled flows boost ISO 14001 scores, gaining procurement preference from automotive and refrigeration OEMs. NREL estimates about 16% of iodine now serves industrial catalysis, a share likely to rise as petrochemical decarbonization accelerates[1]. Because capex cycles exceed 4 years, the demand inflection is back-loaded but already visible in multiyear supply agreements.
Restraints Impact Analysis of Iodine Market*
| Restraint | (~) % Impact on CAGR Forecast | Geographic Relevance | Impact Timeline |
|---|---|---|---|
| Volatile Pricing Linked to Chilean Caliche Output Swings | -0.9% | Global, with acute exposure in Asia-Pacific and North America import-dependent markets | Short term (≤ 2 years) |
| Toxicity and Specialised Handling Costs for Bulk Iodine | -0.5% | Global, particularly affecting smaller distributors and emerging-market buyers | Medium term (2-4 years) |
| Tightening EU Limits on Residual Iodine in Dairy Products | -0.3% | Europe, with indirect effects on global animal feed formulation practices | Long term (≥ 4 years) |
| Source: Mordor Intelligence | |||
Volatile Pricing Linked to Chilean Caliche Output Swings
Chile supplies roughly 60% of world iodine, and 2024 precipitation events in the Atacama Desert curtailed ore processing, pushing spot prices to USD 38,000 t⁻¹ from USD 27,000 t⁻¹ the prior year. Asia-Pacific buyers face 8–12-week transit windows, and strategic stockpiles seldom exceed 60 days, magnifying volatility. Underground brine output is scaling at a 5.56% CAGR but remains an order of magnitude smaller than caliche, limiting near-term diversification. Producers with long-term offtake contracts are better cushioned, yet converters in contrast media and catalysts report margin compression when spot jumps exceed USD 5,000 t⁻¹. Weather risk and nitrate-mining cycles therefore remain the leading supply-side drag on the iodine market.
Toxicity and Specialized Handling Costs for Bulk Iodine
Elemental iodine sublimes and is corrosive, necessitating UN 3077 hazardous-goods routing and OSHA ceiling exposure of 0.1 ppm[2]. Logistics premiums average 15-20% above non-hazardous chemicals, an outsized burden for small distributors that lack dedicated ventilation or storage. ISE Chemicals’ ISEFLO prills cut dust yet command a 5-10% surcharge, forcing price-sensitive buyers into a quality-cost dilemma. Carriers with hazmat certifications are in short supply across South Asia and Sub-Saharan Africa, extending lead times. These frictions consolidate share among large incumbents and cap penetration in emerging use cases unless safer derivatives gain traction.
*Our forecasts treat driver/restraint impacts as directional, not additive. The impact forecasts reflect baseline growth, mix effects, and variable interactions.
Iodine Market Segment Analysis
By Source:
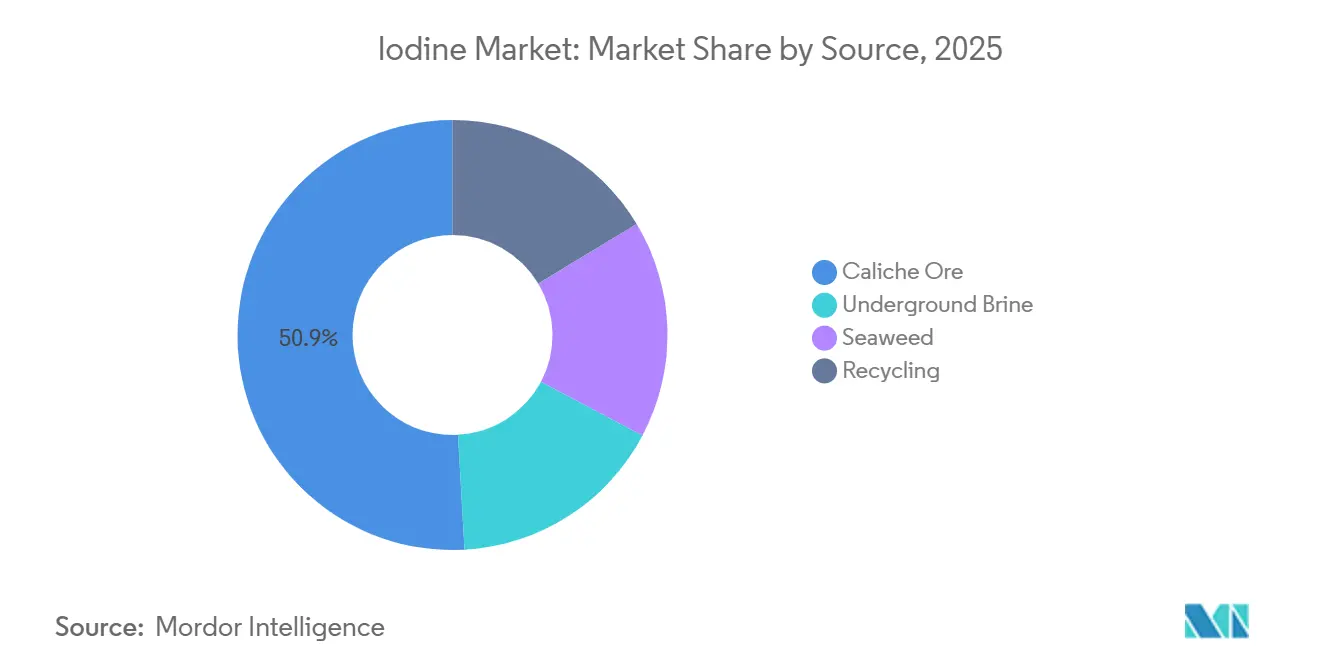
Brine Extraction Outpaces Legacy CalicheCaliche ore still held 50.88% of the iodine market share in 2025, anchored by SQM’s 16,200 t output, yet underground brine is growing faster at a 5.56% CAGR, reflecting end-users’ pursuit of supply diversity. The iodine market size attributable to brine is projected to rise as operators such as Iofina commission new wells in the U.S. Permian Basin.
Brine production bypasses nitrate-mining cycles and exploits flowback water that would otherwise be reinjected, lowering marginal extraction costs despite iodine grades below 0.1 g L⁻¹. Japanese firms extracting brine at roughly 1,000-fold seawater concentration supply 30% of global volume, proving commercial viability. Recycling—led by GE Healthcare’s take-back network—recovered 18% of iodine used in contrast agents during 2025, signaling white-space for closed-loop growth. Seaweed now accounts for low supply because of labor intensity and low yields.

By Form:
Organic Compounds Lead, Inorganic Salts AccelerateOrganic compounds captured 48.23% of the iodine market size in 2025 as tri-iodinated contrast media and povidone-iodine antiseptics dominated value-added consumption. In contrast, inorganic salts and complexes are advancing at a 5.68% CAGR, buoyed by mandatory fortification schemes.
The iodine market share of elementals and isotopes remains low but commands high price points in nuclear medicine. Feed-grade ethylenediamine dihydroiodide supports dairy fertility. Rising environmental scrutiny is steering some formulators toward organic complexes with improved uptake, adding complexity to procurement strategies.
By End-user Industry:
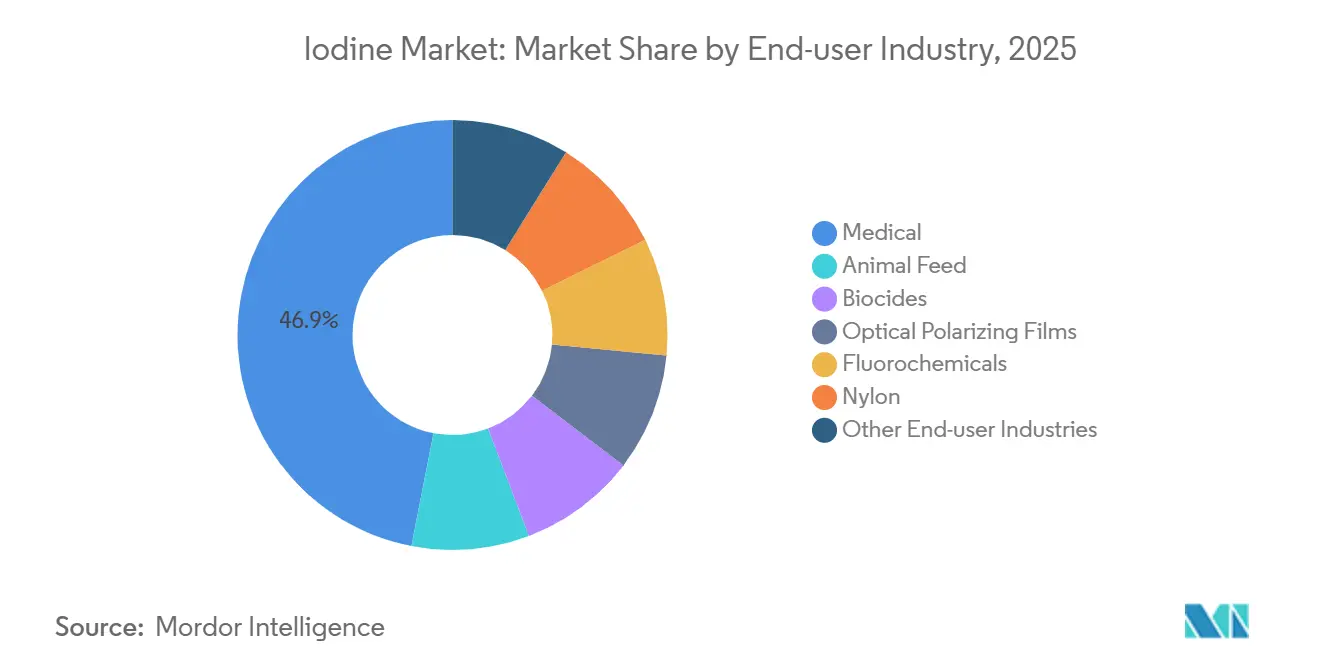
Medical Segment Sustains LeadershipThe medical segment captured 46.93% of the iodine market share in 2025 on the back of roughly 75 million annual diagnostic exams that rely on contrast agents, and it is set to advance at a 5.66% CAGR through 2031. Within this segment, GE Healthcare’s USD 30 million expansion in Cork underpins rising demand as photon-counting CT scanners enter service across North America and Europe, reducing per-exam dosage but widening overall procedure counts.
Animal feed is absorbing ethylenediamine dihydroiodide and potassium iodide at roughly 0.35–0.8 mg kg⁻¹ inclusion rates for poultry and dairy cattle, yet tightening EU residue caps on milk are curbing growth prospects in Europe. Display manufacturing is growing as iodine-doped polyvinyl alcohol films scale with larger televisions, automotive clusters and foldable phones, helped by Kuraray’s 38 million m² annual capacity addition. Catalysts used in low-carbon fluorochemical routes consume about 16% of global iodine, a proportion that is expected to edge higher as industrial emitters retrofit plants in response to the Kigali Amendment. Biocides such as povidone-iodine maintain demand in hospital and consumer antiseptics, having shown 99.99% virucidal efficacy against SARS-CoV-2 at 0.5% strength.
Geography Analysis
APAC Iodine Market
Asia-Pacific led the iodine market with 34.31% of world demand in 2025 and is expanding at a 6.89% CAGR through 2031. China’s LCD polarizer film production and India’s double-fortified salt program underpin the region’s volume gains. Japan, sourcing brine at 0.1 g L⁻¹, remains a pivotal supplier to downstream processors across the bloc.
North America and Europe Iodine Market
North America benefits from rising brine output, notably Iofina’s additional 170-220 t yr⁻¹ Permian plant slated for H2 2026. Europe remains contrast-media-centric; GE Healthcare’s Cork expansion reinforces supply security yet faces headwinds from stricter dairy residue caps.
South America and Africa Iodine Market
South America supplies majority of global iodine via Chilean caliche, but weather disruptions and water scarcity inject volatility. UNICEF-led iodization drives incremental demand across Sub-Saharan Africa, though logistics barriers persist.
Regulatory Landscape
Iodine production, trade, and use sit within chemical registration, hazardous transport, workplace exposure, and sector-specific rules that vary by region. In the European Union, iodine (EC 231-442-4) and key derivatives (for example, potassium iodide and iodine monochloride) are included in the European Chemicals Agency (ECHA) REACH registration dossiers, which shapes data submissions and compliance expectations for importers and downstream formulators. In the United States, operational compliance covers environmental controls such as EPA effluent guidelines for iodine production under 40 CFR Part 415 Subpart AQ, alongside worker-safety requirements where NIOSH and OSHA guidance and exposure limits inform engineering controls for bulk handling.
On the demand side, public-health policy supports baseline iodine use through salt iodization programs and institutional procurement, while pharmaceutical-grade supply remains constrained by quality, traceability, and controlled distribution practices. National import and compliance portals such as the Philippine National Trade Repository (PNTR) reflect the multi-agency nature of iodine trade oversight, spanning customs, health, and environmental documentation. At the same time, climate and industrial policy influence downstream consumption, including regulatory push for low-GWP fluorochemical routes aligned with the EU F-gas phase-down and the Kigali Amendment, where iodine is used as a catalyst in select process steps.
Value Chain Analysis
The iodine value chain starts with upstream recovery from caliche ore in Chile and underground brines linked to natural gas or oilfield produced water in Japan and the United States, followed by refining to crystalline iodine and conversion into higher-value derivatives such as iodides, iodophors, and organoiodine intermediates. Supply concentration is a defining feature: Chile leads global output from Atacama caliche operations, Japan is a major brine-based producer (including regions such as Chiba and Niigata), and the United States contributes through brine wells in northwestern Oklahoma. At the producer level, SQM anchors large-scale Chilean caliche supply, and it has highlighted infrastructure upgrades at Nueva Victoria, including a seawater pipeline tied to capacity and operational resilience.
Midstream processing and distribution are shaped by hazmat logistics, purity certification, and contract structures, with closed-loop recovery playing a growing role as medical imaging waste streams can be reclaimed and refined. Downstream, the largest pull-through applications include iodinated contrast media and pharmaceuticals, salt fortification that often requires large-volume, lower-spec iodates/iodides, optical polarizing films for LCD/OLED supply chains, and industrial catalysts for fluorochemicals. Key bottlenecks and cost drivers include water constraints and permitting for Chilean caliche, dependence on oil and gas brine availability for U.S. production, long lead-time shipping to Asia-Pacific importers, and handling requirements for corrosive, subliming elemental iodine that increase storage and freight costs.
Competitive Landscape
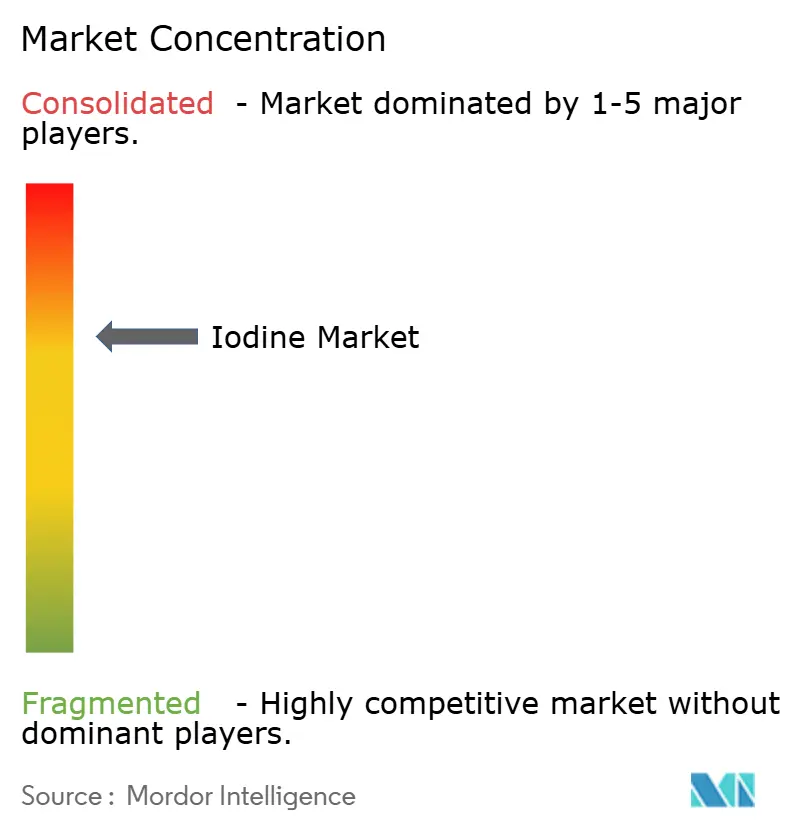
Chile and Japan jointly deliver majority of supply, yet SQM’s 30% individual share leaves room for mid-tier players, producing a moderately concentrated iodine market. Iofina’s WET IOsorb technology exemplifies how brine innovation can erode caliche dominance and unlock regional offtake integration. GE Healthcare’s material-take-back scheme points to circular-economy models that may become differentiators in pharmaceutical procurement.
Technology is a key moat: ISE Chemicals markets prilled formats that lower dust exposure, while GODO SHIGEN specializes in high-purity reclamation from waste streams. The absence of cross-border mega-mergers suggests partnerships and licensing will shape the competitive map more than consolidation. Emergent battery players could realign the demand profile if grid storage achieves mass deployment.
Iodine Industry Leaders
-
Cosayach
-
Iofina plc
-
SQM
-
Algorta Norte S.A.
-
GODO SHIGEN Co., Ltd.
- *Disclaimer: Major Players sorted in no particular order
Iodine Market Companies Covered in this Report
- Algorta Norte S.A.
- Calibre Chemicals Pvt. Ltd.
- Cosayach
- Deep Water Chemicals
- Eskay Iodine
- Glide Chem Private Limited
- GODO SHIGEN Co., Ltd.
- Infinium Pharmachem Limited
- Iochem Corporation
- Iofina plc
- ISE CHEMICALS CORPORATION
- K&O Energy Group Inc.
- Nippoh Chemicals Co. Ltd
- Parad Corporation Pvt Ltd
- Proto Chemical Industries
- Salvi Chemical Industries Ltd
- Samrat Pharmachem Limited
- SQM
- TOHO EARTHTECH,INC
- Woodward Iodine LLC
Market Opportunities and Future Outlook
One opportunity area is supply diversification through iodine recovery from oilfield produced water in the United States, where partnerships with water infrastructure providers reduce development friction and shorten routes to incremental supply. In June 2026, Select Water Solutions and ISE Chemicals Corporation signed a definitive agreement to develop commercial iodine extraction and refining facilities across Texas, New Mexico, and Oklahoma, pointing to broader industrialization of produced-water iodine beyond single-operator models. Over the same period, Iofina expanded its Oklahoma brine supply arrangements to lift output at an existing plant (IO#11) and continued work on its Permian Basin IO#12 project with Western Midstream, reinforcing the move toward contract-secured brine access and modular IOsorb deployments.
On the demand side, the market has whitespace in higher-value, specification-driven uses where continuity of medical-grade supply, traceability, and recycling can differentiate suppliers amid price volatility. GE Healthcare has already scaled take-back and recycling networks in contrast media, and similar circular models can support tighter supply assurance for hospitals and pharmaceutical intermediates. In Chile, brownfield extensions and water infrastructure upgrades provide another pathway, with Cosayach securing an environmental approval in June 2026 for a project at its Cala-Cala facility to support operational continuity through 2033, and SQM commissioning seawater pipeline infrastructure at Nueva Victoria during 2026. Both reflect a producer focus on sustained, compliant output from the dominant caliche source base.
Recent Industry Developments in Iodine Market
- July 2026: Iofina plc reported record first-half 2026 crystalline iodine production of 393.3 metric tonnes, up 29% year over year. The update showed how brine-sourced IOsorb operations can respond quickly to tight markets and provide buyers with a non-Chilean supply option under long-term arrangements.
- December 2025: Iofina plc partnered with Western Midstream to build a new IOsorb plant in the Permian Basin between western Texas and southeastern New Mexico. The project added 170-220 t/yr of iodine capacity and targeted around 50,000 barrels per day of brine processing, strengthening North American supply resilience tied to produced-water infrastructure.
- September 2024: Iofina plc commissioned its IO#10 WET IOsorb extraction plant in Oklahoma to increase iodine production from oil and gas brines. The facility added about 100-150 metric tonnes per year of crystalline iodine capacity, reinforcing the companys multi-plant network approach to incremental, modular supply growth.
Iodine Market Report Scope and Research Methodology
Market Definition and Coverage
In this methodology, the iodine market covers the supply and demand of iodine as a chemical raw material used across healthcare, animal nutrition, and industrial applications. We track it at the point where iodine is produced and sold as elemental iodine, or converted into standard iodine salts.
Scope exclusions: We exclude finished consumer iodized salt products and radioactive iodine used as medical isotopes.
Segments Covered in This Report
- By Source
- Caliche Ore
- Underground Brine
- Seaweed
- Recycling
- By Form
- Organic Compounds
- Elementals and Isotopes
- Inorganic Salts and Complexes
- By End-user Industry
- Medical (X-ray contrast media, pharmaceuticals, iodophors and povidone-iodine)
- Animal Feed
- Biocides
- Optical Polarizing Films
- Fluorochemicals
- Nylon
- Other End-user Industries
- By Geography
- Asia-Pacific
- China
- Japan
- India
- South Korea
- Rest of Asia-Pacific
- North America
- United States
- Canada
- Mexico
- Europe
- Germany
- United Kingdom
- France
- Italy
- Rest of Europe
- South America
- Brazil
- Argentina
- Rest of South America
- Middle-East and Africa
- Saudi Arabia
- South Africa
- Rest of Middle-East and Africa
- Asia-Pacific
Data Sources, Market Sizing, and Validation
Desk Research
Desk work started with building a supply map around natural iodine sources and the way the material is processed into tradeable grades, since the iodine market is constrained by a small producer base. Public sources such as the USGS mineral commodity summaries, national mining and industrial statistics (for example, Chile and Japan), UN Comtrade trade flows, and customs tariff schedules were used to cross-check import and export direction by region.
To connect volume with value, we also tracked spot and contract-linked iodine price references reported in reputed press and association updates, and we reviewed company filings and investor presentations to understand capacity additions, shutdowns, and product mix (elemental versus salts). In a few places, we used paid subscriptions for company financials and intelligence, patent databases, and shipment-level import and export records to sanity check producer footprints and trading patterns. These desk research sources are illustrative only, and many other public and proprietary references were used to collect, validate, and clarify inputs.
Primary Interviews and Surveys
Primary work focused on conversations with producers, distributors, and downstream buyers in medical, animal feed, biocides, and industrial intermediates, so assumptions on conversion yields and pricing could be corrected with real purchasing behavior. These discussions also helped validate how demand shifts with contrast media volumes, feed supplementation rates, and electronics-related iodine compounds, before finalizing regional splits across APAC, EMEA, and the Americas.
Distribution of primary research fieldwork respondents
| Company type | Respondent position | Region |
|---|---|---|
| Top tier: 35% | CXOs: 17% | APAC: 46% |
| Mid tier: 47% | Functional/Unit leaders: 29% | EMEA: 30% |
| Smaller Players: 18% | Managers: 54% | Americas: 24% |
Market-Sizing & Forecasting
Sizing was built primarily from a top-down approach where production, trade, and apparent consumption signals were reconstructed by region, then split into major use pools using adoption and usage rates shared by industry participants. After laying out the demand pool, we used selective bottom-up approximations to keep totals realistic, including sampled volume by grade multiplied by observed price ranges and distributor channel checks where direct producer visibility was limited.
Key model inputs included iodine spot and contract price direction, producer capacity and utilization changes, import and export balances, conversion shares from elemental iodine into common salts, and end-use indicators such as imaging procedure activity, feed supplementation norms, and industrial chemical demand linked to electronics and biocides. For forecasting, scenario analysis was applied with a base case guided by expert expectations on capacity expansions, price normalization, and application growth, and then stress-tested with tighter supply and softer demand cases to see whether the outputs stayed within practical bounds. When bottom-up visibility was thin in a country, we filled the gap using trade-based consumption proxies and then checked the result against known downstream production clusters shared in interviews.
Data Validation & Update Cycle
Validation was handled in several passes, starting with matching modeled volumes and values against independent signals such as production announcements, trade movements, and price trend breaks that would typically appear if the market truly shifted. Outliers were reviewed at the country and application level, and the assumptions behind them were rechecked with follow-up calls when they did not align with supply constraints or demand indicators.
Before sign-off, the full model and the written story undergo a separate analyst review so calculation logic and unit conversions remain consistent. The report is refreshed annually, with interim updates made when material events occur, such as a major capacity change, a sharp price shock, or a policy move affecting medical or feed usage. Right before delivery, we complete a final pass to confirm that recent data points do not materially change the conclusions.
Mordor Intelligence's Iodine Market Size Compared With Other Published Estimates
Market size numbers for iodine can look far apart because some publishers size volume only, others size revenue, and some combine iodine with broader iodine compounds without stating the boundary clearly. Timing also matters, since iodine prices can move fast, and different average price windows can change the value outcome even if the tonnage is similar.
Trade balances and spot price movements act as the checks that tie Mordor Intelligence's estimate to a clearly defined iodine demand pool, kept consistent by counting elemental iodine and standard salts as the core market. The biggest gaps seen in other figures usually come from folding in higher-value derivative chains, using different price averaging assumptions across the year, and applying longer forecast curves without revalidating capacity utilization changes.
Benchmark comparison
| Source | Market Size | Gaps in Research Methodology |
|---|---|---|
| Mordor Intelligence | USD 2.06 B (2026) | |
| Global Consultancy A | USD 3.21 B (2026) | Uses a wider scope that explicitly includes iodine compounds alongside elemental iodine, which lifts the value because compound pricing and product mix are not treated as a separate boundary. |
| Trade Journal B | USD 1.82 B (2024) | Uses an earlier year with a different price environment and does not clarify the price averaging method, which can understate value during periods when contract prices reset upward. |
Looking across the table, most of the spread is explained by what is counted as in-scope iodine material and how the average price level is applied to convert tons into dollars. By keeping scope tight and checking results against trade, capacity, and price signals, we can deliver a practical number that clients can trace back to real market drivers and repeat each year.
Key Questions Answered in the Report
How fast is iodine demand growing in medical imaging?
The medical segment is advancing at a 5.66% CAGR through 2031 and already represents 46.93% of global volume.
What is the main supply risk for buyers today?
Weather-related disruptions to Chilean caliche mines can swing spot prices by more than 40%, making geographic concentration the top risk factor.
Will underground brine replace caliche as the leading source?
Brine extraction is growing faster, yet caliche still holds over half of global volume; meaningful parity is unlikely before 2031.
How might zinc-iodine batteries influence future demand?
If the chemistry secures even 5% of projected grid-storage deployments by 2030, iodine demand could rise by roughly 3,000 t yr⁻¹.
What is current market size of Iodine Market?
The Iodine Market size is projected to expand from 45.23 kilotons in 2025 and 47.70 kilotons in 2026 to 62.26 kilotons by 2031, registering a CAGR of 5.47% between 2026 to 2031.