
Market Overview
| Study Period | 2020 - 2031 |
|---|---|
| Market Size (2026) | USD 35.82 Billion |
| Market Size (2031) | USD 43.78 Billion |
| Growth Rate (2026 - 2031) | 4.10 % |
| Fastest Growing Market | Middle East and Africa |
| Largest Market | Asia-Pacific |
| Market Concentration | Medium |
Major Players *Disclaimer: Major Players sorted in no particular order Image © Mordor Intelligence. Reuse requires attribution under CC BY 4.0. | |
Crane Market Analysis by Mordor Intelligence
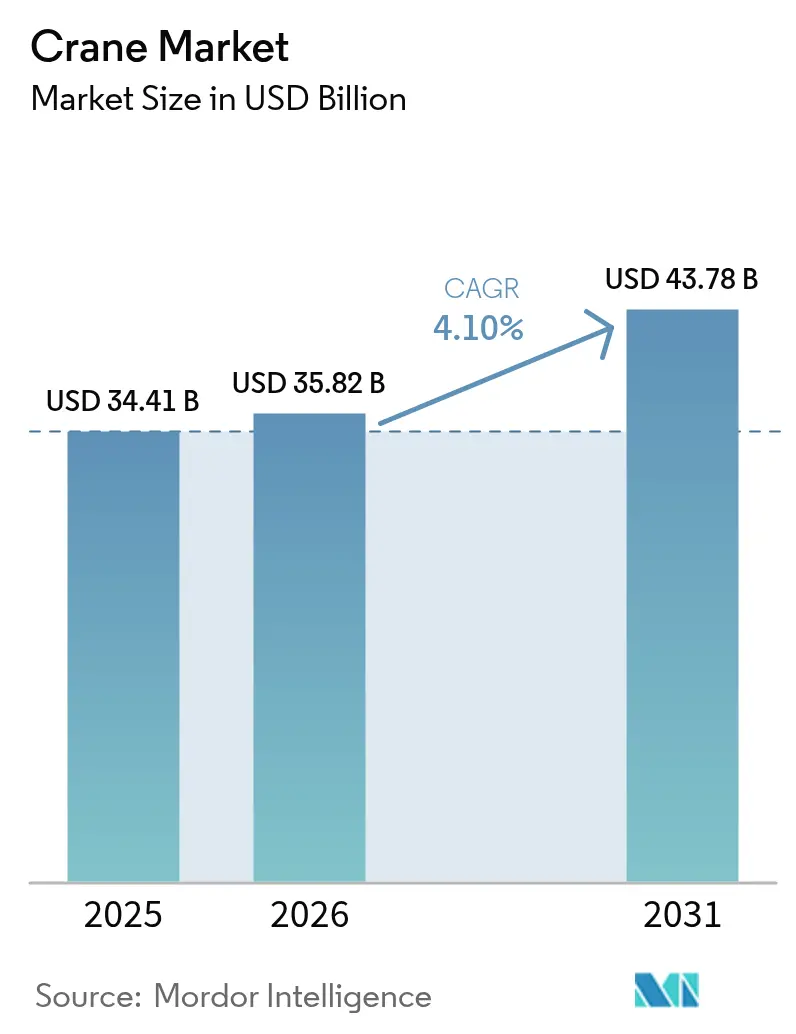
The crane market size is expected to grow from USD 34.41 billion in 2025 to USD 35.82 billion in 2026 and is forecast to reach USD 43.78 billion by 2031 at 4.10% CAGR over 2026-2031. Stable public spending, large-scale private megaprojects, and the global shift to renewable energy form the core demand engine for the crane market. Government infrastructure programs, led by the U.S. Infrastructure Investment and Jobs Act, have created multi-year backlogs that shield contractors from short-term economic swings. Offshore wind, solar parks, and grid upgrades reinforce this positive outlook, especially for specialized heavy-lift and marine equipment. Concurrently, electrification mandates spur investment in hybrid and fully electric cranes, while telematics adoption raises fleet utilization and curbs downtime. Competition intensifies as incumbents accelerate R&D on zero-emission platforms and acquire niche innovators to broaden portfolios.
Key Report Takeaways
- Mobile cranes led the market by type with 44.82% of the share in 2025, whereas marine and offshore cranes are forecast to grow at a 7.12% CAGR by 2031.
- By capacity, the 51-150 ton range accounted for 33.60% of the crane market's size in 2025; capacities above 300 tons are projected to expand at 7.78% CAGR between 2026 and 2031.
- By power source, diesel commanded 79.55% of the crane market size in 2025, while fully electric cranes are advancing at a 13.85% CAGR through 2031.
- Telescopic systems held a 54.85% revenue share by boom type in 2025 in the crane market, while lattice boom cranes are set to record a 5.72% CAGR by 2031.
- By application, construction and mining contributed 49.35% to 2025 revenue, whereas energy and utilities applications are poised for the highest 8.41% CAGR by 2031.
- By geography, Asia-Pacific captured 41.70% of 2025 revenue, while the Middle East and Africa region is expected to rise at a 6.38% CAGR during 2026-2031.
Note: Market size and forecast figures in this report are generated using Mordor Intelligence’s proprietary estimation framework, updated with the latest available data and insights as of 2026.
Global Crane Market Trends and Insights
Drivers Impact Analysis*
| Driver | (~) % Impact on CAGR Forecast | Geographic Relevance | Impact Timeline |
|---|---|---|---|
| Growing Infrastructure Development | +1.2% | Global, with concentration in North America and Asia Pacific | Long Term (≥ 4 Years) |
| Surge in Renewable Energy Installations | +1.0% | Global, led by Europe and North America Offshore | Long Term (≥ 4 Years) |
| Industrial Growth Across Emerging Economies | +0.8% | Asia Pacific Core, Spill-Over to MEA | Medium Term (2–4 Years) |
| Accelerated Urbanization and Megaproject Pipelines | +0.7% | MEA, Asia Pacific Urban Centers | Medium Term (2–4 Years) |
| Adoption of Hybrid/E-Cranes for Emission Compliance | +0.5% | California, EU, Expanding Globally | Medium Term (2–4 Years) |
| Telematics-Driven Fleet Optimization | +0.3% | North America and EU Early Adopters | Short Term (≤ 2 Years) |
| Source: Mordor Intelligence | |||
Growing Infrastructure Development
Infrastructure modernization has emerged as the primary catalyst for crane demand, with the Infrastructure Investment and Jobs Act alone generating over USD 1.2 trillion in planned investments across transportation, energy, and digital infrastructure. The scale of this infrastructure push extends beyond traditional road and bridge projects to encompass data centers, semiconductor fabs, and clean energy facilities that require specialized heavy-lifting capabilities. Construction spending is projected to reach USD 2.13 trillion annually, with public infrastructure accounting for nearly 8% year-over-year growth[1]. This infrastructure renaissance creates multi-year visibility for crane operators, extending project backlogs well into 2027. The shift toward modular construction techniques in infrastructure projects also drives demand for precision lifting equipment capable of handling prefabricated components weighing hundreds of tons. Federal infrastructure funding has enabled states to invest in workforce development programs, addressing the critical shortage of certified crane operators that could otherwise constrain market growth.
Surge in Renewable Energy Installations
The renewable energy transition fundamentally reshapes crane market dynamics, with offshore wind installations driving demand for specialized marine cranes capable of lifting turbine components exceeding 2,500 tons. Wind turbine installation vessels are being delivered with increasingly sophisticated crane systems, including Cadeler's Wind Peak vessel, capable of transporting seven complete 15 MW turbine sets per load. The scale of renewable energy deployment is unprecedented, with companies like Huisman developing specialized offshore wind installation cranes and motion-compensated platforms to handle components at heights exceeding 150 meters. Solar installations drive demand for mobile cranes, particularly in utility-scale projects where panels and mounting systems require precise positioning across vast areas. The growth of the renewable energy sector is creating new crane application categories, from floating offshore wind platforms to concentrated solar power installations requiring specialized lifting solutions. This energy transition is expected to sustain crane demand growth well beyond traditional construction cycles, as renewable energy infrastructure requires ongoing maintenance and component replacement.
Industrial Growth Across Emerging Economies
Emerging economies are experiencing a manufacturing renaissance, reshaping global crane demand patterns, with India's crane market alone projected to reach USD 1.92 billion by 2029 at a 6.79% CAGR. This growth is driven by government initiatives like India's Production Linked Incentive scheme and China's continued infrastructure investments despite domestic construction market adjustments. The geographic shift in manufacturing is creating new crane deployment patterns, with companies like XCMG reporting 44% of total revenue from overseas markets, up from previous levels. Manufacturing megaprojects in battery production and semiconductor fabrication are particularly crane-intensive, requiring specialized equipment for clean room environments and precision assembly operations. The emergence of secondary manufacturing hubs in Southeast Asia and Africa creates demand for mobile and crawler cranes capable of operating in challenging terrain and limited infrastructure environments. This industrial diversification reduces the crane market's dependence on traditional construction cycles and creates more stable, long-term demand patterns.
Accelerated Urbanization & Megaproject Pipelines
Urban development patterns are shifting toward megaprojects requiring unprecedented crane capabilities in the crane market. Saudi Arabia's construction output is expected to reach USD 181.5 billion by 2028 as the kingdom becomes the world's largest construction market. The GCC region alone has over USD 2 trillion in planned or ongoing megaprojects, creating sustained demand for tower cranes, mobile cranes, and specialized heavy-lift equipment. These megaprojects are characterized by their complexity and scale, requiring crane solutions that can operate in confined urban spaces while handling increasingly heavy building components. High-rise residential and mixed-use developments drive demand for taller cranes, with projects in cities like Miami and Los Angeles requiring cranes reaching heights of up to 1,000 feet. The concentration of megaprojects in specific urban centers creates regional crane shortages and higher rental rates. Urban density constraints also push innovation in self-erecting and compact crane designs that can operate effectively in space-limited environments.
Restraints Impact Analysis*
| Restraint | (~) % Impact on CAGR Forecast | Geographic Relevance | Impact Timeline |
|---|---|---|---|
| High Capital and Operating Costs | -0.9% | Global, particularly impacting smaller operators | Short term (≤ 2 years) |
| Economic Cyclicality of Construction Spending | -0.6% | North America and EU, with spillover effects | Medium term (2-4 years) |
| Shortage of Certified Crane Operators | -0.5% | Global, acute in North America and EU | Medium term (2-4 years) |
| Carbon-Footprint Scrutiny and Cradle-to-Grave Reporting | -0.3% | EU leading, expanding to North America and Asia Pacific | Long term (≥ 4 years) |
| Source: Mordor Intelligence | |||
High Capital and Operating Costs
The crane industry faces mounting cost pressures constraining market expansion, with new heavy-lift cranes like Manitowoc's Model 31000 commanding prices of USD 30 million while requiring substantial ongoing maintenance investments. Material cost inflation has increased construction input prices by an average of 15% across major markets, directly impacting crane manufacturing costs and rental rates. High interest rates compound these challenges, with equipment financing costs rising significantly and affecting crane purchases and rental demand. Smaller crane operators are particularly vulnerable to these cost pressures, as they lack the scale to absorb price increases and may be forced to exit the market or consolidate with larger players. The complexity of modern crane systems is also driving up maintenance costs, requiring specialized technicians and expensive replacement parts that can strain operator budgets. Training costs for certified operators are increasing, with simulation-based programs requiring substantial upfront investments despite their long-term benefits in reducing training time and improving safety outcomes.
Economic Cyclicality of Construction Spending
Construction spending cyclicality continues to create volatility in crane demand, with equipment sales experiencing an 8% decline in 2024 following previous contractions in 2022 and 2023. Interest rate fluctuations directly impact construction project financing, with higher rates delaying or canceling projects that require significant crane resources. The residential construction sector, which accounts for 51% of crane activity, remains particularly sensitive to mortgage rate changes and housing market conditions. Economic uncertainty is causing project developers to delay major construction starts, creating gaps in crane utilization and pressure on rental rates. The cyclical nature of construction spending is compounded by regional variations, with some markets experiencing growth while others contract simultaneously. Corporate profit declines, projected at 4.5% in 2024, are reducing private sector construction investment and increasing reliance on government infrastructure spending to sustain crane demand.
*Our forecasts treat driver/restraint impacts as directional, not additive. The impact forecasts reflect baseline growth, mix effects, and variable interactions.
Segment Analysis
By Type: Marine Segment Leads Offshore Energy Boom
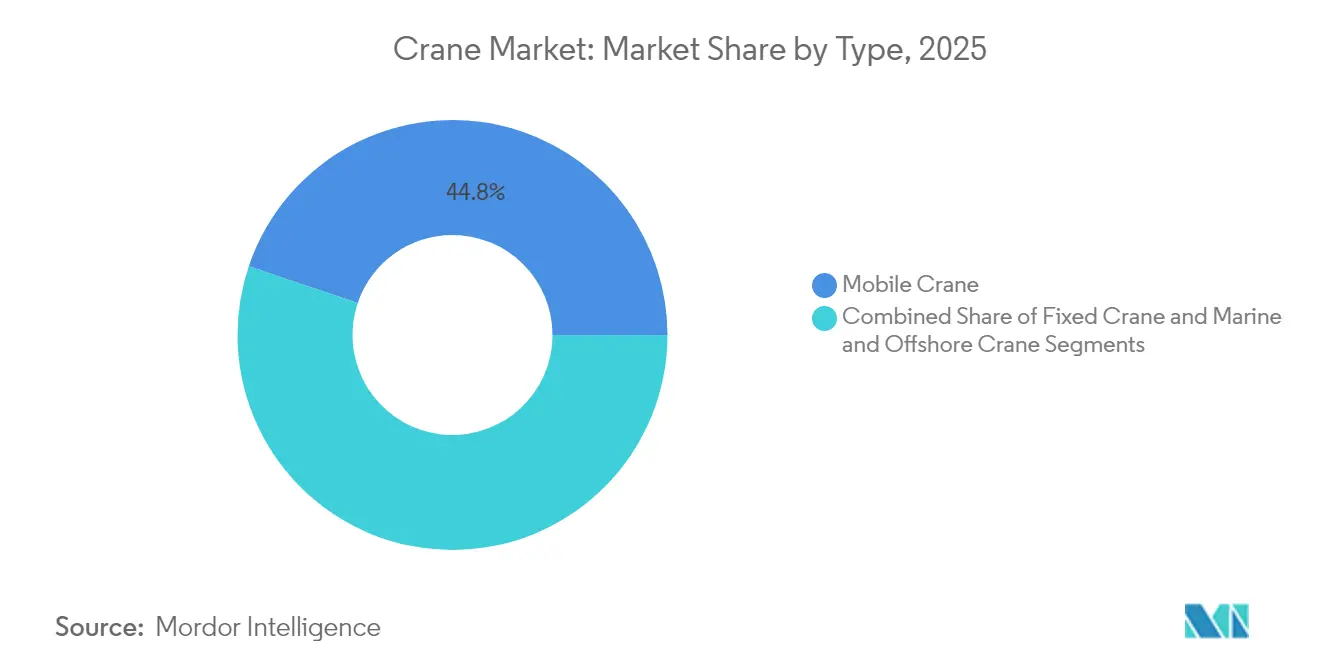
Mobile cranes maintain the largest market share at 44.82% in 2025, reflecting their versatility across construction, infrastructure, and industrial applications. The mobile crane segment benefits from its adaptability to diverse job sites and the ability to be rapidly deployed across multiple projects, making it the preferred choice for contractors managing varied workloads. Marine and offshore cranes are experiencing the strongest growth trajectory at 7.12% CAGR 2026-2031, driven by the unprecedented expansion of offshore wind installations and the need for specialized vessel-mounted lifting solutions.
Fixed cranes, encompassing tower cranes and overhead systems, serve critical roles in high-rise construction and industrial facilities, with the demand particularly strong in urban megaprojects across the Middle East and Asia Pacific. The marine and offshore segment's rapid growth reflects the specialized nature of offshore wind turbine installation, where cranes must operate in challenging maritime environments while handling components weighing thousands of tons. Companies like Cadeler invest heavily in wind turbine installation vessels equipped with 2,200-ton capacity cranes to serve the growing offshore wind market. The evolution toward larger offshore wind turbines drives demand for increasingly sophisticated marine crane systems capable of lifting precision in harsh weather conditions.

By Capacity: Heavy-Lift Demand Surges Above 300 Tons
The 51-150 ton segment commands the largest market share at 33.60% in 2025, representing the sweet spot for general construction and industrial applications. The above 300-ton capacity segment is experiencing the fastest growth at 7.78% CAGR 2026-2031, reflecting the industry's shift toward megaprojects requiring unprecedented lifting capabilities. This mid-range capacity segment benefits from its balance of lifting capability and operational flexibility, making it suitable for various construction projects from commercial buildings to infrastructure development.
Heavy-lift applications are being driven by nuclear power plant construction, petrochemical facilities, and offshore energy projects that require cranes capable of lifting reactor components, process modules, and turbine assemblies weighing hundreds of tons. Mammoet's 6,000-ton capacity SK6000 crane development exemplifies the industry's push toward ultra-heavy lifting capabilities. The up to 50-ton segment serves smaller construction projects and maintenance applications, while the 151-300 ton range addresses mid-scale industrial and infrastructure needs. Zoomlion's 3,600-ton crawler crane, setting world records for single lifting weight, demonstrates the technological advancement in heavy-lift capabilities. Modular construction trends drive demand across all capacity ranges, as prefabricated components require precise lifting and positioning capabilities.
By Power Source: Electric Revolution Accelerates
Diesel remains the dominant power source at 79.55% market share in 2025, reflecting the established infrastructure and proven reliability of diesel-powered systems. The diesel segment's continued dominance stems from its operational flexibility, extended range capabilities, and the existing service infrastructure that supports diesel equipment maintenance and refueling. Fully electric cranes represent the fastest-growing power source segment at 13.85% CAGR 2026-2031, driven by stringent emissions regulations and operational advantages including reduced noise, lower operating costs, and improved precision.
The hybrid segment is emerging as a transitional technology, offering reduced emissions while maintaining the operational flexibility of diesel systems. California's zero-emission equipment mandate for ports and rail yards is accelerating electric adoption, with over 90% zero-emission equipment penetration required by 2036. Konecranes is expanding its electrified portfolio with modular power options, including hybrid, battery, and hydrogen fuel cell systems. The shift toward electric power creates new infrastructure requirements, with construction sites and ports investing in charging systems to support electric crane fleets. Battery technology improvements are extending the operational range of electric cranes, making them viable for longer work cycles and reducing dependence on diesel backup systems.
By Boom Type: Telescopic Dominance Faces Lattice Challenge
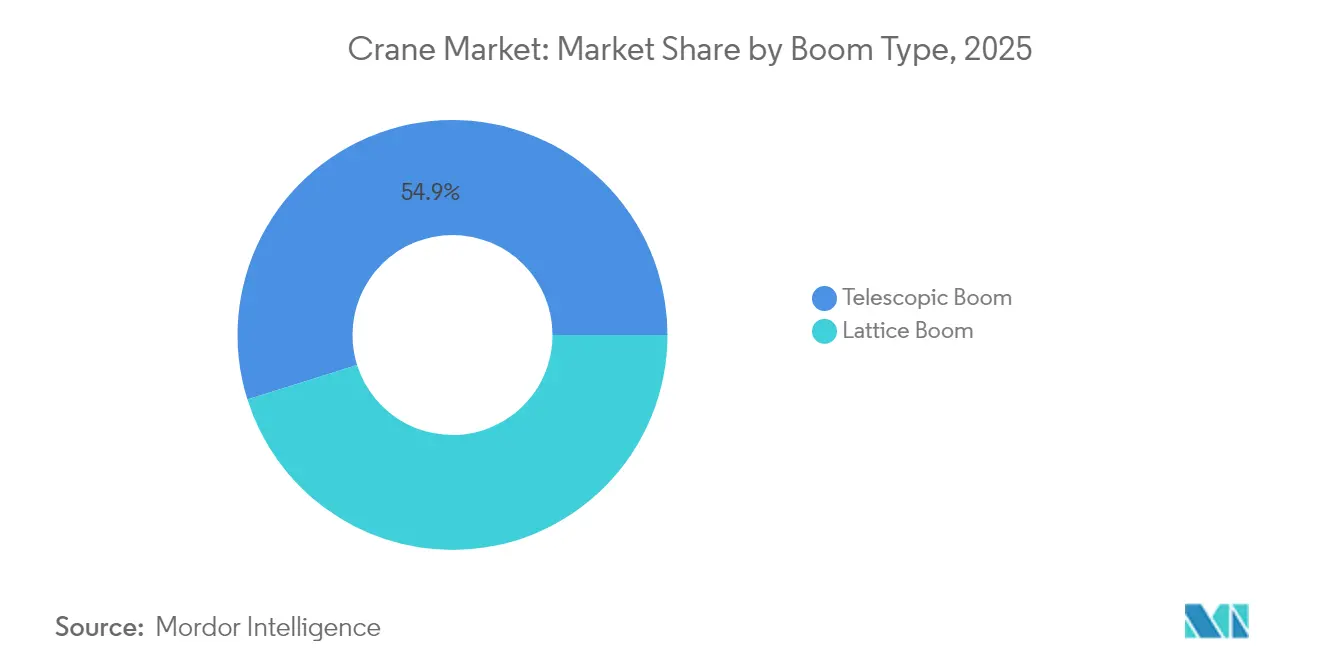
Telescopic boom cranes maintain market leadership at 54.85% share in 2025, valued for their quick setup capabilities and operational versatility across diverse job sites. Lattice boom cranes are experiencing faster growth at 5.72% CAGR 2026-2031, driven by their superior lifting capacity and stability in heavy-lift applications. The telescopic boom segment's dominance reflects its suitability for mobile crane applications where rapid deployment and repositioning are critical operational requirements.
Lattice boom systems excel in applications requiring maximum lifting capacity and extended reach, making them preferred for heavy industrial projects, wind turbine installations, and large-scale construction. The choice between boom types increasingly depends on specific application requirements, with telescopic systems favored for general construction and lattice systems preferred for specialized heavy-lift operations. Manitowoc's introduction of the GHC200 telescoping crawler crane with a 185-foot main boom demonstrates ongoing innovation in telescopic boom technology. The lattice boom segment benefits from its ability to handle extreme lifting scenarios, including installing nuclear reactor components and offshore wind turbine assemblies. Technological advances in both boom types are improving their respective capabilities, with telescopic systems achieving greater reach and lattice systems offering enhanced precision and stability.
By Application: Energy Sector Drives Growth
Construction and mining maintain the largest application share at 49.35% in 2025, driven by ongoing infrastructure development and industrial construction projects. The construction and mining segment's dominance reflects the fundamental role of cranes in building infrastructure, from highways and bridges to commercial and residential developments. Energy and utilities applications are experiencing the fastest growth at 8.41% CAGR 2026-2031, reflecting the massive investments in renewable energy infrastructure and grid modernization projects.
The energy and utilities segment's rapid growth encompasses both renewable energy installations and traditional power plant construction, with nuclear power experiencing a renaissance that requires specialized heavy-lift capabilities. Shipbuilding and port applications benefit from global trade growth and the expansion of container handling facilities, with automated port systems driving demand for sophisticated crane technologies. Industrial manufacturing applications are growing as companies invest in new production facilities, particularly in semiconductors, batteries, and advanced materials. Logistics and warehousing represent an emerging application area driven by e-commerce growth and the need for automated material handling systems. Diversifying crane applications across multiple sectors reduces the market's dependence on traditional construction cycles and creates more stable demand patterns.
Geography Analysis
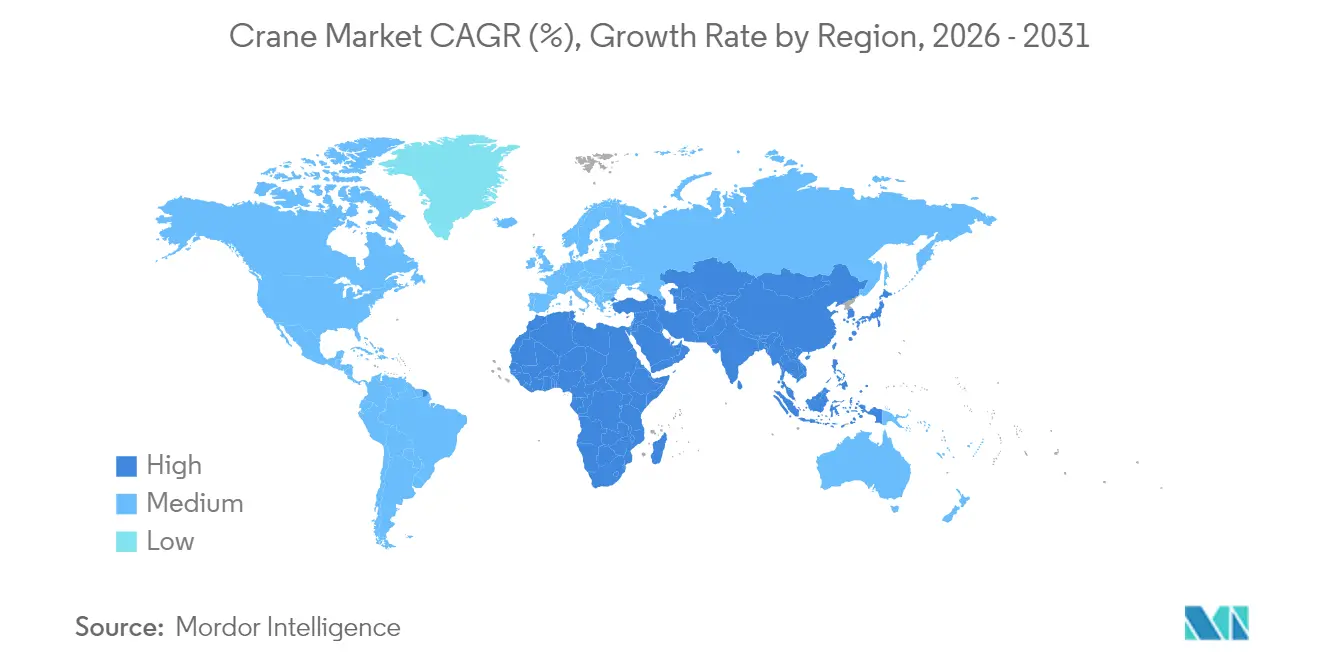
Asia-Pacific accounted for 41.70% of crane market revenue in 2025 as China sustained high public works spending and India accelerated factory construction. Chinese port automation success stories, with single bridge cranes averaging 60.9 container moves an hour, illustrate regional leadership in throughput performance. India’s Union Budget 2025 maintained elevated infrastructure allocations, underpinning continued demand for crawlers and tower cranes despite election-year caution. Japan and South Korea post low-single-digit growth, driven by facility maintenance and modernization.
The Middle East and Africa region is projected to post the fastest 6.38% CAGR between 2026-2031. Saudi Arabia alone intends to deploy about 20,000 tower cranes for NEOM and associated giga-projects. Local joint ventures, such as Wolffkran and Zamil Group’s new factory, reduce import lead times and create a localized supply chain. High oil prices funnel revenue into downstream petrochemical complexes that rely on heavy-lift crawler cranes, broadening application diversity.
North America benefits from the USD 1.2 trillion Infrastructure Investment and Jobs Act, which funds over 60,000 projects and sustains multi-year workloads. The U.S. equipment rental sector is forecast to reach USD 77.3 billion in 2025, with cranes forming a sizable share. Europe faces mixed signals: offshore wind accelerates equipment demand, yet elevated interest rates suppress commercial real estate starts. Latin America’s recovery hinges on commodity pricing, while renewed Brazilian energy auctions boost regional heavy-lift orders.
Regulatory Landscape
Crane safety and market access requirements are shaped by international standards and regional workplace-safety rules. ISO 12480-1:2024 provides general requirements for the safe use of land-based powered cranes, while US compliance remains anchored in OSHA regulations including 29 CFR 1910.179 (overhead and gantry cranes) and 29 CFR 1910.180 (crawler, locomotive, and truck cranes), along with related construction and marine-terminal provisions such as 29 CFR 1926.1438 and 29 CFR 1917.45 that affect contractor procurement and jobsite procedures.
In Europe, compliance baselines are moving through updates to harmonized and draft standards used by manufacturers and buyers in tender specifications. EN 13135:2026 updates design and safety requirements for crane equipment, and prEN 13000:2026 is a revision to the mobile-crane standard framework. For offshore lifting, Commission Implementing Decision (EU) 2026/82 (published 13 January 2026) adopts EN 13852-1:2025 for general purpose offshore cranes, with certain points deferred to 14 July 2027, creating a dated transition window for OEM design validation and documentation planning.
Value Chain Analysis
The crane value chain begins with raw materials and major sub-systems, primarily steel-intensive structures and fabricated booms, supported by hydraulics, engines or electric drive systems, controls, wire ropes, and safety devices. OEMs integrate these components into mobile, fixed, and marine/offshore platforms, and then distribute via direct sales, dealer networks, and project-based delivery models that include commissioning and operator training. Aftermarket service and parts supply are also central to lifecycle economics, especially as fleets add telematics and advanced safety systems.
Recent supply chain dynamics have increased the importance of input-cost and lead-time risk management. In the U.S., tariff actions on steel and aluminum derivatives have raised component and fabrication costs and encouraged regionalization of sourcing, including greater use of Foreign-Trade Zones and inventory buffering for constrained electronic and specialized mechanical parts. On the demand side, large schedule-driven builds in infrastructure, energy, and industrial facilities have increased reliance on long-term rental and service contracts, shifting value toward fleet uptime, field service capability, and parts availability alongside the initial equipment sale.
Competitive Landscape
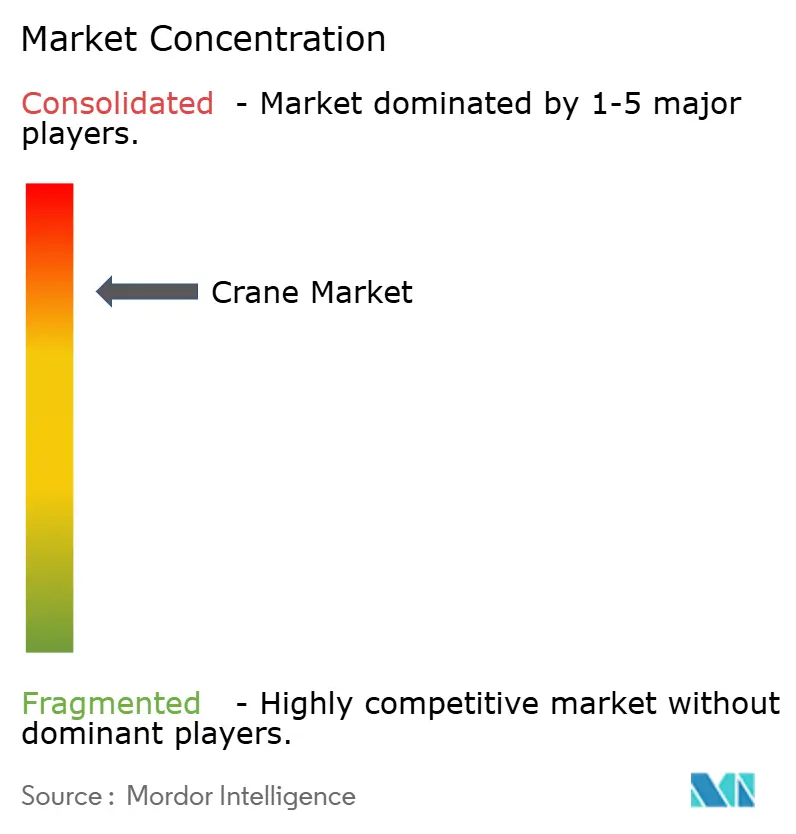
The crane industry features moderate concentration as global leaders expand via innovation and targeted acquisitions. Liebherr generated EUR 14.042 billion in 2023 and reinvested EUR 634 million into R&D focused on autonomous and electric machines. Tadano enhanced its North American footprint through the USD 223 million acquisition of Manitex, combining boom-truck expertise with all-terrain offerings.
R&D race centers on zero-emission drivetrains, remote operation, and predictive diagnostics. Konecranes attained a 14.3% comparable EBITA margin in 2024 by pairing service contracts with telematics, cementing a lifecycle revenue model. Chinese entrants, notably Zoomlion and XCMG, pursue an aggressive overseas push by establishing European training hubs and leasing arms that lower entry barriers for new customers.
Partnerships aimed at sustainability are reshaping procurement patterns. Liebherr’s USD 2.8 billion agreement to supply 475 battery-electric mining trucks to Fortescue underscores the scale of decarbonization investment. Mammoet and Cadeler co-develop ultra-heavy marine cranes to install next-generation wind turbines, further blurring lines between traditional construction and energy spheres.
Crane Industry Leaders
-
Zoomlion Heavy Industry Science and Technology Co., Ltd
-
Liebherr Group
-
XCMG Group
-
Konecranes Plc
-
SANY Group
- *Disclaimer: Major Players sorted in no particular order
Market Opportunities and Future Outlook
Electrification and low-emission operation are creating a concrete whitespace across applications where worksite restrictions, noise limits, and customer ESG requirements are tightening. The market already shows deployments into electric platforms, for example Liebherr supplying electric material-handling equipment (four LH 150 T Gantry Industry E units) for industrial scrap operations at voestalpine in Linz. More broadly, the report context points to accelerating adoption of hybrid and fully electric cranes, supported by telematics-driven utilization gains.
Project and logistics fragmentation across regions is also opening a second opportunity, since buyers increasingly seek localized delivery, service coverage, and standardized operator training for mixed fleets. In 2026, Red Sea shipping constraints lengthened heavy-machinery lead times from major Chinese ports to Middle East ports by roughly 14 to 21 days. That shift reinforces demand for nearer inventory, local assembly, and stronger aftermarket footprints in high-growth regions such as the Middle East and Africa, where megaproject pipelines like NEOM are crane-intensive. In this environment, OEM investment in regional capacity and deeper partnerships with global rental and heavy-lift specialists becomes more tied to delivery slot access, service responsiveness, and compliance-ready configurations.
Recent Industry Developments
- July 2026: XCMG delivered an integrated wheeled and crawler crane fleet to Sarens, including models such as the XCA160H all-terrain, XCR90 rough-terrain, and XLC18000M crawler cranes. The delivery supports large-scale heavy-lift execution by a major global contractor and reinforces OEM focus on fleet-package deals tied to demanding project pipelines.
- April 2025: Manitowoc launched the Potain Igo T 139 at bauma 2025, positioning it as the largest self-erecting crane in its range with an 8-ton maximum capacity and telematics integration. The release targets dense urban jobsites where fast setup, compact footprint, and connected fleet management improve rental turn times and utilization.
- January 2024: Tadano announced the acquisition of IHI Transport Machinery's transportation system business, adding categories such as jib climbing cranes, port cranes, and wind power cranes to its portfolio. The deal broadened Tadanos exposure to port and offshore-wind lifting applications and supported cross-selling of service and lifecycle support across a wider installed base.
Research Methodology Framework and Report Scope
Market Definition and Coverage
For this study, the crane market is defined as revenues earned from selling cranes and closely related lifting systems across mobile, fixed, and marine or offshore use, counted at the manufacturer and authorized channel level.
Scope exclusions: We exclude standalone rigging consumables, general construction services, and used equipment resales when they are not captured as new crane revenues.
Segmentation Overview
- By Type
- Mobile Crane
- All-terrain Crane
- Rough-terrain Crane
- Crawler Crane
- Truck-mounted Crane
- Other Mobile Cranes
- Fixed Crane
- Monorail and Under-hung
- Overhead Track-mounted
- Tower Crane
- Marine and Offshore Crane
- Mobile Harbor Crane
- Fixed Harbor Crane
- Offshore Crane
- Ship Crane
- Mobile Crane
- By Capacity
- Up to 50 T
- 51 to 150 T
- 151 to 300 T
- Above 300 T
- By Power Source
- Diesel
- Hybrid
- Fully Electric
- By Boom Type
- Lattice Boom
- Telescopic Boom
- By Application
- Construction and Mining
- Energy and Utilities
- Shipbuilding and Ports
- Industrial Manufacturing
- Logistics and Warehousing
- By Geography
- North America
- United States
- Canada
- Rest of North America
- South America
- Brazil
- Argentina
- Rest of South America
- Europe
- Germany
- United Kingdom
- France
- Italy
- Spain
- Rest of Europe
- Asia-Pacific
- China
- Japan
- India
- South Korea
- Rest of Asia-Pacific
- Middle East and Africa
- Saudi Arabia
- United Arab Emirates
- South Africa
- Rest of Middle East and Africa
- North America
Data Sources, Market Sizing, and Validation
Desk Research
Desk research started with mapping demand drivers and installed base signals that typically move crane purchasing. We reviewed public infrastructure and construction indicators from sources such as national statistics offices, the World Bank, and OECD series, then aligned them with trade and production signals from sources such as UN Comtrade and country customs dashboards.
To avoid sizing the market from only macro indicators, we also pulled product and regulation context from sources such as ISO references, OSHA guidance for lifting safety, and peer-reviewed engineering journals that discuss crane designs and duty cycles. These were complemented with company filings, investor presentations, association websites, and reputable press to understand product mix shifts like hybrid and electric cranes. In parallel, a paid subscription focused on company financials and intelligence was used to standardize revenue splits and remove non-crane lines where disclosures were bundled. The specific sources named here are illustrative, and other public documents were also used for data collection, validation, and research clarification.
Primary Interviews and Surveys
Primary work was used to sanity check product scope boundaries, pricing progression, and the pace of fleet replacement across construction, industrial, and marine or offshore buyers. Conversations covered manufacturers, distributors, and rental-focused stakeholders, plus end users, and the respondent mix was balanced across APAC, EMEA, and the Americas to reduce single-region bias.
Distribution of primary research fieldwork respondents
| Company type | Respondent position | Region |
|---|---|---|
| Top tier: 38% | CXOs: 16% | APAC: 44% |
| Mid tier: 45% | Functional/Unit leaders: 30% | EMEA: 30% |
| Smaller Players: 17% | Managers: 54% | Americas: 26% |
Market-Sizing & Forecasting
The sizing model begins with a top-down rebuild of crane demand pools by country, where construction and infrastructure activity, industrial capex cycles, and marine or offshore project pipelines are translated into equipment need through penetration and replacement logic. Once that demand picture is framed, it is checked with selective bottom-up approximations, such as sampled unit shipments by key crane classes, typical ASP bands by capacity, and channel checks on backlog and delivery lead times, which are then used to adjust totals where gaps appear.
In practice, a few market fingerprints carry most of the weight in the model, including crane fleet replacement cycles, rental penetration in major construction markets, share shifts between telescopic and lattice boom types, the mix across capacity bands (up to 50T through above 300T), and power-source adoption where hybrid and fully electric offerings are expanding. Forecasts were built using scenario analysis anchored to macro construction spending outlooks and project start timing, then tuned using expert views on utilization and procurement delays. Where bottom-up inputs were incomplete for smaller markets, we applied conservative proxy assumptions based on similar economies and then verified the implied per-project equipment intensity in follow-up calls.
Data Validation & Update Cycle
Validation is done through repeated triangulation between model outputs and independent signals, such as construction output trends, machinery trade flows, and disclosed order intake or revenue direction from public filings. When a country or segment shows an unusual swing, the drivers are re-checked and the assumptions are revisited, followed by a second-pass review before sign-off.
The report is refreshed annually, and interim updates are triggered when material events occur, such as policy-led infrastructure shifts, major supply disruptions, or sharp FX movements that can change reported USD values. Right before delivery, the latest public data releases are scanned again so clients receive an updated view rather than an older snapshot.
Mordor Intelligence's Crane Market Size Versus Other Published Estimates
It is normal to see different crane market sizes across publications, since firms often set different boundaries around product types, channel levels, and whether the number reflects equipment sales only or also includes adjacent lifting items. Timing also matters, because base year choice, currency conversion date, and how price escalation is applied can shift the stated USD value.
By tracking capacity-band mix, power-source adoption, and country level demand signals, Mordor Intelligence ties USD 35.82 B (2026) to equipment revenues across mobile, fixed, and marine or offshore cranes, and it does not count non-equipment services and broad rigging consumables that can widen totals.
Benchmark comparison
| Source | Market Size | Gaps in Research Methodology |
|---|---|---|
| Mordor Intelligence | USD 35.82 B (2026) | |
| Industry Publisher A | USD 37.00 B (2024) | Uses a different base year and forecast window, and the scope language leans toward construction lifting activity, which can change the weight given to marine or offshore demand and replacement cycles. |
| Industry Publisher B | USD 37.20 B (2024) | The segmentation is presented with broad application buckets that can be interpreted to include adjacent lifting items, and the longer horizon makes results more sensitive to assumed price escalation and mix shift rates. |
The spread is mainly explained by differences in year selection and what each publisher counts inside the crane market, and then by how pricing and mix are carried forward. Our checks keep the total traceable to practical purchase drivers and repeatable review steps, which helps users reconcile variances without guessing.
Key Questions Answered in the Report
What is the current size of the crane market?
The crane market size stood at USD 35.82 billion in 2026 and is forecast to reach USD 43.78 billion by 2031.
Which crane type holds the largest revenue share?
Mobile cranes led with 44.82% of crane market share in 2025 due to their versatility across infrastructure and industrial projects.
Why are electric cranes growing so quickly?
Strict emission rules in California, the European Union, and China drive a 13.85% CAGR for fully electric models, supported by lower operating costs and reduced work-site noise.
Which region shows the fastest demand growth?
The Middle East and Africa region is projected to expand at a 6.38% CAGR from 2026-2031, propelled by Saudi Arabia’s Vision 2030 megaproject pipeline.