
Graphic Processors Market Size and Share
Market Overview
| Study Period | 2020 - 2031 |
|---|---|
| Market Size (2026) | USD 75.08 Billion |
| Market Size (2031) | USD 117.01 Billion |
| Growth Rate (2026 - 2031) | 9.28% CAGR |
| Fastest Growing Market | Asia Pacific |
| Largest Market | North America |
| Market Concentration | High |
Major Players *Disclaimer: Major Players sorted in no particular order Image © Mordor Intelligence. Reuse requires attribution under CC BY 4.0. | |
Graphic Processors Market Analysis by Mordor Intelligence
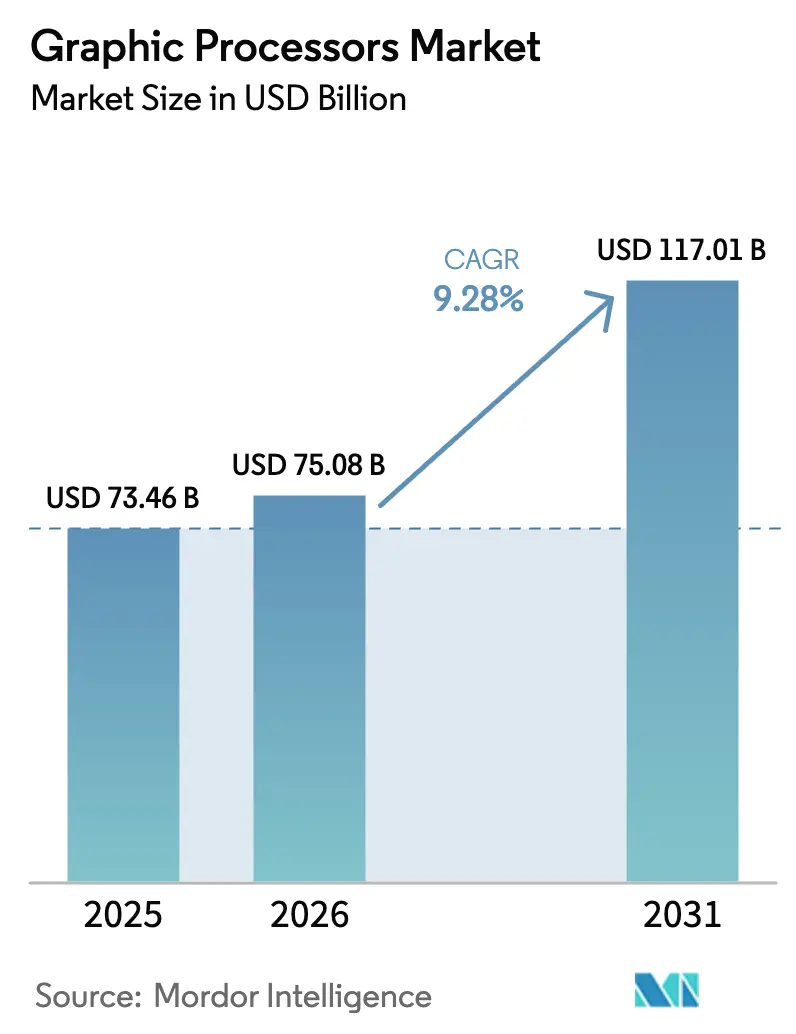
The Graphic Processors Market size is projected to expand from USD 73.46 billion in 2025 and USD 75.08 billion in 2026 to USD 117.01 billion by 2031, registering a CAGR of 9.28% between 2026 to 2031. The increasing demand for accelerators powering large language model (LLM) training, real-time ray tracing in gaming, and on-device generative AI is reinforcing upgrade cycles despite component shortages and high average selling prices. Vendors are shifting roadmaps toward hybrid chiplet architectures that cut memory-transfer latency and improve throughput per watt, while hyperscalers are commercializing stranded capacity through second-based GPU-as-a-service offerings to diversify revenue. Thermal-envelope constraints, wafer-start scarcity at 5 nanometers and below, and export controls on high-end boards are tempering shipment velocity, yet underlying appetite for parallel compute keeps attach rates above 80% in data-center design wins. Alongside incumbent concentration in premium tiers, a wave of RISC-V and application-specific integrated circuit (ASIC) challengers is targeting inference workloads that demand lower power budgets and tighter cost envelopes.
Key Report Takeaways
- By GPU type, dedicated discrete boards led with 40.22% of graphic processors market share in 2025. Hybrid GPUs are projected to advance at a 9.83% CAGR through 2031, the fastest among architectures.
- By deployment model, on-premise installations commanded a 72.91% revenue share in 2025. Cloud-as-a-service workloads are set to expand at a 10.02% CAGR during 2026–2031.
- By device platform, smartphones generated 43.67% of sales in 2025. Data-center servers are forecast to climb at a 9.64% CAGR through 2031.
- By end-user industry, consumer electronics held 33.03% of revenue in 2025. Healthcare and life sciences are the fastest-growing vertical, with a 10.93% CAGR through 2031.
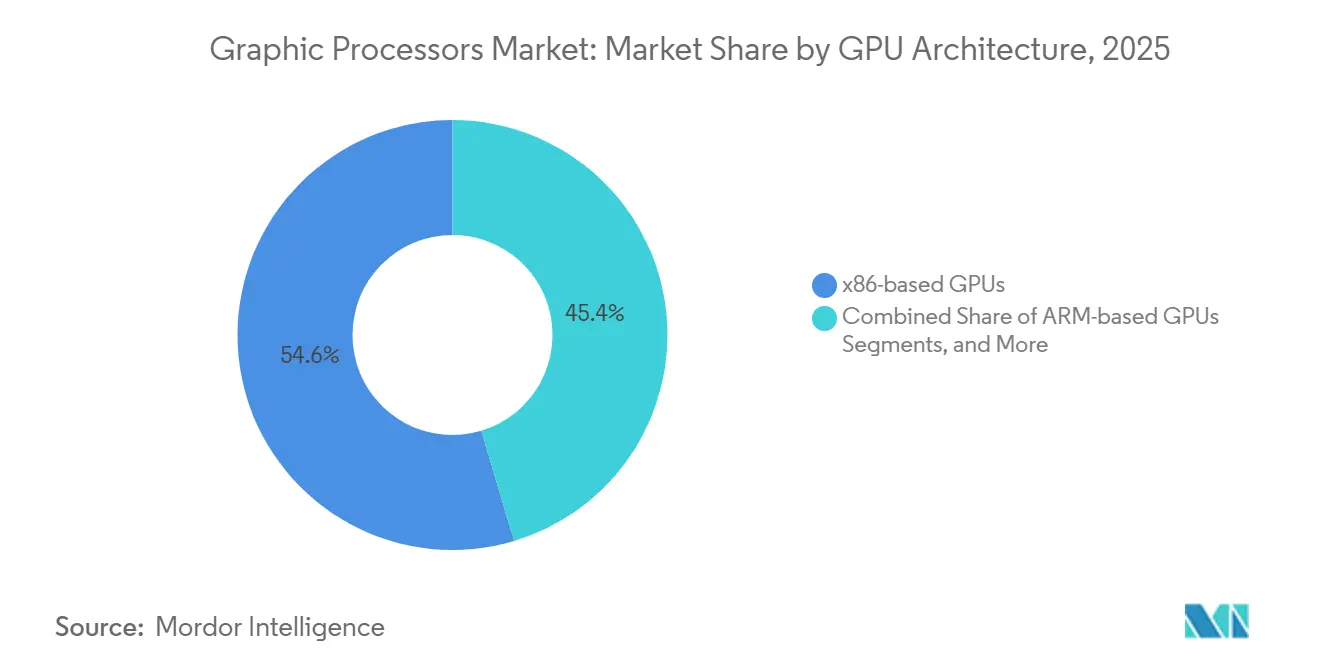
- By GPU architecture, x86 retained a 54.64% share in 2025. RISC-V GPUs are on track for a 9.51% CAGR, the highest among instruction-set options.
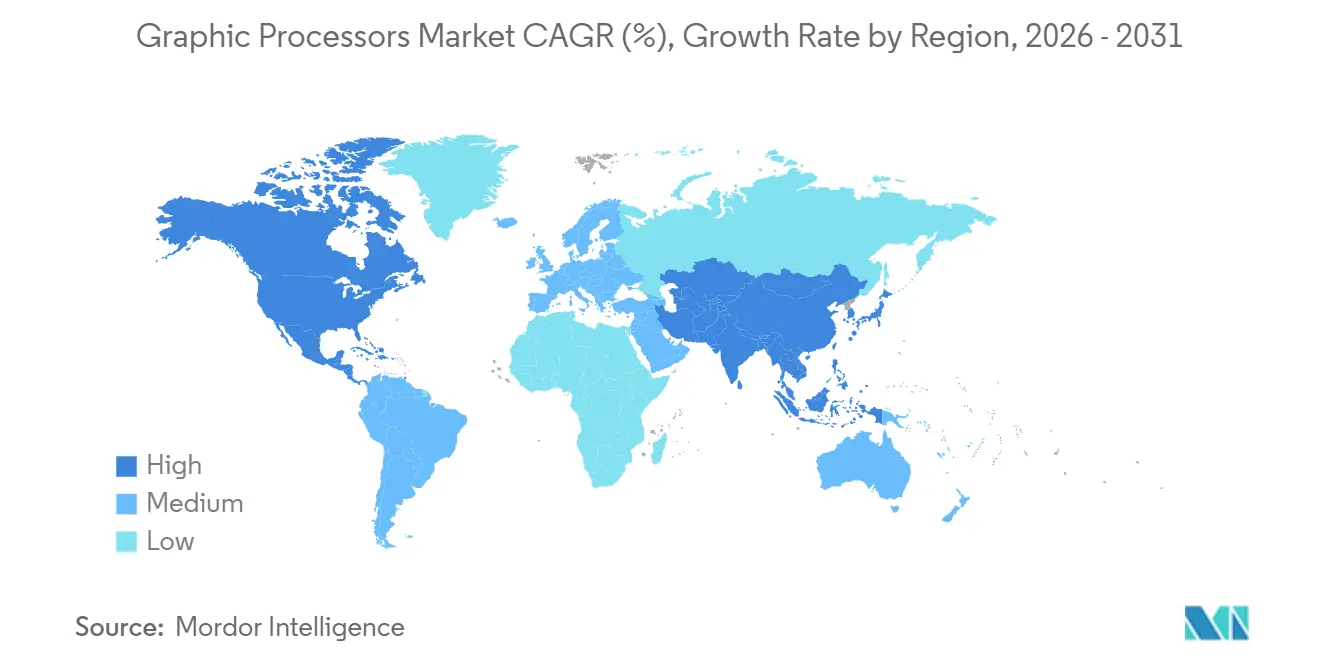
- By geography, North America led with 37.81% market share in 2025, while Asia-Pacific is projected to expand at an 11.52% CAGR through 2031.
Note: Market size and forecast figures in this report are generated using Mordor Intelligence’s proprietary estimation framework, updated with the latest available data and insights as of January 2026.
Global Graphic Processors Market Trends and Insights
Drivers Impact Analysis*
| Driver | (~) % Impact on CAGR Forecast | Geographic Relevance | Impact Timeline |
|---|---|---|---|
| Surging Demand for AAA Gaming and Real-Time Ray Tracing | +1.8% | Global, with concentration in North America, Europe, and APAC gaming hubs | Medium term (2-4 years) |
| Proliferation of AI/Deep Learning Workloads | +2.5% | Global, led by North America and APAC data-center deployments | Long term (≥ 4 years) |
| Expansion of Cloud Gaming and GPU-as-a-Service | +1.5% | North America and Europe, early adoption in urban APAC markets | Medium term (2-4 years) |
| Chiplet and Advanced Packaging Breakthroughs | +1.2% | Global, with manufacturing concentrated in Taiwan and South Korea | Long term (≥ 4 years) |
| Government-Backed Exascale Supercomputing Programs | +0.8% | United States, European Union, China, Japan | Long term (≥ 4 years) |
| ARM/RISC-V Automotive-Grade Custom GPUs | +1.0% | Europe and APAC automotive corridors, spillover to North America | Medium term (2-4 years) |
| Source: Mordor Intelligence | |||
Surging Demand for AAA Gaming and Real-Time Ray Tracing
Real-time ray tracing has become a baseline expectation, leading vendors to devote up to half of the die area to ray-triangle intersection units that sustain 60 frames-per-second output at 4K resolution. Console refreshes in 2025 injected second-generation ray-tracing cores, lifting the performance floor and pushing discrete GPU roadmaps toward native 8K rendering by 2027. Esports studios are adopting path-traced global illumination to curb artist workloads, tripling compute requirements over raster pipelines and expanding the mid-tier segment priced between USD 400 and USD 700. Subscription cloud gaming platforms now reserve 1.2 GPUs per concurrent user to preserve sub-50-millisecond latency, up from 0.8 in 2024, tightening high-end supply for hyperscale GPU pools. Premium smartphones integrated hybrid ray-tracing blocks in 2025, lifting flagship handset GPU attach rates by 18% year over year.
Proliferation of AI/Deep Learning Workloads
Frontier model training exceeded 10^25 floating-point operations in 2025, prompting clusters with 16,384 accelerators linked via 400 Gb/s fabrics to complete runs within 90 days. Inference is moving from batch to real-time streams, favoring tensor cores optimized for INT8 and FP16 over generic vector units. Hospitals deployed federated learning frameworks across 50-100 sites, raising per-site GPU needs from 2 to 8 units for privacy-preserving diagnostics. Automakers fitted on-vehicle modules with 200-tera-operations-per-second throughput to support over-the-air updates, adding USD 800-USD 1,200 to bill-of-materials and reinforcing premium-trim segmentation. Quantitative trading desks cut strategy development cycles from 6 months to 3 weeks through GPU-based reinforcement learning, triggering 22% deployment growth in 2025 in the graphic processors market.
Expansion of Cloud Gaming and GPU-as-a-Service
Hyperscalers introduced second-billed accelerator offerings in 2025, lowering the entry point for indie developers who previously avoided reserved-instance lock-ins.[1]Amazon Web Services, “Per-Second GPU Pricing Launch,” aws.amazon.com Global cloud-gaming subscriptions climbed to 45 million, yet 30% annual churn prompted providers to co-locate GPU pods within 10 milliseconds of metropolitan exchanges to mitigate latency spikes. Remote-work demand for workstation-class experiences lifted virtual desktop infrastructure with GPU pass-through by 35% year over year. Emerging spot markets for idle capacity allowed brokers to aggregate fractional compute and resell at 40% discounts, pressuring hyperscaler margins and hastening moves toward internal silicon. Data-sovereignty mandates in the European Union and India kept personal-data workloads inside national borders, inflating per-instance costs by up to 25%.
Chiplet and Advanced Packaging Breakthroughs
Chiplet designs decoupled compute, memory, and I/O in 2025, enabling 3 nanometer logic stacked beside 5 nanometer SRAM and trimming wafer costs by up to 30%.[2]TSMC, “Chiplet Architecture Advances,” tsmc.com The Universal Chiplet Interconnect Express (UCIe) standard opened doors for third-party tensor tiles that integrate via 2.5D interposers, cutting time-to-market from 24 months to 14 months. Eight-high HBM stacks delivered 1.2 TB/s bandwidth inside a 55 mm square, eliminating the need for off-package buffers in training rigs. Multi-die packages incorporated microfluidic channels circulating dielectric coolant at 2 L/min, sustaining 15% higher boost clocks relative to air-cooled boards despite a USD 50-USD 80 added unit cost. Machine-learning-based binning raised known-good-die yields from 88% to 94% by mid-2025, offsetting complexity penalties.
Restraints Impact Analysis*
| Restraint | (~) % Impact on CAGR Forecast | Geographic Relevance | Impact Timeline |
|---|---|---|---|
| Advanced-Node Supply Bottlenecks (≤5 Nm) | -1.3% | Global, acute in North America and Europe GPU supply chains | Short term (≤ 2 years) |
| High ASPs Limiting Mainstream Adoption | -0.9% | Global, pronounced in price-sensitive APAC and South America markets | Medium term (2-4 years) |
| Export Controls on High-End GPUs | -0.7% | China, Russia, spillover to Middle East and select APAC markets | Medium term (2-4 years) |
| Thermal Envelope (>600 W) Deployment Limits | -0.5% | Global data centers, concentrated in North America and Europe | Short term (≤ 2 years) |
| Source: Mordor Intelligence | |||
Advanced-Node Supply Bottlenecks (≤5 nm)
Foundry capacity at 5 nm and below remained tight in 2025, as TSMC allocated 60% of N3 wafer starts to smartphone processors, pushing GPU lead times to 26 weeks for volume orders. Samsung’s 3 nm yields hovered near 70%, below cost-competitive thresholds, forcing fallback to 5 nm nodes at 20% lower performance per watt. Intel’s Arizona ramp slipped six months, delaying domestic capacity for U.S. designers and prolonging reliance on Taiwan fabrication. Dual-sourcing expansions require 12–18 months of process-co-development, limiting near-term diversification. Wafer price inflation of 8% compounded margin compression and curbed aggressive expansion in the graphic processors market.
High ASPs Limiting Mainstream Adoption
Flagship data-center boards cleared USD 30,000 per unit in 2025, confining uptake to hyperscalers and enterprises with USD 50 million-plus budgets.[3]The Information, “GPU Pricing Dynamics at Hyperscalers,” theinformation.com Enthusiast consumer GPUs crossed USD 1,800, restricting sales to the top income quintile in developed markets. Automotive-grade accelerators priced at USD 800-USD 1,200, equating to 2–3% of vehicle cost, relegated GPU-enabled ADAS functions to premium trims. Leasing and GPU-as-a-service mitigated capex but resulted in a 10-15% higher total cost of ownership over three years due to financing premiums. Elasticity analysis showed that a 10% ASP cut could lift unit demand by up to 22%, underscoring the latent opportunity if chiplet economies of scale materialize.
*Our forecasts treat driver/restraint impacts as directional, not additive. The impact forecasts reflect baseline growth, mix effects, and variable interactions.
Segment Analysis
By GPU Type: Hybrid Designs Gain Enterprise Traction
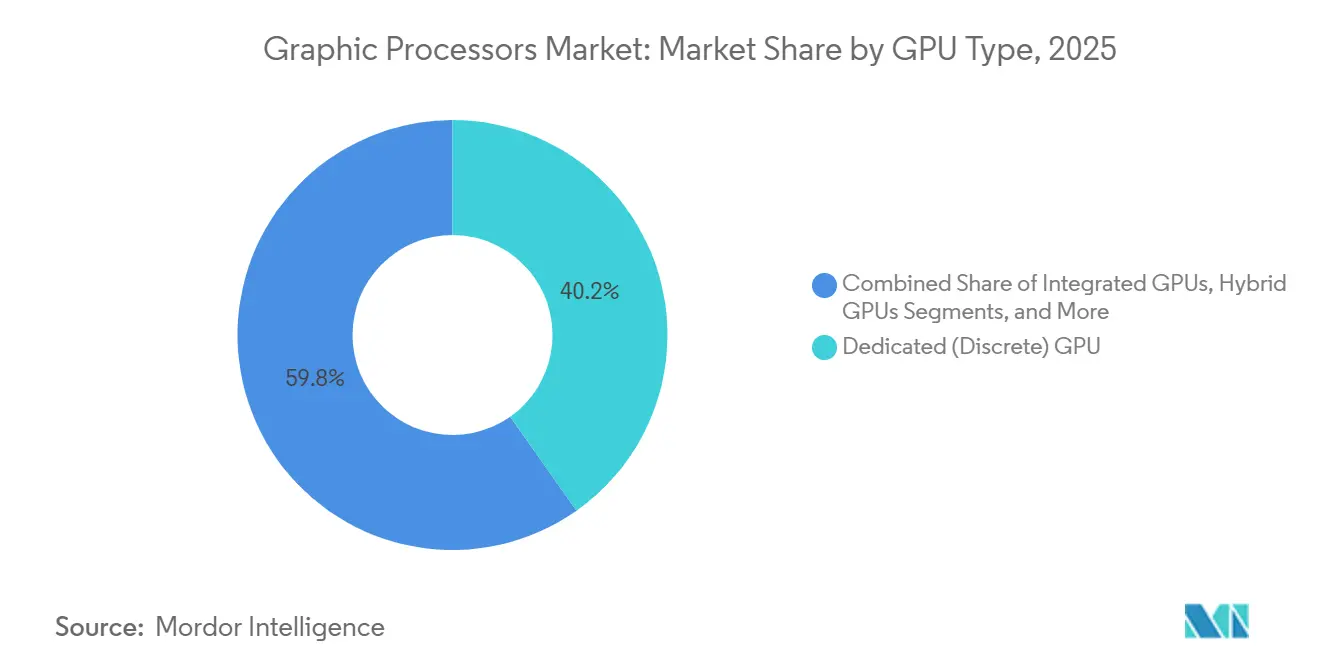
Dedicated discrete boards retained a 40.22% stake in 2025 in the graphic processors market, driven by hot-swappable data center cards that simplify maintenance windows. Hybrid accelerators are forecast to grow at a 9.83% CAGR amid demand for unified memory that eliminates PCIe bottlenecks and cuts system power by 25-30%. Integrated GPUs continue to dominate thermally constrained laptops, whereas external enclosures target mobile creatives seeking episodic boosts but are hampered by Thunderbolt bandwidth ceilings that cap utilization at 70-80%.
Chiplet-based hybrids combine 3 nm CPU cores with 5 nm GPU tiles, balancing yield and cost while sustaining competitive throughput. Discrete inference boards introduced sparsity engines that raise effective throughput by up to 60% on transformer models without area penalties. External GPU ecosystems are exploring proprietary connectors to overcome Thunderbolt 5 constraints.



By Deployment Model: Clouds Monetize Idle Capacity
The on-premise segment captured 72.91% of 2025 revenue in the graphic processors market, as latency-sensitive or sovereign workloads remained tethered to local clusters. Cloud-as-a-service is projected to grow 10.02% annually, driven by second-based billing that attracts deep learning experimentation and burst capacity. Financial and healthcare operators keep primary training on site for compliance but burst peak loads to co-located regions, creating hybrid orchestration demand.
Spot GPU prices have varied by 50-80% across zones, prompting workload schedulers to migrate jobs to optimize costs. Lengthening hardware refresh cycles from 3.2 to 4.5 years reflects cautious capital expenditure and software-side efficiency gains. Reserved-capacity contracts offer 35-45% discounts but expose clients to generation-lock-in risk as new silicon lands.
By Device Platform: Data Centers Absorb LLM Training
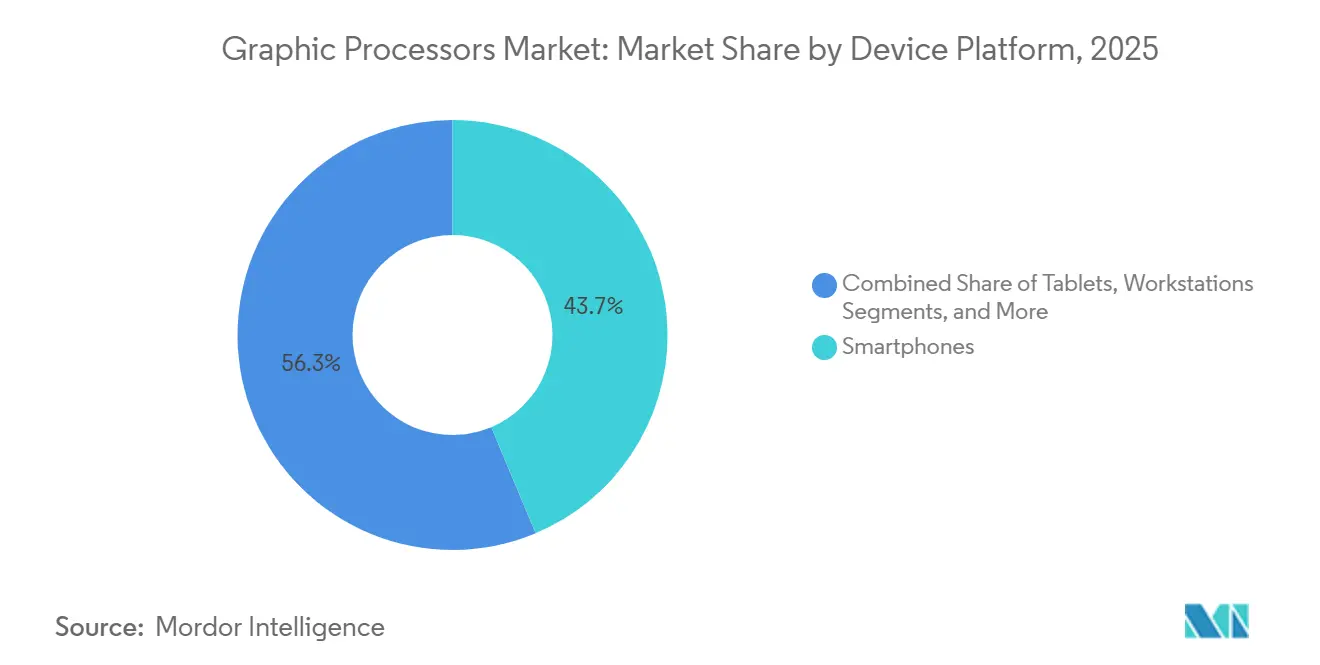
Smartphones led with 43.67% revenue in 2025 in the graphic processors market, propelled by sub-100-millisecond on-device generative AI that circumvents cloud round-trips. Data-center servers are projected to advance at a 9.64% CAGR, absorbing frontier model training rigs of 8,192-16,384 GPUs. Gaming PCs and consoles kept steady volumes, but upgrade intervals lengthened to 3.8 years as generational gains narrowed.
Workstations adopted hardware video encoding that slashed 8K timeline scrub lag by 40% and boosted creative productivity. Tablets remain thermally constrained, limiting sustained graphics to one-fifth of discrete levels. Automotive infotainment demanded ISO 26262-certified GPUs, extending design cycles by up to 18 months and concentrating share among established suppliers.
By End-User Industry: Healthcare Accelerates Diagnostics
Consumer electronics commanded 33.03% of 2025 demand, reflecting smartphones, consoles, and PCs where GPU capability influences buyer decisions. Healthcare is set for a 10.93% CAGR on the back of MRI reconstruction that cuts scan times to 12 minutes and drug-discovery screens that process 10 million compounds weekly. IT and telecom providers offloaded packet processing to GPUs, tripling network throughput.
Media studios embraced neural rendering to replace physical sets, trimming shoot days by up to 30%. Automakers deployed fleet-wide perception updates using on-vehicle accelerators, tightening feedback loops for autonomous algorithms. Defense agencies achieved near-real-time synthetic-aperture radar processing, shortening decision cycles from hours to minutes in the graphic processors market.
By GPU Architecture: RISC-V Secures Automotive Beachhead
x86 architectures held 54.64% in 2025 as mature ecosystems and legacy compatibility deter costly refactoring. RISC-V is forecast to expand at a 9.51% CAGR, led by automotive tier-1s eyeing royalty-free designs that pare per-vehicle license costs by up to USD 10. ARM continues to dominate sub-10-watt envelopes with 2-3x performance-per-watt advantages, especially in mobile.
Open-source toolchain maturation cut RISC-V porting effort from 18 to 6 months, lowering entry thresholds for startups. x86 vendors introduced expanded vector extensions that doubled inference throughput, narrowing efficiency gaps with ARM. Fragmented ARM memory-coherency protocols posed software hurdles for unified CPU-GPU address spaces.
Geography Analysis
North America contributed 37.81% of 2025 revenue, driven by hyperscale build-outs in Virginia, Oregon, and Texas, which accounted for over half of global high-end shipments. Asia-Pacific is projected to expand at an 11.52% CAGR, underpinned by sovereign-AI programs in China and India that prioritize domestic silicon and localized model training.[4]Wall Street Journal, “China, India Sovereign AI GPU Initiatives,” wsj.com Europe registered moderate growth, as energy tariffs inflated operating expenses by 18-22%, prompting delays in refreshes in the graphic processors market.
Middle East investments established AI-free zones, where the United Arab Emirates and Saudi Arabia commissioned clusters of more than 10,000 accelerators to build Arabic LLMs. Africa and South America contributed under 5% combined, though smartphone GPU attachment in Brazil, Nigeria, and South Africa rose 25-30% with carrier financing expansion.
China’s imports fell 12% after high-bandwidth interconnect restrictions, prompting domestic efforts at Alibaba’s T-Head and Biren to achieve 70-80% of NVIDIA A100 performance by late-2025. Japan allocated USD 2.3 billion to national AI clusters totaling 15,000 GPUs to train language models without relying on U.S. cloud services. India’s semiconductor incentive attracted USD 1.8 billion commitments, though front-end fabs remain three years out. Germany and France co-funded GPU R&D projects but trailed commercial offerings by 18-24 months in power efficiency.

Regulatory Landscape
Export controls and AI governance are the most material policy levers affecting high-end GPU availability and deployment. In the United States, the Bureau of Industry and Security (BIS) maintains licensing requirements for advanced computing integrated circuits classified under ECCNs 3A090.a and 4A090.a, and its May 31, 2026 enforcement guidance reiterates that controls can apply based on the ultimate parent or headquarters being in Country Group D:5 or Macau even when the shipment destination is elsewhere, raising compliance demands for distributors and cloud providers.
In Europe, the EU Artificial Intelligence Act (Regulation (EU) 2024/1689) establishes a risk-based framework for AI systems and general-purpose AI models, with obligations for systemic-risk mitigation becoming active starting in August 2025. This shapes how GPU-backed AI infrastructure is documented, monitored, and governed by deployers. In China, MOFCOM and GACC updates to export licensing, including the 2026 Export License Management Catalogue (MOFCOM GACC Announcement 2025 No. 89), add trade-clearance complexity for regulated categories, reinforcing the need for end-use checks and supply chain planning for cross-border GPU and related high-performance computing components.
Value Chain Analysis
The value chain for graphic processors spans GPU architecture and software stacks (IP and toolchains), wafer fabrication at leading-edge nodes, advanced packaging, memory integration, board and system assembly, and multi-channel distribution into device OEMs and data centers. Leading-edge foundries, particularly TSMC, anchor manufacturing for premium GPUs, while the scarcest steps increasingly sit downstream in advanced packaging such as CoWoS and in the supply of HBM stacks from SK hynix, Samsung, and Micron. These dependencies concentrate leverage around a small set of packaging lines, memory stacks, and substrate ecosystems, and they amplify the impact of yield learning and allocation decisions on shipment velocity.
Back-end constraints now shape go-to-market decisions as much as wafer starts. Advanced packaging lead times have extended beyond typical component cycles, pushing GPU vendors toward multi-year capacity reservations and closer coordination with OSAT partners such as ASE and SPIL to add throughput. The rack-scale system path adds additional tiers, including substrates (for example, Ibiden and Unimicron), server OEMs and ODMs (for example, Foxconn, Quanta, and Supermicro), and hyperscalers that increasingly source complete platforms rather than standalone boards, linking procurement to power delivery and cooling integration at the data center level.
Competitive Landscape
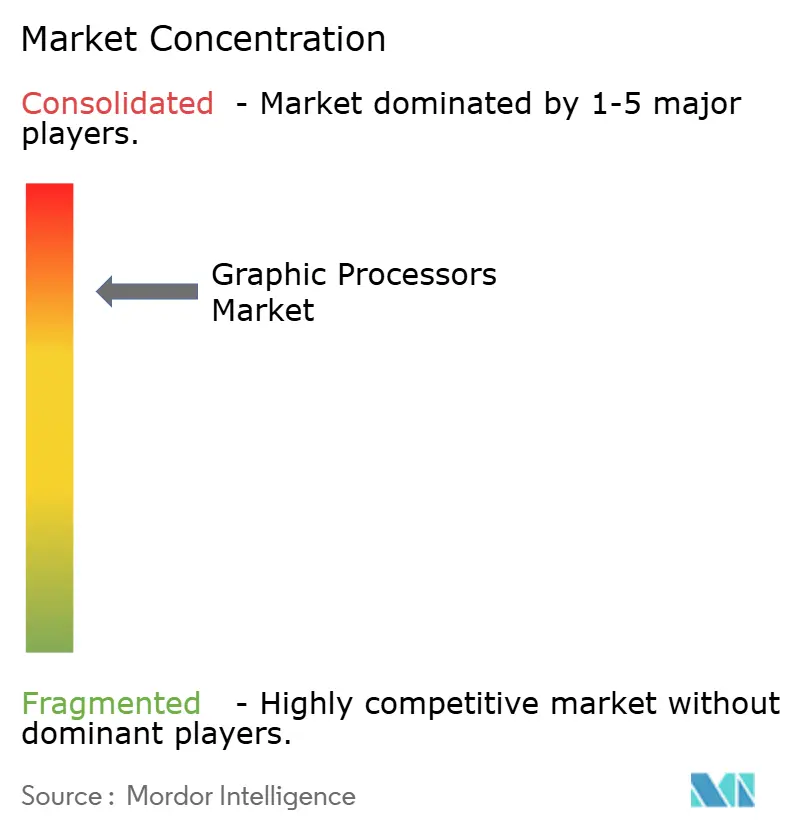
The graphics processor market is highly concentrated; the top three vendors captured a high share of 2025 data-center sales. Incumbents defend attach rates above 80% by tethering accelerators to proprietary fabrics and software stacks, elevating switching costs to up to USD 10 million for mid-tier clouds. Challenger ASIC makers tout 3-5x performance-per-watt advantages for inference, exploiting the gulf between training-centric GPUs and production needs.
Edge AI represents white space where sub-15-watt budgets and sub-10-millisecond latency invite bespoke silicon; startups raised USD 800 million in 2025 to chase this slice. Patent filings for greater than 1 Tb/s chiplet interconnects jumped 40%, signaling a strategic race to own next-gen packaging standards. Hyperscalers accelerated vertical integration, unveiling internal GPUs that could shrink the external addressable market by 8-12% over five years.
RISC-V vendors sacrifice 5-8 points of gross margin to avoid royalties while accelerating automotive and industrial time-to-market, where software customization outweighs peak flops. Meanwhile, incumbent mobile suppliers continue to refine power-efficiency curves, defending share as ARM-based laptop pushes blur device boundaries.
Graphic Processors Industry Leaders
NVIDIA Corporation
Advanced Micro Devices Inc.
Intel Corporation
Samsung Electronics Co. Ltd.
Qualcomm Incorporated
- *Disclaimer: Major Players sorted in no particular order

Market Opportunities and Future Outlook
A primary opportunity lies in turning constrained GPU supply into higher system-level value by selling integrated platforms and gigawatt-scale infrastructure, not only add-in boards. Company actions in 2026 reflect this shift: NVIDIA announced a partnership with IREN to accelerate deployment of up to 5 gigawatts of AI infrastructure aligned to NVIDIA data center platforms, while AMD disclosed more than USD 10 billion in Taiwan ecosystem investments aimed at packaging and manufacturing capacity that supports next-generation AI infrastructure. Together, these moves broaden the addressable value pool into system assembly, power and cooling design, and long-duration infrastructure partnerships.
Another opportunity is in relieving the supply bottlenecks that have moved downstream from front-end logic to HBM and advanced packaging. The market context highlights advanced packaging (such as CoWoS) and HBM stacking throughput as binding constraints. 2026 investments and supplier alignment, including Samsung-AMD coordination on next-generation AI memory and NVIDIA-SK hynix multiyear work on memory for new platforms, point to whitespace for qualified packaging capacity, memory supply, and substrate scaling. In parallel, export controls and data-sovereignty mandates are sustaining demand for regionally compliant supply and deployment models, creating room for localized manufacturing and in-country cloud GPU capacity offerings structured around compliant customer onboarding and workload governance.
Recent Industry Developments
- June 2026: NVIDIA and SK hynix announced a multiyear technology partnership to advance memory for NVIDIA Vera Rubin platforms. The deal tightens co-development across HBM and integration roadmaps, targeting one of the most capacity-constrained inputs for AI GPUs and improving supply assurance for rack-scale deployments.
- May 2026: NVIDIA and IREN announced a strategic partnership to accelerate the deployment of up to 5 gigawatts of AI infrastructure aligned to NVIDIA data center platforms. The announcement reinforces the shift from selling accelerators to structuring long-horizon infrastructure programs where power, cooling, and site capacity become central to GPU availability.
- December 2025: NVIDIA expanded its Israel R&D hub with a USD 3.2 billion investment focused on next-generation GPU architectures. This expansion strengthens upstream design capacity and talent depth for new GPU roadmaps, supporting a faster platform cadence amid rising performance-per-watt and packaging complexity requirements.


Research Methodology Framework and Report Scope
Market Definition and Coverage
This market covers the global revenue generated from graphic processors used to render graphics and accelerate compute workloads across consumer and enterprise devices, counted at the hardware level and measured in USD for the study period.
Scope exclusions: Excludes unrelated semiconductor categories that do not function as a graphics processor, and it also excludes non-hardware revenue that is not directly tied to the graphic processor itself.
Segmentation Overview
- By GPU Type
- Dedicated (Discrete) GPUs
- Integrated GPUs
- Hybrid GPUs (APUs)
- External GPUs (eGPU Enclosures)
- By Deployment Model
- On-Premise
- Cloud-as-a-service
- By Device Platform
- Smartphones
- Tablets
- Gaming PCs and Consoles
- Workstations
- Data-center Servers
- Automotive Infotainment and ADAS
- By End-User Industry
- Consumer Electronics
- IT and Telecom
- Media and Entertainment
- Automotive
- Defense and Intelligence
- Healthcare and Life Sciences
- By GPU Architecture
- x86-based GPUs
- ARM-based GPUs
- RISC-V-based GPUs
- Proprietary/Other ISAs
- By Geography
- North America
- United States
- Canada
- Mexico
- South America
- Brazil
- Argentina
- Rest of South America
- Europe
- Germany
- United Kingdom
- France
- Italy
- Spain
- Rest of Europe
- Asia-Pacific
- China
- Japan
- India
- South Korea
- ASEAN
- Rest of Asia-Pacific
- Middle East
- Saudi Arabia
- United Arab Emirates
- Rest of Middle East
- Africa
- South Africa
- Nigeria
- Rest of Africa
- North America
Data Sources, Market Sizing, and Validation
Desk Research
Desk research was used to set the base structure of the model and to anchor it to measurable signals that can be checked each year. We reviewed public statistics and standards bodies such as U.S. Census trade data, UN Comtrade, World Semiconductor Trade Statistics, and OECD indicators to understand electronics production, trade flows, and demand momentum by region.
On the market side, we cross-checked shipment and device trends using sources such as investor presentations and annual filings of listed chip and device makers, customs and tariff schedules for relevant HS codes, and technical publications and peer-reviewed journals that track GPU architectures and compute adoption. Select paid subscriptions were used only for company financials and intelligence, news and financials tracking, semiconductor value chain context, and patent databases to validate timing of product cycles and investment waves. These desk sources are illustrative and not exhaustive, and additional public references were also used for data collection, validation, and clarification.
Primary Interviews and Surveys
Primary work focused on validating what portion of demand is truly attributable to graphic processors, and how pricing and mix shift over time by use case. We spoke with a spread of stakeholders including component suppliers, device OEMs, channel partners, and enterprise buyers across APAC, EMEA, and the Americas, so assumptions around attach rates, average selling prices, and refresh cycles could be adjusted to real buying behavior.
Distribution of primary research fieldwork respondents
| Company type | Respondent position | Region |
|---|---|---|
| Top tier: 25% | CXOs: 18% | APAC: 46% |
| Mid tier: 55% | Functional/Unit leaders: 22% | EMEA: 31% |
| Smaller Players: 20% | Managers: 60% | Americas: 23% |
Market-Sizing & Forecasting
Sizing starts from a top-down demand pool build, where global electronics output and trade data are translated into an addressable device base and then filtered through GPU penetration and configuration mix. We then corroborate the totals with selective bottom-up checks, including sampled supplier revenue splits, channel checks on unit volumes, and an ASP times volume sense-check for key device categories, which helps keep the numbers grounded.
Inputs used in the model include GPU attach rates by device class, discrete versus integrated mix, wafer and packaging capacity signals that affect availability, average selling price movement by performance tier, and the pace of adoption for AI and high-performance computing workloads in data centers. When gaps appear in bottom-up cross-checks, they are handled using proxy indicators like device shipments and import intensity, before being re-tested through expert feedback. Forecasting is done using scenario analysis, with a base case supported by consensus views from interviews on product-cycle timing, supply tightness, and expected pricing normalization.
Data Validation & Update Cycle
Outputs are validated through triangulation across multiple independent checks, including shipment direction, pricing signals, and implied spend per device in major end markets. We run variance checks by region and by year to flag step-changes not supported by demand indicators, and those cases are reviewed again and corrected only after the assumption is traced to a clear source.
Before sign-off, a second analyst review is completed so calculation logic, unit conversions, and currency handling are consistent across the model. Reports are refreshed annually, and interim updates are made when material events occur, such as major supply disruptions or sharp pricing moves. Right before delivery, a final pass is performed so the client receives the latest updated view rather than an older snapshot.
Mordor Intelligence's Graphic Processors Market Size Compared With Other Published Estimates
Published market sizes for graphic processors often differ because the counted revenue pool is not always the same, even when the topic label sounds identical. Differences usually come from what gets included as product versus service revenue, how integrated graphics are treated, and whether the numbers reflect shipments, consumption, or vendor revenue recognition.
GPU-as-a-service and cloud rental fees sit outside Mordor Intelligence's scope here, which reduces the total versus estimates that blend hardware with service or usage revenue streams. In addition, some sources lean on supply-side shipment value in a single year, while others apply aggressive price and demand ramps that are not rechecked against device-level attach rates, discrete versus integrated mix, and currency timing.
Benchmark comparison
| Source | Market Size | Gaps in Research Methodology |
|---|---|---|
| Mordor Intelligence | USD 73.46 B (2025) | |
| Trade Journal A | USD 98.50 B (2024) | Uses a supply-side yearly market value tied to unit shipments across many GPU-using segments, and it can include embedded GPUs and SoC devices that expand the counted pool versus a focused graphic processor revenue definition. |
| Global Consultancy B | USD 78.60 B (2025) | Includes GPU-as-a-service and related service components alongside hardware, and it applies higher growth assumptions tied to broad AI workload scaling that can inflate ASP and mix without consistent device and channel cross-checks. |
The spread in values mainly tracks back to whether service revenue and broader SoC or embedded categories are blended into the total, and how tightly pricing and mix are tied to repeatable demand indicators. By keeping the steps traceable to attach rates, mix, and price movement, the estimate stays easier to explain and to update when new shipment, trade, or product-cycle signals appear.


Key Questions Answered in the Report
How large is the graphic processors market in 2026 and what CAGR is expected through 2031?
The graphic processors market size reached USD 75.08 billion in 2026 and is projected to grow at a 9.28% CAGR to USD 117.01 billion by 2031.
Which GPU type is expanding the fastest?
Hybrid GPUs that merge CPU and GPU cores on one die are forecast to post the quickest growth at 9.83% CAGR through 2031.
Why are cloud GPU services gaining traction?
Second-based billing, stranded-capacity monetization, and burst scalability are driving 10.02% CAGR for cloud-as-a-service deployments.
What is the main geographic growth engine?
Asia-Pacific leads with an 11.52% CAGR as China and India pursue sovereign-AI programs and domestic silicon strategies.
Which vertical shows the highest future demand for GPUs?
Healthcare and life sciences stand out with a 10.93% CAGR, driven by accelerated medical imaging and drug-discovery workloads.
How concentrated is supplier power in data-center GPUs?
The top three vendors commanded roughly 75–80% of 2025 data-center revenue, signaling a high concentrated supplier landscape.
Page last updated on:






