
Market Overview
| Study Period | 2020 - 2031 |
|---|---|
| Forecast Data Period | 2026 - 2031 |
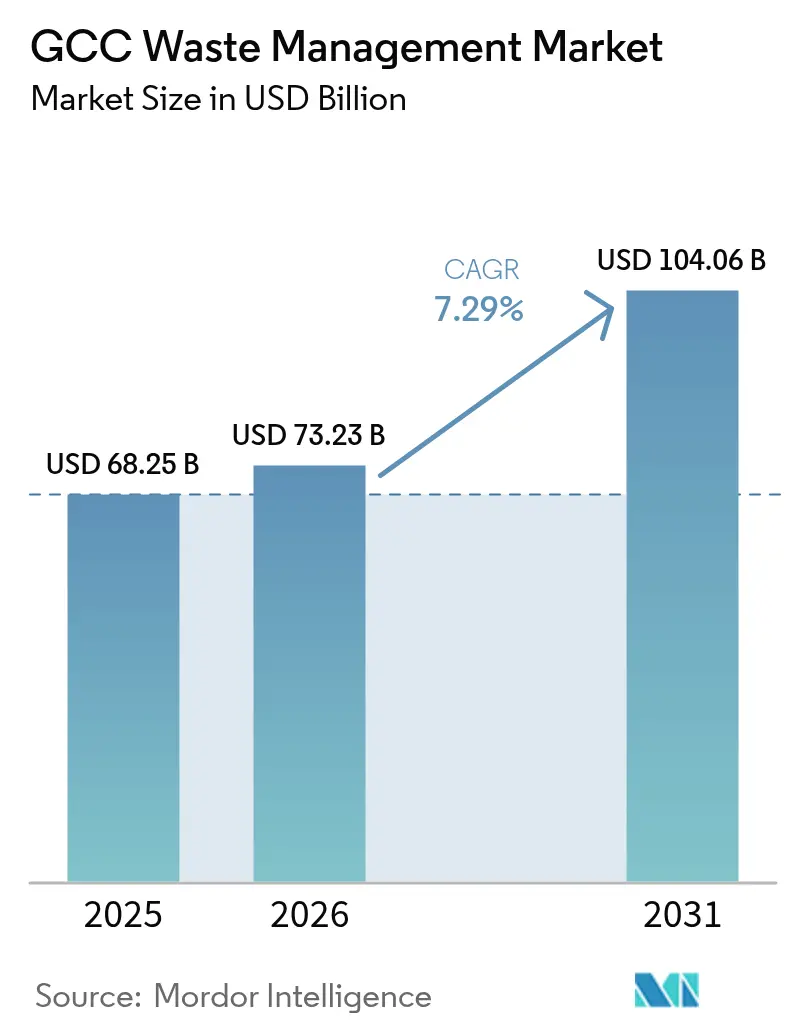
| Base Year Market Size (2025) | USD 68.25 Billion |
| Market Size (2026) | USD 73.23 Billion |
| Market Size (2031) | USD 104.06 Billion |
| Growth Rate (2026 - 2031) | 7.29 % |
| Market Concentration | Medium |
Major Players *Disclaimer: Major Players sorted in no particular order Image © Mordor Intelligence. Reuse requires attribution under CC BY 4.0. | |
GCC Waste Management Market Analysis by Mordor Intelligence
GCC Waste Management Market size in 2026 is estimated at USD 73.23 billion, growing from 2025 value of USD 68.25 billion with 2031 projections showing USD 104.06 billion, growing at 7.29% CAGR over 2026-2031. Rapid urbanization, more than 80% of the region’s residents now live in cities, continues to swell municipal solid waste volumes and intensify demand for modern treatment capacity. Mandatory landfill-diversion targets anchored in national visions, such as Saudi Arabia’s 90% objective by 2040 and the UAE’s 75% recycling ambition, convert policy pressure into steady revenue for integrated players. A rich pipeline of public–private partnerships, worth well over USD 1 trillion in broader infrastructure, is channeling private capital into large-scale waste complexes while accelerating technology transfer. Momentum is further sustained by industrial-symbiosis initiatives that funnel refuse-derived fuel to cement kilns, trimming disposal costs and cutting carbon footprints, and by reward-based reverse-vending schemes that nudge consumers toward recycling.
Key Report Takeaways
- By source, residential streams held 54.03% of the GCC waste management market share in 2025. Commercial waste is forecast to expand at a 9.57% CAGR through 2031.
- By service type, disposal and treatment captured 51.76% of the GCC waste management market size in 2025. Recycling and resource recovery are set to advance at a 9.68% CAGR to 2031.
- By waste type, municipal solid waste accounted for 46.21% of the overall volume in 2025, whereas e-waste registered the fastest 8.55% CAGR.
- By geography, Saudi Arabia led with a 40.05% share of the GCC waste management market in 2025, while the UAE is posting the highest 8.28% CAGR.
Note: Market size and forecast figures in this report are generated using Mordor Intelligence’s proprietary estimation framework, updated with the latest available data and insights as of 2026.
Market Trends and Insights
Drivers Impact Analysis of GCC Waste Management Market*
| Driver | % Impact on CAGR Forecast | Geographic Relevance | Impact Timeline |
|---|---|---|---|
| Mandatory landfill-diversion targets under GCC Vision programs | +2.1% | Saudi Arabia, UAE, Qatar are primary; spillover to Kuwait, Oman, Bahrain | Medium term (2-4 years) |
| Rapid urban population growth is driving MSW volumes | +1.8% | GCC-wide, concentrated in Saudi Arabia, UAE | Long term (≥ 4 years) |
| Surge in public–private partnerships for integrated waste complexes | +1.4% | Saudi Arabia, UAE core markets | Medium term (2-4 years) |
| Industrial-symbiosis zones for cement-kiln co-processing | +0.9% | Saudi Arabia, UAE, Qatar industrial corridors | Long term (≥ 4 years) |
| Commercial roll-out of reverse-vending machines in retail chains | +0.6% | UAE, Saudi Arabia urban centers | Short term (≤ 2 years) |
| Source: Mordor Intelligence | |||
Landfill-diversion Mandates
Vision programs in Saudi Arabia and the UAE elevate waste services from a utility mindset to a strategic industry. Penalty-backed quotas compel municipalities to channel waste into recycling, composting, and energy recovery despite higher up-front costs. Incentive schemes reward early movers, lowering payback periods for new material-recovery facilities. Qatar’s localized approach spurs smaller distributed assets, broadening the addressable contractor pool. ISO 14001 alignment favors players with proven compliance, tilting awards toward technology-rich multinationals.
Rapid Urban Population Growth
City‐centric demographic expansion has pushed annual municipal solid waste beyond 27 million tons. Daily per-capita generation already tops 1.5 kg in Riyadh, testing conventional collection fleets. Rising affluence is shifting the composition toward packaging-heavy materials, complicating separation yet making scale economics attractive for automated sorting plants. Dense urban clusters reduce haul distances and improve plant utilization rates, supporting positive project cash flows. Urban planning codes now embed waste-management provisions, ensuring a predictable base of long-term demand.
PPP Surge for Waste Complexes
A USD 1.1 trillion infrastructure slate includes about 200 Saudi PPP tenders that bundle collection, transfer, treatment, and energy recovery into single-source contracts. Such structures transfer volume risk while synchronizing municipal budget cycles with 25-year asset lives. Riyadh’s integrated concessions are already cutting interface costs and boosting diversion rates. Still, the model’s success hinges on enforceable regulatory frameworks and transparent tariff formulas, areas where GCC regulators are tightening oversight.
Cement-kiln Co-processing Zones
Cement plants substituting 15%–20% of fossil fuels with refuse-derived blends now anchor emerging industrial-symbiosis hubs. The dual benefit of lower input costs and avoided landfill fees underpins circular-economy economics. Saudi clusters like Jubail pair petrochemical by-products with construction rubble to close material loops. Geographic proximity remains essential; thus, processing facilities and generators gravitate into industrial corridors, cultivating new regional value chains[1].
Restraints Impact Analysis of GCC Waste Management Market*
| Restraint | % Impact on CAGR Forecast | Geographic Relevance | Impact Timeline |
|---|---|---|---|
| High-levelized cost of waste-to-energy vs. subsidized landfill | -1.2% | GCC-wide, particularly Kuwait, Oman, Bahrain | Medium term (2-4 years) |
| Fragmented municipal fee-collection systems | -0.8% | Kuwait, Bahrain, smaller emirates, secondary cities | Short term (≤ 2 years) |
| Shortage of local hazardous-waste treatment capacity | -0.6% | Kuwait, Oman, Bahrain, northern emirates | Long term (≥ 4 years) |
| Seasonal sandstorms are disrupting collection logistics | -0.4% | Kuwait, Saudi Arabia eastern provinces, Qatar | Short term (≤ 2 years) |
| Source: Mordor Intelligence | |||
High WTE Cost Versus Subsidized Landfill
Gate fees of USD 60–80 per ton remain needed for acceptable waste-to-energy returns, yet tip fees at subsidized landfills linger near USD 10–20 per ton, stunting plant pipelines. Smaller countries with limited tonnage struggle to unlock scale economies, and entrenched subsidy regimes resist externality pricing. Nonetheless, rising urban land prices and stricter environmental compliance steadily narrow the differential, improving bankability in dense metros such as Dubai and Abu Dhabi[2].
Fragmented Municipal Fee Collection
Collection rates swing from 90% in some cities to barely 40% in others, undermining cashflow certainty for investors. Inconsistent billing formats and weak enforcement dilute user-pay signals, discouraging waste reduction and private-sector participation. Large commercial generators exploit loopholes to negotiate bespoke contracts, eroding municipal revenue bases and cross-subsidy structures. Harmonized tariffs and e-billing platforms are starting to address the gap, but progress remains uneven.
*Our forecasts treat driver/restraint impacts as directional, not additive. The impact forecasts reflect baseline growth, mix effects, and variable interactions.
GCC Waste Management Market Segment Analysis
By Source:
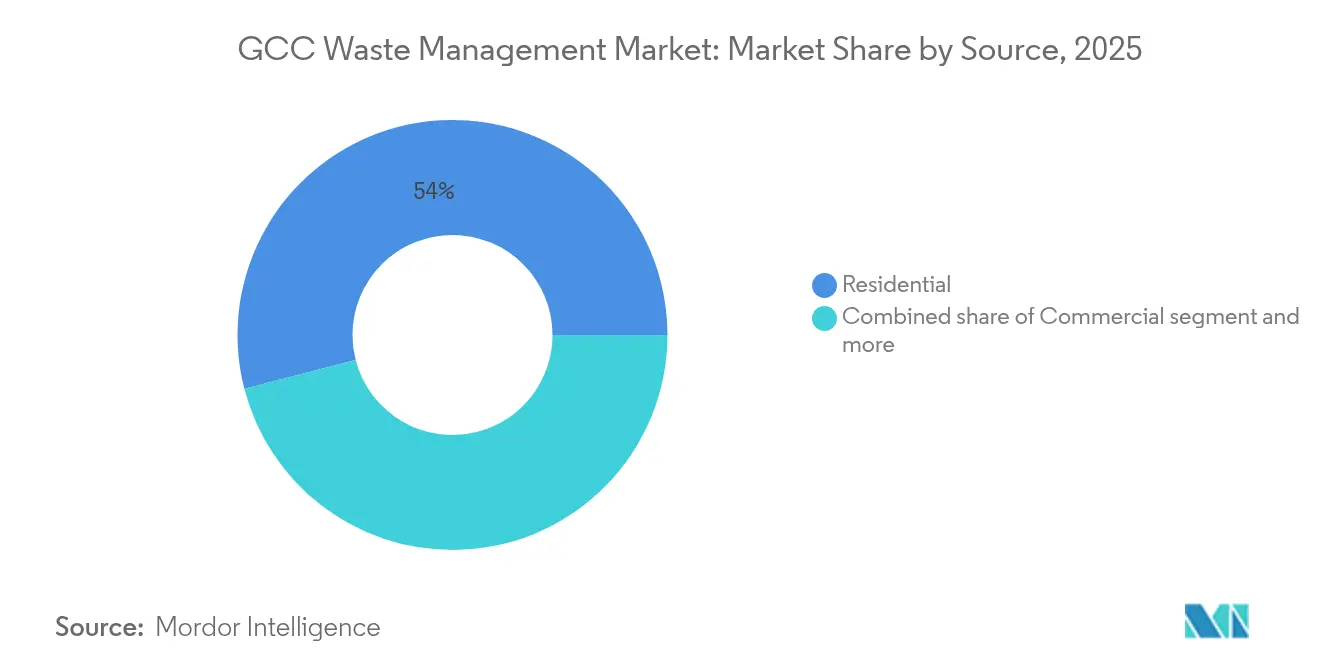
Commercial Streams Outpace Residential Volume GrowthResidential waste preserved a 54.03% share of the GCC waste management market in 2025, reflecting high per-capita generation tied to affluent consumption habits. Commercial waste, however, is forecast to climb 9.57% annually to 2031, fueled by retail expansion and tourism recovery across major cities. Industrial generators deploy circular-production strategies that check volume growth, whereas medical waste, about 21,000 tons in Saudi hospitals alone, commands premium treatment rates. Construction sites contribute up to 70% of Dubai’s daily tonnage, creating a substantial recycled-aggregate opportunity.
Commercial growth also shifts value toward specialized sorting and organic digestion. Mixed-use megaprojects require bundled contracts that cover residential towers, hotels, and malls under single agreements, favoring operators able to scale rapidly. Institutional waste from ministries and universities offers predictable tonnage and compliance-driven margins, reinforcing demand diversity across the GCC waste management market.

By Service Type:
Recycling Accelerates Despite Disposal DominanceLandfilling and basic treatment still accounted for 51.76% of 2025 revenue, but tightening diversion quotas mean their share is slipping each year. Recycling and resource-recovery revenues are growing at a 9.68% CAGR, underpinned by new material-recovery facilities and rising extended-producer-responsibility fees. IoT-enabled collection routes trim fuel use by 28%, improving margins for haulers.
Incineration capacity is expanding through Dubai’s 1.9 million-ton Warsan plant, which will feed 200 MW into the grid. Consulting, audit, and training services capture spillover demand as corporates chase ESG disclosures. Biomedical waste incineration remains capacity-constrained, keeping prices high. Integrated multi-stream contracts now dominate bid tenders, changing competition dynamics within the GCC waste management market.
By Waste Type:
E-waste Posts the Highest Growth TrajectoryMunicipal solid waste retained a 46.21% share in 2025, but e-waste is set to rise at an 8.55% CAGR as device turnover quickens. Formal UAE channels process just 10,000 tons per year, signaling a large informal market ripe for consolidation. Hazardous industrial waste lacks regional capacity, leading Sharjah to commission a USD 27.2 million treatment hub that serves 1,900 factories. Plastic flows, totaling 10 million tons annually, represent a USD 6 billion circular-economy prize once value-chain leakages are closed.
Construction and demolition debris continues to dwarf other streams, yet pilot crushers producing recycled aggregates have demonstrated technical viability, supporting green-building credits. Agricultural by-products, mainly date-palm residues, supply feedstock to composters and biochar kilns that enhance arid soils. These evolving compositions collectively reinforce revenue diversity across the GCC waste management market.

Geography Analysis
Saudi Arabia Waste Management Market
Saudi Arabia led with 40.05% of the GCC waste management market in 2025, thanks to more than 110 million tons of annual waste and multi-billion-dollar Vision 2030 investments aimed at 90% diversion. The National Center for Waste Management targets 840 new facilities backed by USD 14.7 billion in funding, while the Saudi Investment Recycling Company pursues an 81% recycling rate by 2035. Thirteen industrial clusters anchor integrated waste-to-resource corridors that tap existing petrochemical assets.
United Arab Emirates Waste Management Market
The UAE is projected to grow fastest at 8.28% CAGR to 2031 as Dubai commissions the world’s largest waste-to-energy plant and deploys AI-driven collection platforms that cut operational costs by as much as 80%. Abu Dhabi’s Tadweer advances circular-economy outreach, whereas Sharjah’s Beeah aims for zero landfill via reverse vending and comprehensive sorting. Streamlined permitting and performance-based contracts shorten payback periods, encouraging private equity inflows into the GCC waste management market.
GCC Waste Management Market
Qatar pushes localized treatment under National Vision 2030, with medical facilities showcasing best-practice segregation and sterilization. Kuwait grapples with sandstorm-related stoppages costing the oil sector USD 9.36 million yearly, yet construction rubble recycling is emerging as a viable offset. Oman’s Vision 2040 eyes 60% diversion via IoT-enabled pilots in Al-Duqm that delivered 41.5% efficiency gains. Bahrain’s dense footprint suggests centralized mega plants, but land scarcity accelerates the shift toward energy recovery and advanced composting.
Regulatory Landscape
Regulation across the GCC is increasingly anchored in national waste laws and emirate-level implementing resolutions that tighten licensing, tracking, and diversion compliance. In the UAE, Federal Law No. (12) of 2018 on Integrated Waste Management provides the overarching framework, while Dubai added a more detailed local layer through Law No. (18) of 2024 on waste management and Administrative Resolution No. (34) of 2026 that operationalizes requirements for regulated waste handling under Dubai Municipality supervision, including controls that extend across private entities and free zones.
Saudi Arabia has formalized governance and technical compliance under its Waste Management Law framework, with the National Center for Waste Management (MWAN/NCWM) and the National Centre for Environmental Compliance (NCEC) central to oversight. In August 2025, Ministerial Decision 25146805 (published in Umm Al-Qura) approved 14 technical standards and guidelines, strengthening standardization for service providers and facility operators. In Abu Dhabi, the Environment Agency Abu Dhabi (EAD) policy framework emphasizes licensed Waste Service Providers and end-to-end auditability, including electronic manifesting and traceable waste movement from collection through transfer and treatment.
Value Chain Analysis
The GCC waste management value chain begins with waste generation (residential, commercial, industrial, medical, and construction and demolition) and proceeds through collection and transport, transfer stations, sorting and segregation, treatment and disposal, and downstream offtake markets for recovered materials and energy. Municipalities and national waste bodies typically set contracting structures and performance requirements, while integrated operators (such as Beeah, Tadweer, and Averda) coordinate multi-stream logistics and invest in sorting and processing assets.
Technology providers and EPC partners enable high-capex steps such as material recovery facilities and waste-to-energy, while cement plants and industrial corridors provide critical offtake for refuse-derived fuel, linking recovery economics to industrial demand. Key bottlenecks center on feedstock quality and traceability, where limited source segregation constrains yields for advanced recycling and WtE and raises processing costs. Differing local rules also increase compliance complexity for cross-emirate and cross-border movements. The chain is being extended by new recovery nodes and circular-economy projects, including upgrades and new-build MRF capacity (for example, Tadweer-led 400,000-tonne per year processing capacity projects in Al Ain) and waste conversion pathways under development in the UAE (such as Beeah and partners advancing a Phase 2 expansion of Sharjah WtE to 60 MW). Specialized recycling capacity additions, including Oman-based initiatives that convert historical mining waste into secondary metals, further show how non-municipal streams are feeding new material recovery routes alongside traditional MSW systems.
Competitive Landscape
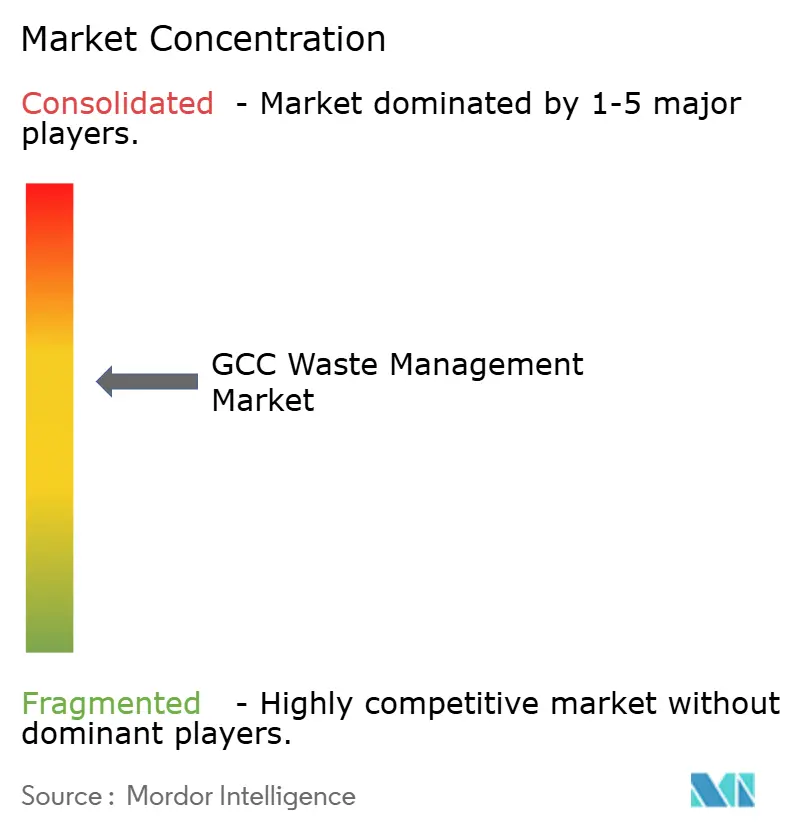
Regional competition is moderate, with the top five operators controlling roughly 45% of revenue. Averda, Beeah, and Tadweer leverage long-term municipal contracts, whereas SUEZ and Veolia transfer global know-how into high-capex niches like hazardous waste and WTE. Strategic partnerships, such as SUEZ’s framework deal with the Saudi Investment Recycling Company, unlock large pipelines aligned with Vision 2030. Technology spend focuses on sensorized bins, AI routing, and blockchain manifests that certify end-destinations, differentiating service bids across the GCC waste management market.
White-space opportunities persist in e-waste dismantling, medical waste sterilization and crushed-aggregate plants. Start-ups offering digital marketplaces for secondary materials are gaining traction but face scale hurdles. ESG reporting requirements tilt RFP scoring toward operators accredited under ISO 14001 and GRI standards, advantaging global entrants. Mid-sized local firms respond through joint ventures that pool balance sheets and compliance systems.
GCC Waste Management Industry Leaders
-
Averda
-
Bee’ah (Sharjah)
-
Tadweer (Abu Dhabi Waste Management Co.)
-
SUEZ Middle East Recycling LLC
-
Veolia Middle East
- *Disclaimer: Major Players sorted in no particular order
GCC Waste Management Market Companies Covered in this Report
- Averda
- Bee’ah (Sharjah)
- Tadweer (Abu Dhabi Waste Management Co.)
- SUEZ Middle East Recycling LLC
- Veolia Middle East
- EnviroServe
- SEPCO Environment
- Saudi Investment Recycling Company
- Wasco
- Dulsco Waste Management Services
- Green Mountains
- Blue LLC
- Envac
- Power Waste Management & Transport LLC
- Al Haya Enviro
- United Waste Management Company
- Kuwait Waste Collection & Recycling Company
- Oman Environmental Services Holding Co. (be’ah Oman)
- Bin-Ovations
- Sharaf DG Recycling
Market Opportunities and Future Outlook
Digitization and compliance-led transparency are creating a concrete procurement and solution space across the GCC, with Saudi Arabia leading the push. In April 2026, MWAN launched the Expression of Interest stage for a National Digital Waste Management Platform under an 11-year DBFOMT PPP, structured around core applications and functional modules that cover e-manifesting, regulatory reporting, and smart-contract style workflows. By June 2026, the project had attracted expressions of interest from 123 companies, indicating active interest from vendors and operators focused on data platforms, tracking, and compliance automation that can be integrated into collection, transfer, and treatment contracts.
Large-scale treatment capacity expansion and localized infrastructure upgrades are also creating whitespace in midstream sorting and thermal treatment integration, including capacity for specialized hazardous and medical streams. Dubai Municipality announced the Phase 2 expansion for the Warsan Waste-to-Energy Centre in February 2026, while Sharjah’s waste-to-energy facility reported processing 1 million tonnes of waste since 2022 and is advancing Phase 2 to increase capacity (including 60 MW and 600,000 tonnes per year). On medical waste, the Saudi Ministry of Health awarding a SAR 41 million medical waste management project in May 2026 points to continued tender activity tied to compliance-sensitive streams, supporting demand for licensed treatment capacity, traceable logistics, and audit-ready service models.
Recent Industry Developments in GCC Waste Management Market
- June 2026: Tadweer Group awarded a contract to Bou Chalhoub Metrix General Contracting to upgrade, reconstruct, and commission a material recovery facility in Al Ain with 400,000 tonnes of annual processing capacity, with completion targeted for late 2026. The upgrade expands recovery throughput in a secondary city and strengthens the UAE processing network beyond primary metropolitan hubs.
- June 2026: The Department of Municipalities Affairs and BEEAH signed a contract to establish and operate an integrated, centralized waste management project in Al Dhaid City, Sharjah. The project broadens centralized treatment and recovery infrastructure in Sharjah and supports wider deployment of integrated operating models outside core urban centers.
- December 2024: SUEZ and the Saudi Investment Recycling Company entered a framework partnership to co-develop waste-to-energy assets across Saudi Arabia. The collaboration aligns international WtE development capability with a national pipeline tied to diversion targets, reinforcing the role of large PPP-style projects in scaling treatment capacity.
GCC Waste Management Market Report Scope and Research Methodology
Market Definition and Coverage
This market covers the revenues generated from managing waste across GCC countries, starting from collection and transport and going through sorting, treatment, recycling, and final disposal, as these services are paid for by municipalities, businesses, and institutions.
Scope exclusions: Informal, unpaid self-disposal and the value of recovered materials sold as standalone commodities are excluded where they cannot be tied back to waste management service revenues.
Segments Covered in This Report
- By Source
- Residential
- Commercial (retail, office, etc.)
- Industrial
- Medical (Health and Pharmaceutical)
- Construction & Demolition
- Others (institutional, agricultural, etc)
- By Service Type
- Collection, Transportation, Sorting & Segregation
- Disposal / Treatment
- Landfill
- Recycling & Resource Recovery
- Incineration & Waste-to-Energy
- Others (Chemical Treatment, Composting, etc.)
- Others (Consulting, Audit & Training, etc.)
- By Waste Type
- Municipal Solid Waste
- Industrial Hazardous Waste
- E-waste
- Plastic Waste
- Biomedical Waste
- Construction & Demolition Waste
- Agricultural Waste
- Other Specialized Waste (radio active, etc)
- By Country
- United Arab Emirates
- Saudi Arabia
- Qatar
- Kuwait
- Oman
- Bahrain
Data Sources, Market Sizing, and Validation
Desk Research
Desk work starts with building the demand context and policy reality for the GCC, since waste volumes and mandated diversion targets shape spending on collection, treatment, and disposal. We refer to public sources such as national statistics offices and environment ministries in GCC countries, municipal portals, regional policy publications, and international bodies such as the World Bank and UN agencies for solid waste baselines and definitions.
Next, the operating side is mapped using sources like government tenders and procurement notices, regulator and ministry updates on landfill, recycling, and waste-to-energy programs, and company annual reports and investor presentations for service mix and capacity clues. Patent databases are also checked to understand the pace of adoption for sorting, treatment, and recycling technologies, because that timing can change cost and pricing assumptions over the forecast horizon. The sources listed here are illustrative only, and many other public references were used to collect data, cross-check assumptions, and clarify open points.
Primary Interviews and Surveys
We interview municipal officials, contractors, recyclers, treatment operators, and industrial waste buyers across the six GCC countries. Their input helps test fee levels, collection coverage, facility utilization, project timing, and gaps in country data. Surveys provide additional detail on waste volumes and service preferences, while unusual responses are checked against desk evidence before the final GCC model is triangulated.
Distribution of primary research fieldwork respondents
| Company type | Respondent position |
|---|---|
| Top tier: 25% | CXOs: 18% |
| Mid tier: 55% | Functional/Unit leaders: 32% |
| Smaller Players: 20% | Managers: 50% |
Market-Sizing & Forecasting
The core model is built using a top-down approach where population and urbanization patterns, per-capita waste generation, and country-level diversion and treatment pathways are used to reconstruct the payable waste management demand pool across the GCC. Once the waste stream is shaped, it is translated into value using service price ranges observed in tenders and contracts, and then it is split across collection, sorting, recycling, treatment, and disposal activities.
To keep the totals realistic, we corroborate with selective bottom-up checks, such as sampling facility capacities for landfills, recycling lines, and waste-to-energy plants, followed by utilization and average fee assumptions that can be defended in interviews. Practical inputs that move the forecast include municipal and industrial waste growth, construction and demolition activity, landfill gate fees and hauling charges, recycling offtake economics, and the timing of new processing capacity additions. For forecasting, scenario analysis is used with a base case anchored to policy execution speed and procurement timelines, and the variable paths are tested with interview feedback before finalizing the curve. Where bottom-up data is missing for smaller cities or where informal handling is difficult to quantify, gaps are handled through penetration assumptions that are adjusted only after country-level checks are completed.
Data Validation & Update Cycle
Outputs are checked against independent signals such as reported waste volumes, announced diversion targets, tendered project pipelines, and the implied revenue per ton to flag values that do not make operational sense. If a variance looks material, the assumptions are reopened, and clarifying calls are triggered so the same datapoint is not carried forward by mistake.
Before sign-off, the model goes through stepwise internal review where calculations, units, and currency conversions are rechecked, and then the narrative is matched back to the numbers. Reports are refreshed annually, and interim updates are made when material events occur, such as major PPP awards, policy resets, or large capacity start-ups. Right before delivery, a final pass is done so clients receive the most current view available at that time.
Mordor Intelligence's Gcc Waste Management Market Size Measured Against Other Published Estimates
Published market sizes for GCC waste management do not always match, even when the topic name looks identical, because analysts often apply different service boundaries and different years for base values. The biggest swings usually come from what is counted as paid waste management activity, how recycling and treatment revenues are treated, and the time window used for inflation and currency conversions.
Tender pricing signals and country-level waste volume checks are the anchors used in Mordor Intelligence's estimate. Once these are applied consistently across collection, sorting, recycling, treatment, and disposal, adjacent but non-service value is screened out. In other publications, the spread can also come from longer forecast windows that assume aggressive policy delivery, or from mixing municipal and industrial pathways without validating capture rates and utilization for new capacity.
Benchmark comparison
| Source | Market Size | Gaps in Research Methodology |
|---|---|---|
| Mordor Intelligence | USD 68.25 B (2025) | |
| Global Consultancy A | USD 70.97 B (2025) | The scope description on the public summary is less explicit on how recycling and disposal revenues are separated from material value, and the CAGR period runs longer, which can shift the base-year normalization and implied price progression. |
| Regional Research Group B | USD 66.10 B (2024) | Uses a different base year and a longer forecast window, and the public outline does not clarify how service revenues are mapped across GCC countries when waste capture rates and formalization levels vary by location. |
Across the three figures, the gap is not large in absolute terms, but it is explainable once you line up base years, what counts as service revenue, and how quickly policy-led diversion is assumed to translate into paying volumes. Our approach stays traceable to observable waste volumes, capacity reality, and contract price signals, which helps keep the final number practical for planning and budgeting.
Key Questions Answered in the Report
What is the 2026 value of GCC waste services?
The GCC waste management market size is USD 73.23 billion in 2026.
How fast is the sector growing to 2031?
Revenue is projected to rise at a 7.29% CAGR, reaching USD 104.06 billion by 2031.
Which country leads regional revenue?
Saudi Arabia held 40.05% of regional share in 2025, supported by Vision 2030 targets.
What segment grows fastest through 2031?
Commercial waste streams register the highest 9.57% CAGR across the forecast.