
DNA Sequencing Market Size and Share
Market Overview
| Study Period | 2020 - 2031 |
|---|---|
| Market Size (2026) | USD 17.08 Billion |
| Market Size (2031) | USD 40.02 Billion |
| Growth Rate (2026 - 2031) | 18.58 % |
| Fastest Growing Market | Asia-Pacific |
| Largest Market | North America |
| Market Concentration | Medium |
Major Players *Disclaimer: Major Players sorted in no particular order Image © Mordor Intelligence. Reuse requires attribution under CC BY 4.0. | |
DNA Sequencing Market Analysis by Mordor Intelligence
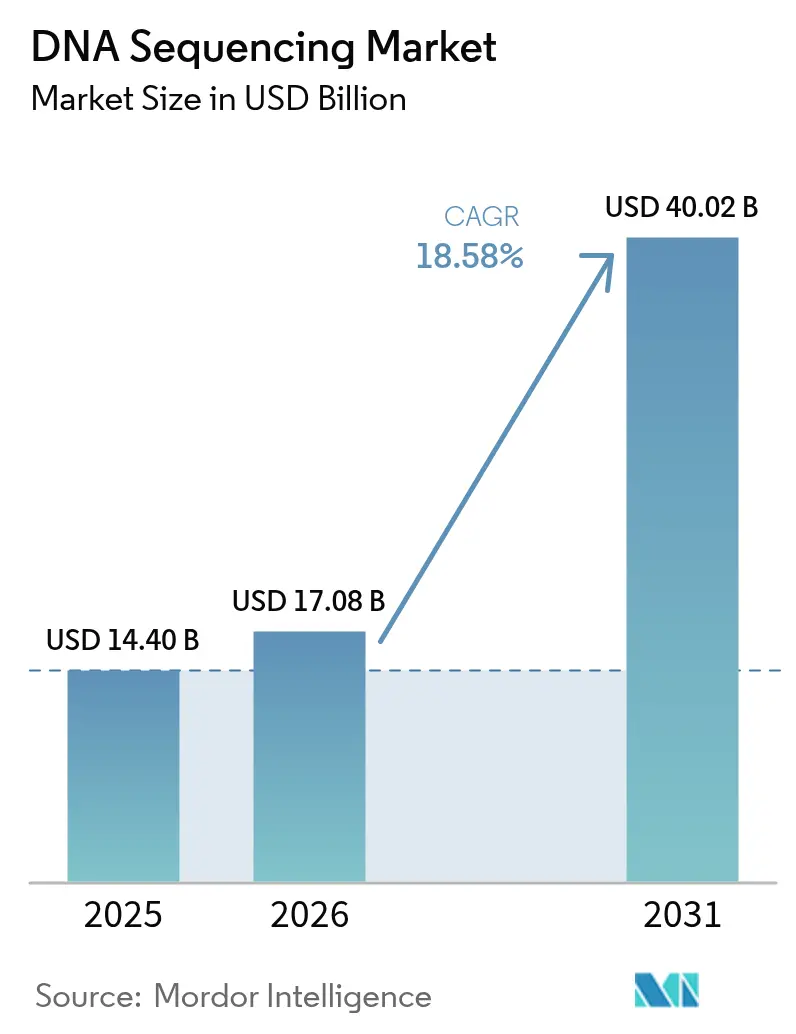
The DNA sequencing market size in 2026 is estimated at USD 17.08 billion, growing from 2025 value of USD 14.4 billion with 2031 projections showing USD 40.02 billion, growing at 18.58% CAGR over 2026-2031. Demand is shifting from academic discovery toward routine clinical testing in oncology, rare disease, and infectious-disease surveillance. A sustained drop in cost-per-genome, steady reimbursement expansion, and government-funded precision-medicine programs are widening patient access while enlarging installed instrument bases. Nanopore and other long-read platforms are eroding the short-read stronghold by resolving complex genomic regions, whereas cloud bioinformatics and AI pipelines streamline interpretation and cut turnaround times. Nevertheless, fragmented data-privacy rules and geopolitical supply-chain risks raise compliance costs and threaten reagent continuity, tempering growth momentum.
Key Report Takeaways
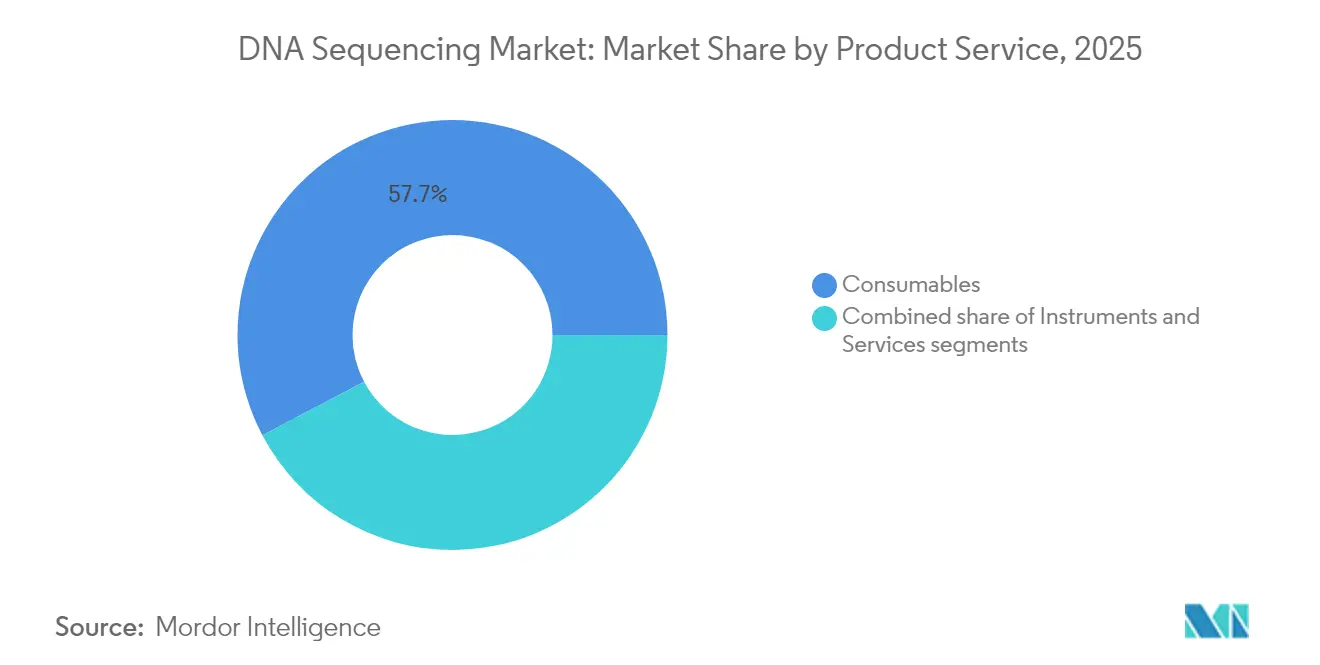
- By product & service, consumables held 57.73% of DNA sequencing market share in 2025 while sequencing-as-a-service is expected to scale at an 17.85% CAGR through 2031.
- By sequencing technology, next-generation sequencing accounted for 80.98% of the DNA sequencing market share in 2025; nanopore sequencing is forecast to post a 27.62% CAGR between 2026 and 2031.
- By workflow step, sequencing activities captured 44.92% of the DNA sequencing market size in 2025, whereas data analysis and storage are projected to climb at a 19.55% CAGR to 2031.
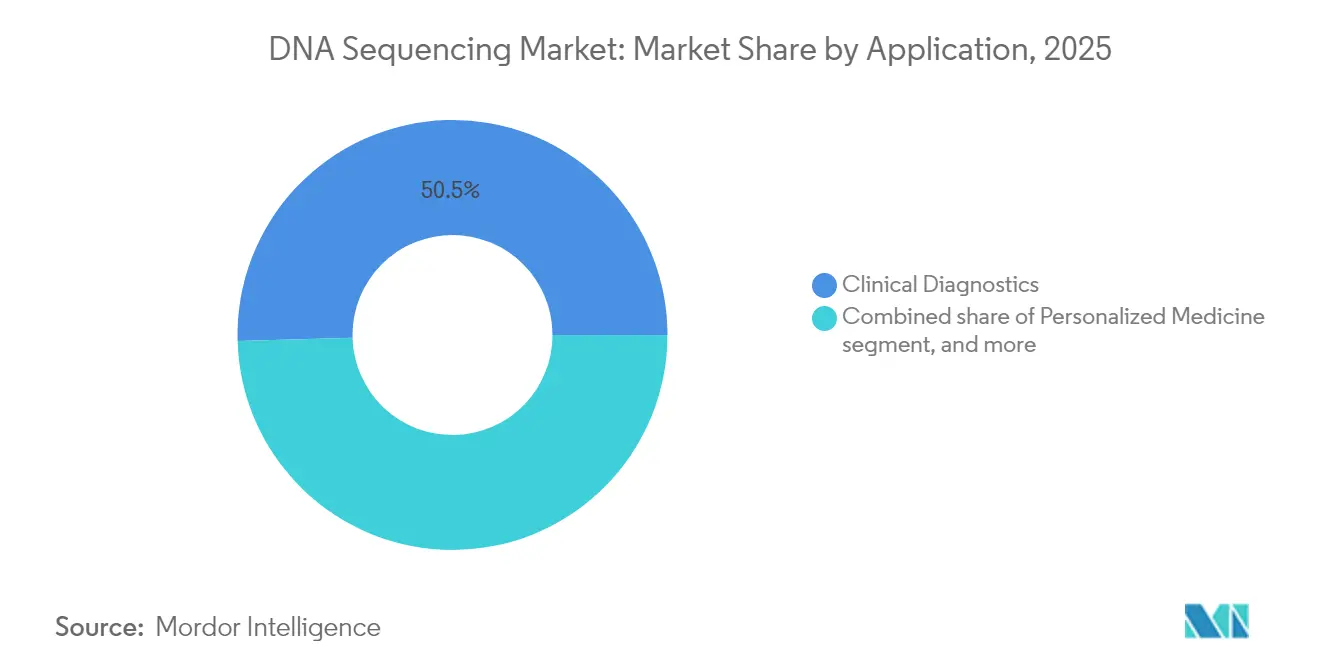
- By application, clinical diagnostics represented 50.45% of revenue in 2025 and oncology diagnostics is rising at a 18.95% CAGR over 2026-2031.
- By end user, academic institutions controlled 39.78% of the DNA sequencing market size in 2025 while hospitals and clinical laboratories are anticipated to grow at a 16.72% CAGR through 2031.
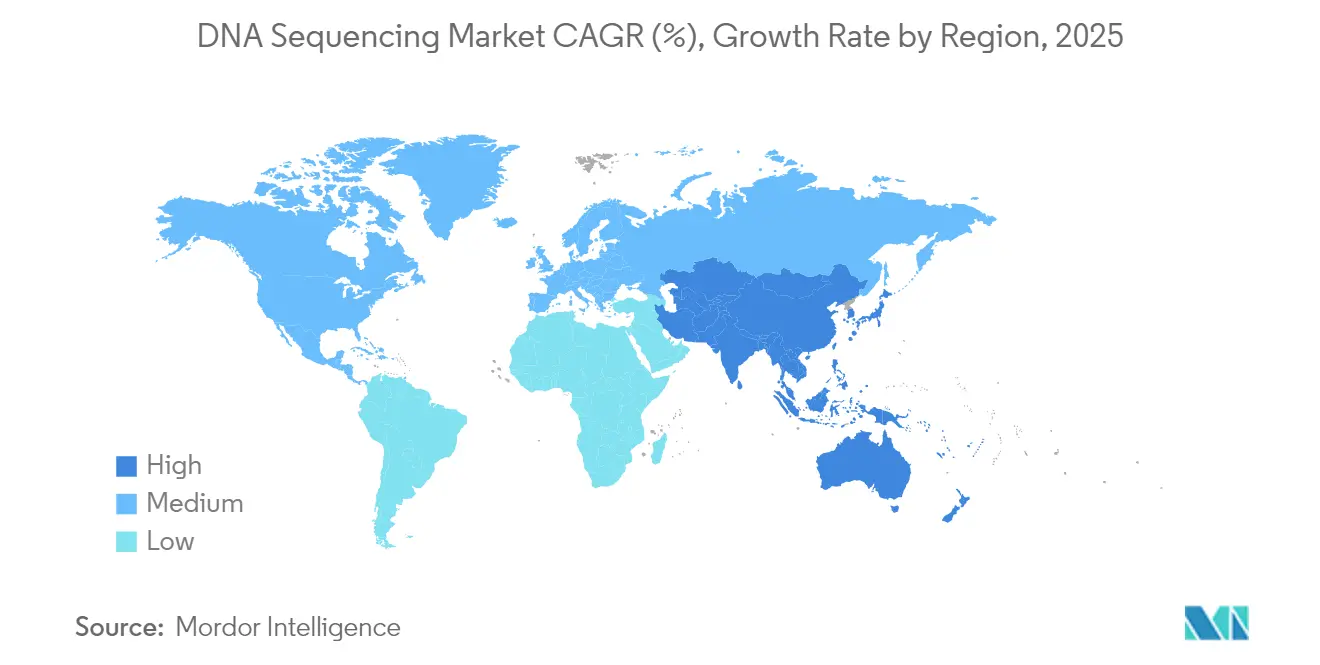
- By geography, Asia Pacific is the fastest-growing region with a 19.12% CAGR, whereas North America retained a 44.65% revenue share in 2025.
Note: Market size and forecast figures in this report are generated using Mordor Intelligence’s proprietary estimation framework, updated with the latest available data and insights as of 2026.
Market Trends and Insights
Drivers Impact Analysis of DNA Sequencing Market*
| Driver | % Impact on CAGR Forecast | Geographic Relevance | Impact Timeline |
|---|---|---|---|
| Declining cost-per-genome with higher-throughput platforms | +2.0% | Global | Long term (≥ 4 years) |
| Broader reimbursement and approvals for clinical sequencing | +1.7% | North America, Europe, Asia Pacific | Medium term (2-4 years) |
| Government precision-medicine and population genomics programs | +1.5% | US, EU, Asia Pacific | Long term (≥ 4 years) |
| Genomics-based drug discovery and companion diagnostics uptake | +1.3% | Global | Medium term (2-4 years) |
| Expansion of long-read, single-cell and multi-omics workflows | +1.2% | Global | Long term (≥ 4 years) |
| Growth of sequencing-as-a-service and cloud bioinformatics | +1.0% | Global (strongest in developed hubs) | Short term (≤ 2 years) |
| Source: Mordor Intelligence | |||
Declining Cost-Per-Genome Revolutionizes Access
Sequencing a whole human genome has fallen from USD 1 million in 2007 to under USD 600 in 2025, unlocking routine use across community hospitals. Illumina’s NovaSeq X cuts that figure below USD 200, and Ultima Genomics markets a USD 100 genome, altering budget allocation toward data interpretation tools. United Kingdom oncology centers now deploy whole-genome sequencing for pediatric cancers, and Germany and Sweden are piloting similar programs[1]. Vendors are pivoting from hardware sales to application-specific solutions; Illumina’s acquisition of Fluent BioSciences strengthens single-cell assay portfolios, underscoring a shift toward higher-margin, software-rich offerings. As costs approach commodity levels, competitive focus centers on differentiated chemistry and bioinformatics ecosystems.
Broader Reimbursement Accelerates Clinical Adoption
Centers for Medicare & Medicaid Services expanded national coverage for next-generation sequencing in solid tumors in 2024, removing a primary barrier to uptake. The National Comprehensive Cancer Network now recommends whole-genome sequencing for acute myeloid leukemia, further cementing clinical demand. Yet reimbursement remains patchy across private payers and European insurers, prompting vendors to invest in health-economics evidence packages and payer-education teams. Local Coverage Determinations increasingly target high-value uses such as indeterminate pulmonary-nodule risk stratification, creating incremental tailwinds.
Government Precision-Medicine Programs Drive Infrastructure
The US National Human Genome Research Institute directs USD 5.3 million annually toward embedding genomics in routine care, while Singapore’s National Precision Medicine initiative partners with PacBio and Oxford Nanopore to generate long-read reference genomes for Asian populations. European Horizon projects dedicate grant funding to polygenic-risk-score development for under-represented ancestries. Such programs provide sequencer placements, biobank samples, and standard operating procedures that collectively lower commercial-entry barriers and expand the DNA sequencing market.
Genomics-Based Drug Discovery Expands Applications
Pharmaceutical developers rely increasingly on large-scale sequencing for target validation and companion diagnostics. Illumina is piloting a whole-genome minimal residual-disease test for solid tumors, enabling early relapse detection. Artificial-intelligence platforms trained on multi-omics datasets accelerate hit-to-lead cycles, with the AI in bioinformatics segment predicted to surpass USD 37 billion by 2029[2]. The FDA guidance on decentralized clinical trials allows remote genomic sample collection, broadening patient participation and cementing sequencing as a backbone of future drug development.
Restraints Impact Analysis of DNA Sequencing Market*
| Restraints Impact Analysis | (~) % Impact on CAGR Forecast | Geographic Relevance | Impact Timeline |
|---|---|---|---|
| High capital and operating costs of high-throughput systems | −1.6% | Global | Short term (≤ 2 years) |
| Bioinformatics talent shortage and analysis bottlenecks | −1.4% | Global (acute in emerging markets) | Medium term (2-4 years) |
| Fragmented global regulatory and data-privacy landscape | −1.3% | North America, EU, cross-border trade | Medium term (2-4 years) |
| Supply-chain volatility for critical reagents and flow cells | −1.1% | Global (notably US–China corridors) | Short term (≤ 2 years) |
| Source: Mordor Intelligence | |||
High Capital Costs Create Market Entry Barriers
A top-tier high-throughput instrument can exceed USD 1 million, with annual maintenance contracts adding significant overhead. Smaller laboratories defer acquisition or rely on reagent-rental models and centralized core facilities. Element Biosciences attempts to democratize access with the USD 289,000 AVITI system that features per-gigabase operating costs of USD 2-USD 5, yet the razor-and-blade economics still favor incumbents that control consumable supply. Capital requirements therefore slow expansion in low-resource settings and reinforce economies of scale for established vendors.
Bioinformatics Bottlenecks Constrain Value Extraction
Sequencer throughput keeps doubling, while demand for data-science professionals has jumped 42% since 2018. Shortages in Python, SQL, and R expertise delay variant interpretation, limiting clinical utility. Automation efforts such as Illumina’s DRAGEN pipeline and DNAnexus-Intelliseq’s AI-driven annotation alleviate but do not eliminate these gaps. Complex structural-variant calling and novel rare-variant curation still need manual review, constraining the speed at which end users can translate sequencing data into actionable decisions.
*Our forecasts treat driver/restraint impacts as directional, not additive. The impact forecasts reflect baseline growth, mix effects, and variable interactions.
DNA Sequencing Market Segment Analysis
By Product & Service:
Recurring Consumables Revenue Dominates Operating ModelsConsumables generated 57.73% of revenue in 2025 owing to proprietary flowcells and reagent kits that users must reorder for every run, underscoring the razor-and-blade model that supports the DNA sequencing market. Margins on chemistry routinely outpace those on instruments, funding accelerated product refresh cycles. Services, including sequencing-as-a-service and data analytics, are climbing at an 17.85% CAGR as laboratories outsource complex informatics and compliance workloads.
Consumable innovation now focuses on lowering cost and increasing throughput. Ultima Genomics is moving to unpatterned wafers that shrink lithography expense and facilitate scale-out manufacturing. Meanwhile, service providers such as DNAnexus couple cloud compute, compliance, and AI interpretation to deliver end-to-end actionable reports rather than raw data, enhancing customer stickiness. Together these shifts position recurring consumables and managed services as the lifeblood of the DNA sequencing market.

By Sequencing Technology:
Short-Read Platforms Still Dominate but Long-Read Solutions Close the GapNext-generation short-read instruments captured 80.98% of revenue in 2025 thanks to validated clinical workflows, high accuracy, and wide assay menus. Nanopore sequencing is the fastest-growing subsegment at a 27.62% CAGR, propelled by real-time long reads that resolve structural variants and methylation patterns. PacBio’s SPRQ chemistry drops HiFi human genome costs below USD 500, improving affordability for population studies.
Oxford Nanopore’s PromethION 2 Integrated delivers up to 290 Gb per flowcell with onboard compute, while its 99.7% single-nucleotide accuracy strengthens clinical credibility. Vendors increasingly promote hybrid pipelines that merge short-read economy with long-read context, broadening use scenarios from oncology to metagenomics and transcriptomics. Competitive intensity is therefore accelerating innovation pace across both read-length regimes.
By Workflow Step:
Data Analysis Becomes Principal Growth EngineSequencing itself retained 44.92% of 2025 revenue, yet data analysis and storage are expected to grow 19.55% annually through 2031. Growth reflects escalating file sizes from multi-omics projects and the clinical need for rapid, confident interpretation. Illumina’s DRAGEN 4.3 introduces multi-genome graph mapping, while tools such as Sniffles2 refine structural-variant calling in long-read files.
Laboratory automation extends upstream to sample prep, with low-input, multichannel library kits trimming hands-on minutes and reagent waste. Cloud pipelines democratize high-performance computation, letting mid-tier hospitals bypass local server investment. As reimbursement ties payment to actionable reports rather than raw sequence, value migrates to informatics, solidifying analysis as the fastest-growing revenue layer in the DNA sequencing market.
By Application:
Diagnostics Surpass Research As Chief Revenue ContributorClinical diagnostics produced 50.45% of sales in 2025, overtaking research uses for the first time. Oncology drives uptake, with comprehensive genomic profiling gaining payer endorsement through 2031. ASCO emphasizes RNA sequencing to capture fusions that DNA assays may miss, broadening the clinical toolkit.
Rare disease, pharmacogenomics, and reproductive health applications also expand. A Romanian lung-cancer cohort saw actionable variants in 74.8% of patients via upfront NGS, though only 35.3% accessed matched therapy because of reimbursement and performance-status barriers. Molecular residual-disease tests aim to provide longitudinal cancer monitoring, setting the stage for recurring patient testing and sustained revenue for the DNA sequencing market.
By End User:
Academic Centers Pioneer, Hospitals Scale AdoptionAcademic institutions commanded 39.78% of 2025 revenue, leveraging grant funds to pilot single-cell and spatial-omics workflows. Hospitals and clinical labs are projected to grow 16.72% per year through 2031 as turnkey platforms simplify validation and reporting. Illumina’s MiSeq i100 offers four-hour runs and ambient-temperature reagents, enabling same-day pathogen detection in urgent-care settings.
Pharmaceutical and biotechnology companies integrate sequencing into target discovery, patient stratification, and companion-diagnostic co-development, providing a steady pipeline of contract sequencing work. Niche users in forensic genetics and consumer wellness add incremental volume, though they raise privacy and ethical considerations that require robust governance frameworks.
Geography Analysis
North America DNA Sequencing Market
North America accounted for 44.65% of 2025 revenue, fueled by Medicare coverage expansion, abundant venture capital, and a supportive FDA framework. The National Institutes of Health channel multi-year grants into rare-disease and cancer-genome initiatives, while infrastructure laws incentivize bio-manufacturing. Proposed US legislation restricting Chinese genomic suppliers, however, threatens reagent flow and increases inventory costs for domestic labs.
APAC DNA Sequencing Market
Asia Pacific is poised to be the fastest-growing territory with a 19.12% CAGR, driven by population-scale sequencing projects and rising healthcare spend. China dominates volume through hospital cancer registries and direct-to-consumer tests, whereas Singapore’s long-read population program aims to create a high-quality Asian reference genome that underpins regional assays. India announces biobank networks under its National Genomics Mission, though disparate reimbursement hinders clinical roll-out.
EMEA and South America DNA Sequencing Market
Europe maintains significant share through publicly funded health systems that embed genomic testing into routine care. The General Data Protection Regulation enforces strict consent protocols and cross-border data rules, raising compliance costs. The UK’s Genomics England targets 5 million whole genomes, Germany funds hospital digitalization for genomic data integration, and France’s national plan scales newborn-screening pilots. Emerging markets in the Middle East, Africa, and South America remain nascent but invest in oncology sequencing and infectious-disease surveillance as costs fall and mobile labs spread to remote clinics.
Mordor Intelligence provides coverage of the dna sequencing market across other key regional markets, including North America, each with their regulatory frameworks and demand patterns.
Regulatory Landscape
The regulatory environment for DNA sequencing is shaped by different pathways for in vitro diagnostics and by tighter scrutiny of NGS methods used in advanced therapies. In the United States, FDA oversight for NGS-based tests covers device classification and performance expectations for tumor profiling (for example, 21 CFR 866.6080). In April 2026, the agency moved to issue draft guidance on safety assessment of genome editing in human gene therapy products using next-generation sequencing, which reinforces expectations around analytical performance and bioinformatics reliability in higher-risk applications.
In Europe, the In Vitro Diagnostic Regulation (IVDR, EU 2017/746) continues to tighten conformity assessment requirements for NGS panels, increasing the importance of notified bodies and quality systems for manufacturers selling into EU health systems. Transition timelines remain a key planning anchor, with IVDR deadlines set at 31 December 2027 for Class D and 31 December 2028 for Class C devices. Alongside device rules, standardization efforts such as NIST metagenomics reference materials (for example, RM 8375 and RM 8376) and NIST work on genomic data cybersecurity and privacy frameworks are increasingly used to benchmark sequencing performance and data handling in regulated workflows.
Competitive Landscape
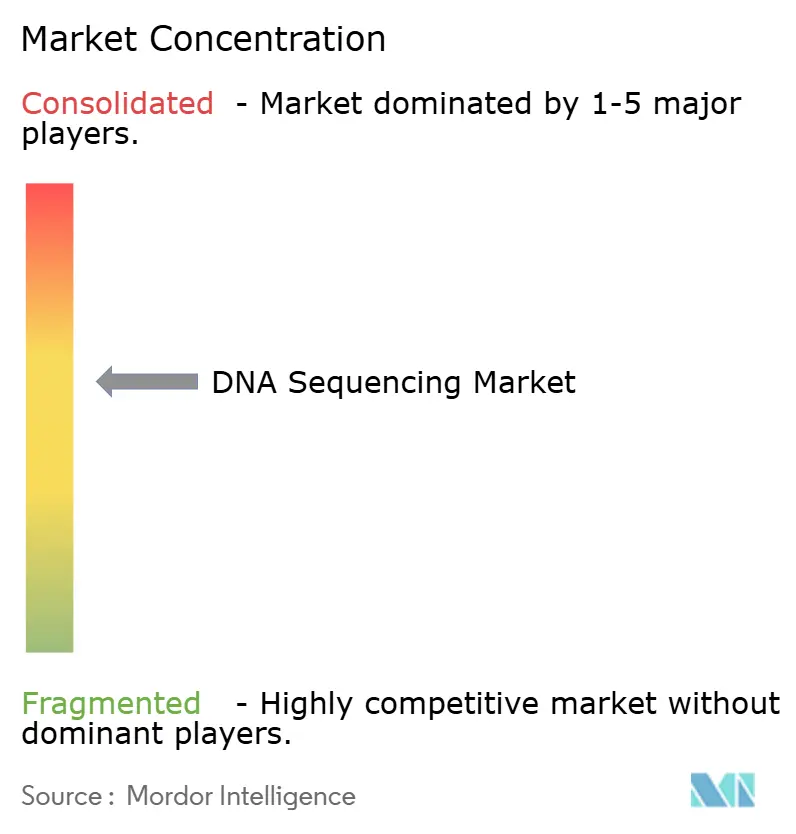
The DNA sequencing market is moderately concentrated. Illumina retains close to 66% of global placements through its MiSeq, NextSeq, and NovaSeq families. Oxford Nanopore and PacBio compete in long-read niches, while Element Biosciences challenges benchtop economics with the AVITI system’s USD 2-USD 5 per-gigabase running cost.
Strategic acquisitions shape competition. Illumina bought Fluent BioSciences for single-cell assay capabilities, and Hitachi High-Tech acquired Nabsys to commercialize electronic genome mapping. PacBio’s SPRQ chemistry narrows cost gaps, and newcomers such as 454.bio aim to deliver open-source sequencers at roughly USD 33 per run, targeting educational markets.
Supply-chain resilience has emerged as a competitive differentiator amid proposed US restrictions on Chinese genomics vendors. Vendors are diversifying reagent manufacturing footprints and forging second-source agreements. White-space opportunities persist in point-of-care sequencing, fully automated sample-to-report instruments, and integrated analysis platforms that ease the bioinformatics bottleneck.
DNA Sequencing Industry Leaders
-
Merck KGaA
-
Thermo Fisher Scientific, Inc.
-
Agilent Technologies, Inc.
-
Illumina, Inc.
-
F. Hoffmann-La Roche Ltd.
- *Disclaimer: Major Players sorted in no particular order
DNA Sequencing Market Companies Covered in this Report
- Agilent Technologies
- Bio-Rad Laboratories
- Danaher Corp. (IDT)
- Roche
- Illumina
- Merck
- PerkinElmer
- Thermo Fisher Scientific
- QIAGEN
- Macrogen
- Myriad Genetics
- Eurofins
- Hamilton Thorne
- Pacific Bioscience
- Oxford Nanopore Technologies PLC
- BGI Genomics Co. Ltd. (MGI Tech)
- 10x Genomics Inc.
- GenScript Biotech Corp.
Market Opportunities and Future Outlook
A clear opportunity is shortening turnaround times and simplifying operational steps for clinical and translational workflows, where instrument makers are packaging chemistry, informatics, and standardized workflows as end-to-end solutions. In 2026, Illumina launched TruPath Genome as a comprehensive whole-genome solution, positioned around higher daily genome output. Roche also launched the AXELIOS 1 NGS platform using SBX technology to target same-day whole-genome sequencing in research workflows, keeping competition focused on throughput, workflow integration, and standardized reporting rather than instrument-only differentiation.
Long-read sequencing economics and population-scale program requirements are also creating whitespace for structural variant, repeat expansion, and epigenetic use cases that strain short-read-only pipelines. PacBio began global shipping of SPRQ-Nx chemistry for Revio in May 2026, with a per-genome list price point around USD 345 and continued emphasis on lowering the cost barrier for large-scale projects. At the workflow edge, purchases of sample-to-answer and automation-adjacent tools address bioinformatics and hands-on labor constraints cited by end users, including n6 opening orders for the icon16 adaptive amplification system in July 2026 to support lower-throughput NGS workflows. On the demand side, reimbursement remains a key lever for sustaining clinical testing volume, with CMS activity in oncology genetic testing and pharmacogenomic billing and coding providing practical anchors for labs expanding menu breadth and standard operating procedures in regulated environments.
Recent Industry Developments in DNA Sequencing Market
- July 2026: Thermo Fisher Scientific received FBI National DNA Index System (NDIS) approval for the Applied Biosystems RapidIntel Plus cartridge. The authorization expands eligible deployment for rapid DNA profiling workflows in forensic and law-enforcement settings. It reinforces regulatory clearance as a barrier to entry for competing rapid profiling solutions.
- July 2025: Thermo Fisher Scientific introduced the Oncomine Comprehensive Assay Plus on the Ion Torrent Genexus System. The launch broadened an integrated sample-to-report offering for oncology testing. It supports labs seeking faster turnaround and more standardized workflows for clinical sequencing.
- October 2024: PacBio introduced SPRQ chemistry for the Revio system, lowering the stated HiFi human-genome cost below USD 500. The release strengthened long-read competitiveness for large-scale projects. It pushed down per-genome consumable economics and expanded feasible use cases beyond niche structural-variant applications.
DNA Sequencing Market Report Scope and Research Methodology
Market Definition and Coverage
This market covers revenues generated from DNA sequencing workflows and the related tools and services used to read genetic material, starting from sample preparation and sequencing through data analysis and storage. We treat the market as global and measure it in USD for the stated years.
Scope exclusions: Excludes downstream therapeutics, routine pathology services not requiring sequencing, and general lab equipment that is not specifically used for sequencing workflows.
Segments Covered in This Report
- By Product & Service
- Instruments
- Consumables
- Services
- By Sequencing Technology
- Sanger Sequencing
- Next-Generation Sequencing (NGS)
- Illumina SBS
- Ion Semiconductor
- Other Technologies
- Third-Generation Sequencing
- By Workflow Step
- Sample Preparation
- Library Preparation
- Sequencing
- Data Analysis & Storage
- By Application
- Clinical Diagnostics
- Oncology
- Reproductive Health (NIPT, Carrier)
- Infectious Disease
- Rare & Genetic Disorders
- Personalized Medicine
- Drug Discovery & Development
- Other Applications
- Clinical Diagnostics
- By End User
- Hospitals & Clinical Laboratories
- Academic & Research Institutes
- Pharmaceutical & Biotechnology Companies
- Other End Users
- Geography
- North America
- United States
- Canada
- Mexico
- Europe
- Germany
- United Kingdom
- France
- Italy
- Spain
- Rest of Europe
- Asia-Pacific
- China
- Japan
- India
- Australia
- South Korea
- Rest of Asia-Pacific
- Middle East & Africa
- GCC
- South Africa
- Rest of Middle East & Africa
- South America
- Brazil
- Argentina
- Rest of South America
- North America
Data Sources, Market Sizing, and Validation
Desk Research
Desk work was used to map the demand pool and the operating context before any calculations were finalized. Public sources, such as the National Institutes of Health funding databases, the US FDA public databases for cleared or authorized tests, and OECD health statistics, helped us understand research intensity and clinical adoption signals that influence sequencing volumes.
We also reviewed sources such as the World Health Organization cancer and genetic disease data, US CDC surveillance publications where relevant to infectious disease sequencing, and peer reviewed genomics and laboratory medicine journals to cross check how quickly new methods are being adopted. Trade association updates, customs and trade statistics, company filings, and investor presentations were used to sanity check capacity additions and pricing direction. Select paid subscriptions that compile company financials and patent activity were used only to support ownership mapping and to spot new platform launches. These examples are illustrative, and many other public and subscription sources were also used for data collection, validation, and clarification.
Primary Interviews and Surveys
Primary conversations and short surveys were used to pressure test assumptions that desk sources cannot settle cleanly, especially on consumables pull through, average run sizes, and pricing changes by geography. We spoke with a mix of suppliers, service labs, clinical users, and research groups across the Americas, EMEA, and APAC, so that adoption patterns in oncology, infectious disease, and rare disease testing were reflected in the final model.
Distribution of primary research fieldwork respondents
| Company type | Respondent position | Region |
|---|---|---|
| Top tier: 29% | CXOs: 19% | APAC: 42% |
| Mid tier: 51% | Functional/Unit leaders: 40% | EMEA: 35% |
| Smaller Players: 20% | Managers: 41% | Americas: 23% |
Market-Sizing & Forecasting
Sizing starts with a top down build where healthcare and life science spending signals are translated into a sequencing demand pool by applying adoption and utilization ratios that came up repeatedly in interviews. Once the model was built, results were corroborated with selective bottom-up approximations, such as sampled instrument placements multiplied by average runs per system, plus a reasonableness check on consumables revenue per active system, which helped adjust totals where penetration appeared overstated.
A few inputs that matter most for DNA sequencing were tracked explicitly, including instrument install base growth, average consumables spend per run, shifts in read length and throughput that influence cost per sample, clinical testing volume growth in oncology and rare diseases, and regional funding intensity for genomics programs. Pricing was handled through an average selling price curve that reflects mix change between instruments and consumables, then gets checked against interview feedback on discounting and service bundling.
For forecasting, we relied on scenario analysis supported by trend smoothing on historic series, because step changes can occur when reimbursement expands, public programs scale up, or a new platform shifts throughput economics. Where bottom-up inputs were missing for smaller countries or niche end uses, gaps were filled using proxy indicators (research funding, population and testing intensity, and regional adoption rates) and then rechecked with primary respondents before the final numbers were locked.
Data Validation & Update Cycle
Outputs are validated through cross checks against independent signals, including installed base trends, public research funding direction, and observed pricing movement in consumables and services. If a region or end user line shows an unusual jump, the assumptions are reviewed, and follow up calls are triggered to confirm whether it is a real demand shift or a modeling artifact.
Before sign off, the model goes through a multi step internal review where calculations, currency handling, and year alignment are checked by another analyst and then rechecked at summary level for consistency with market drivers. Reports are refreshed annually, and interim updates are made when a material event occurs, for example a major regulatory change, a large acquisition, or a sharp change in public funding. Right before delivery, we perform a final pass so clients receive the most current view available.
Mordor Intelligence's Dna Sequencing Market Size Measured Against Other Published Estimates
Published market values for DNA sequencing can look far apart even when the topic name sounds the same, because sources do not always count the same workflow steps or time periods. Differences also come from how each model treats pricing, the pace of clinical adoption, and the timing of currency conversion.
The key gap drivers in this market usually sit around what gets counted as sequencing revenue, how much of data analysis and storage is included, and whether the forecast assumes a steady cost decline or a faster shift to higher throughput platforms. Another common split is the base year choice, since some estimates anchor on 2023 or 2024 while others use later years, which changes the starting point before growth is applied.
Benchmark comparison
| Source | Market Size | Gaps in Research Methodology |
|---|---|---|
| Mordor Intelligence | USD 17.08 B (2026) | |
| Industry Publisher A | USD 12.50 B (2023) | Uses an earlier base year and a 2024 to 2029 window, which can understate the current run rate if adoption accelerated after 2023, and scope often blends instruments and consumables differently across end users. |
| Global Consultancy B | USD 14.88 B (2024) | Anchors sizing on 2024 and extends the forecast to 2033, which can amplify long range growth if clinical volumes and price declines are assumed to move faster than what near term demand indicators support. |
The table shows that the spread is driven first by base year selection and forecast horizon, and then by what parts of the sequencing workflow are monetized in the revenue total. In Mordor Intelligence's model, data analysis and storage are counted only when they are part of the sequencing workflow revenue captured by sequencing providers, which avoids pulling in broader bioinformatics spending that is not directly tied to sequencing runs.
Key Questions Answered in the Report
What is the projected value of the DNA sequencing market by 2031?
The DNA sequencing market is expected to reach USD 40.02 billion by 2031, reflecting sustained double-digit growth.
Which technology segment is expanding fastest?
Nanopore sequencing is forecast to grow at a 27.62% CAGR as its long-read capability gains traction in structural-variant and epigenetic analysis.
How significant are consumables in vendor revenue models?
Consumables represented 57.73% of 2025 revenue, illustrating the importance of proprietary reagents and flowcells in sustaining cash flow.
Why is Asia Pacific viewed as a key growth engine?
Population-scale precision-medicine initiatives and rising healthcare investment are driving a 19.12% CAGR for Asia Pacific through 2031.
What main barriers limit wider sequencing adoption?
High instrument capital costs and a shortage of skilled bioinformatics professionals restrain broader uptake despite falling per-genome prices.
How dominant is Illumina in today’s competitive landscape?
Illumina controls roughly 66.11% of global system installations but faces growing competition from PacBio, Oxford Nanopore, and Element Biosciences.