
Market Overview
| Study Period | 2020 - 2031 |
|---|---|
| Forecast Data Period | 2026 - 2031 |
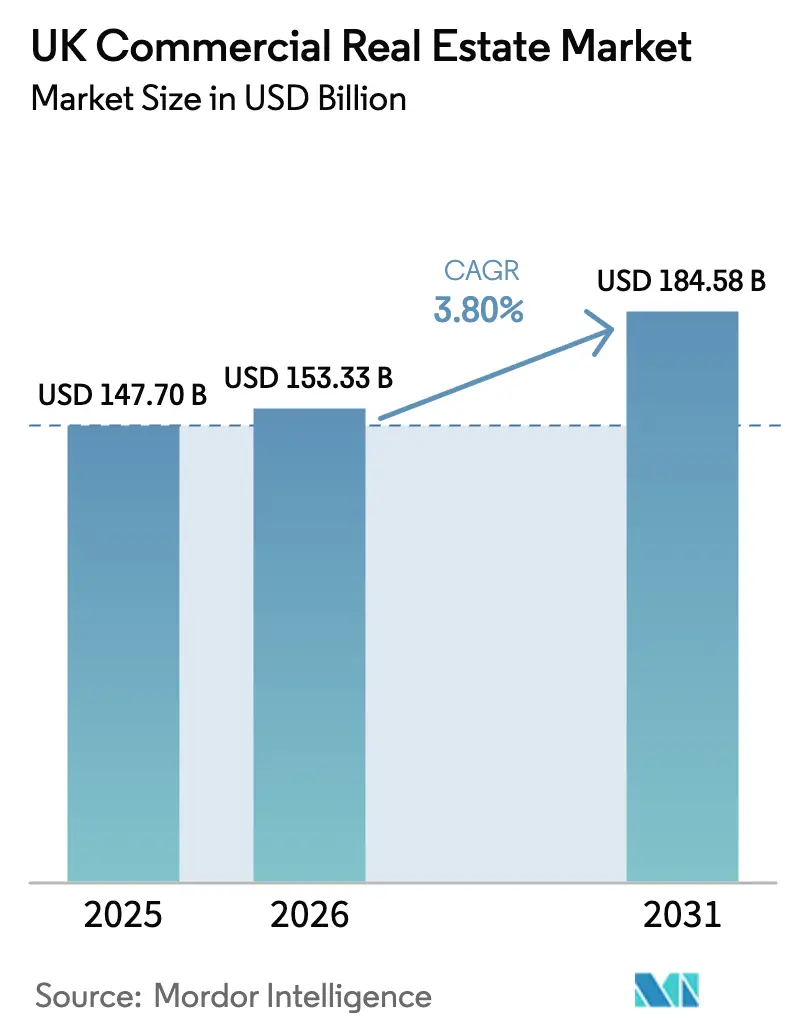
| Base Year Market Size (2025) | USD 147.70 Billion |
| Market Size (2026) | USD 153.33 Billion |
| Market Size (2031) | USD 184.58 Billion |
| Growth Rate (2026 - 2031) | 3.80% CAGR |
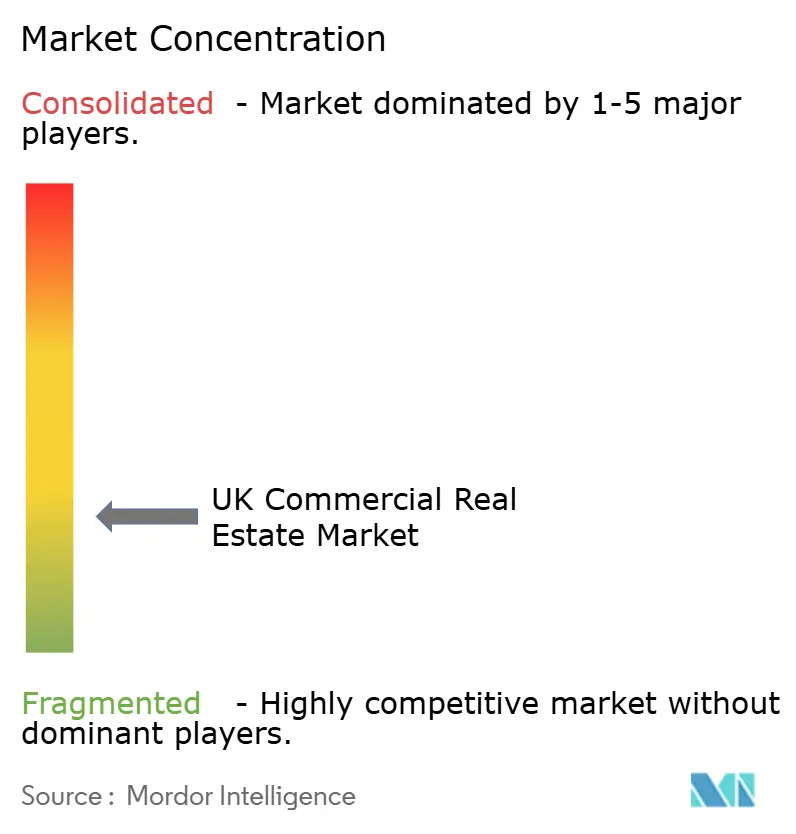
| Market Concentration | Low |
Major Players *Disclaimer: Major Players sorted in no particular order Image © Mordor Intelligence. Reuse requires attribution under CC BY 4.0. | |
UK Commercial Real Estate Market Analysis by Mordor Intelligence
The UK commercial real estate market size stands at USD 153.33 billion in 2026 and is projected to reach USD 184.58 billion by 2031, reflecting a 3.8% CAGR. Investors are pivoting toward data centers, life-sciences campuses, and last‑mile logistics, aiming for more resilient cash flows under supportive policy frameworks. The Office for Budget Responsibility projects commercial property prices to rise 11.1% in 2025, decline 1.9% in 2026, and recover 1.8% in 2027, which signals that the valuation trough after 2022’s rate shock has likely passed. The designation of data centers as Critical National Infrastructure and the creation of AI Growth Zones are reshaping capital deployment and land strategy for large platforms. Freeports and aligned investment zones are channeling fresh foreign direct investment into industrial corridors while accelerating pre‑let activity on strategic sites.[1]https://www.gov.uk/government/organisations/department-for-science-innovation-and-technology
Key Report Takeaways
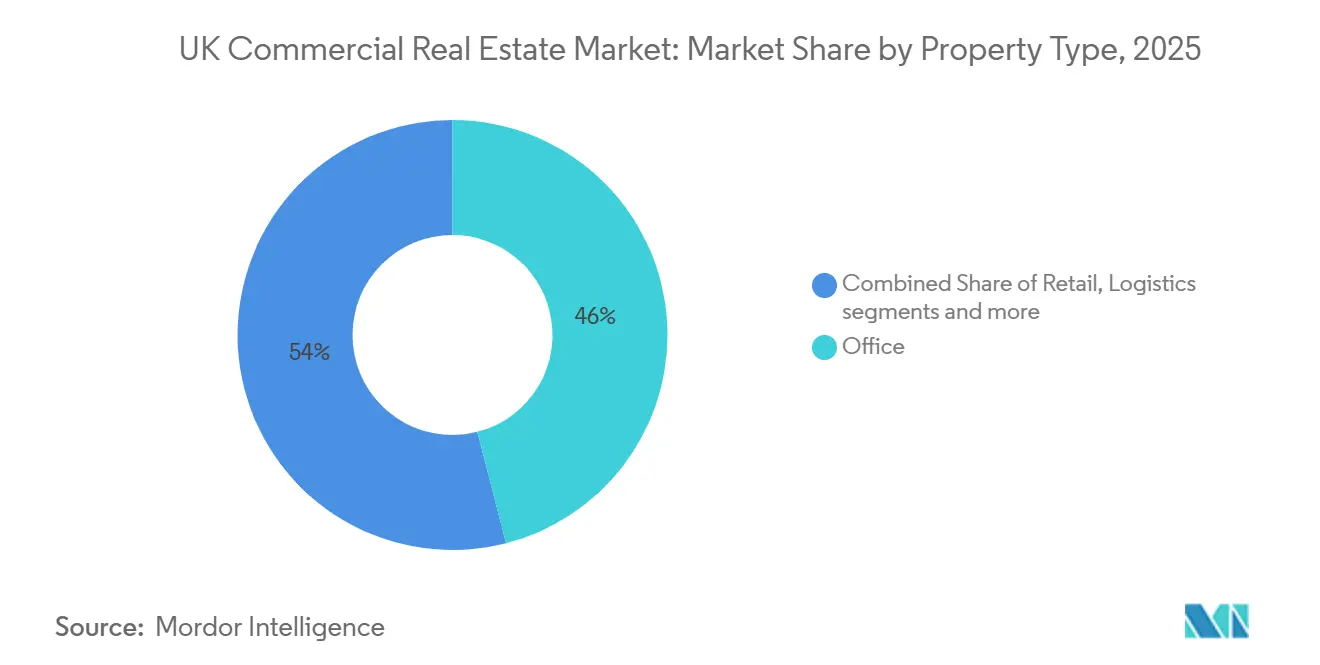
- By property type, offices led with 46% revenue share in 2025, while logistics is forecast to expand at a 4.55% CAGR through 2031.
- By business model, sales accounted for 66% in 2025, while the rental segment is projected to grow at a 4.66% CAGR to 2031.
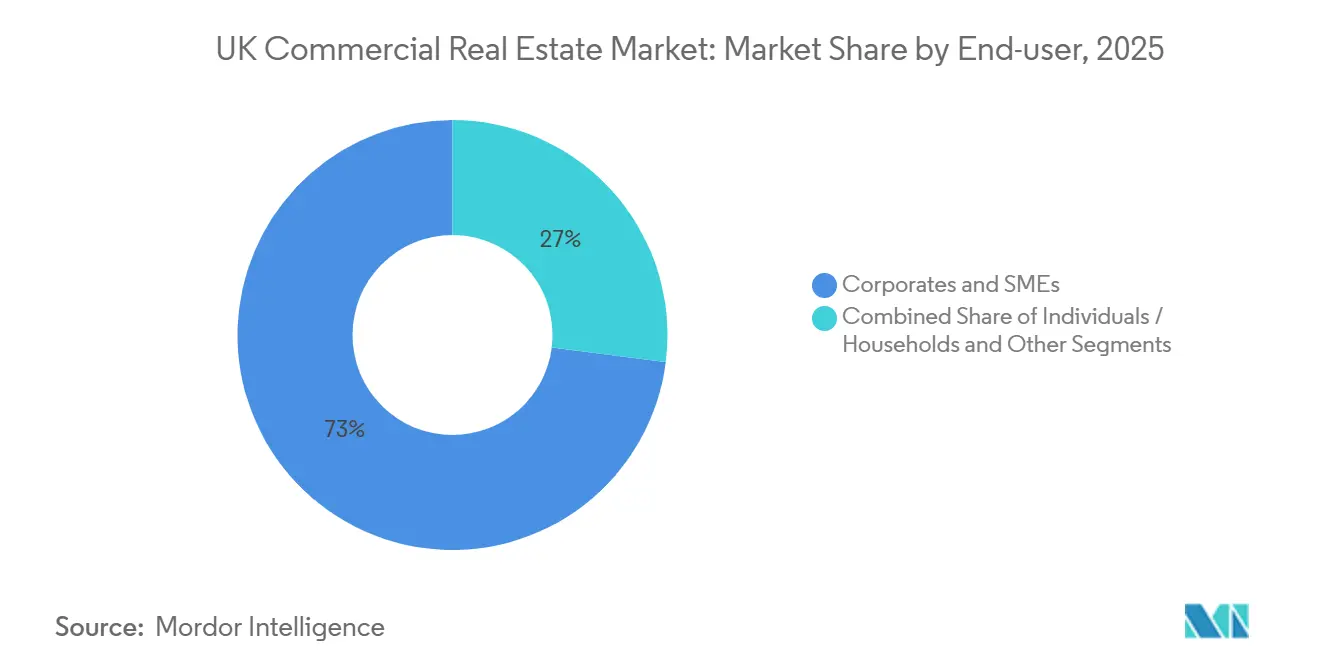
- By end‑user, corporates and SMEs represented 73% in 2025, while the individuals‑and‑households segment is expected to grow at a 4.22% CAGR to 2031.
- By region, England held a 77.33% share in 2025, while Scotland is set to post a 4.66% CAGR to 2031.
Note: Market size and forecast figures in this report are generated using Mordor Intelligence’s proprietary estimation framework, updated with the latest available data and insights as of January 2026.
UK Commercial Real Estate Market Trends and Insights
Drivers Impact Analysis*
| Drivers | (~) % Impact on CAGR Forecast | Geographic Relevance | Impact Timeline |
|---|---|---|---|
| Rapid Growth of Life‑Sciences & Data‑Centre Real Estate Enabled by Government Grants | +1.2% | England (Oxford–Cambridge Arc, Culham AIGZ), South/North Wales, North East England | Long term (≥ 4 years) |
| Accelerating E‑commerce Warehousing Demand Across the UK | +0.9% | England (Southeast, Midlands), Scotland (Central Belt), Wales (M4 Corridor) | Medium term (2–4 years) |
| Freeports & Broad Tax‑Incentive Zones Catalysing Industrial Real Estate Investment | +0.8% | Humber, Thames, Solent, Liverpool City Region, East Midlands Airport, Teesside, Freeport East, Plymouth, Celtic Freeport, Inverness & Cromarty Firth | Medium term (2–4 years) |
| Rising Institutional Investor Appetite for Build-to-Rent Portfolios amid Severe Housing Shortage | +0.7% | London, Manchester, Birmingham, Edinburgh | Medium term (2–4 years) |
| Flight‑to‑Quality Toward Grade‑A, ESG‑Certified Offices Nationwide | +0.6% | London (City, West End), Manchester, Edinburgh, Glasgow | Long term (≥ 4 years) |
| Source: Mordor Intelligence | |||


Rapid Growth of Life‑Sciences & Data‑Centre Real Estate Enabled by Government Grants
The government’s designation of data centers as Critical National Infrastructure and AI Growth Zones targets a tripling of AI‑capable capacity from 2 GW to 6 GW by 2030. Vantage Data Centers committed GBP 12 billion in 2025, equal to USD 15.2 billion in 2025 terms, with job creation planned at scale. SEGRO and Pure Data Centres formed a 50:50 joint venture to deliver a 56 MW West London facility with a gross capital investment of near GBP 1 billion, or USD 1.27 billion in 2025 terms, targeting a 9% to 10% unlevered net yield. The National Energy System Operator signaled 381.5 GW of ready‑to‑build grid capacity, and Ofgem set out a connections reform package to shorten timelines for projects that include data centers. These measures draw capital toward power‑rich brownfield land, where life sciences and data‑center developments now compete for the same sites in the UK commercial real estate market.[2]https://www.savills.co.uk/
Accelerating E‑commerce Warehousing Demand Across the UK
Logistics vacancy rose from 3.3% at the end of 2022 to 7.2% in Q3 2024, while rental growth forecasts moderated to 5.5% in 2024 and 3.7% in 2025. Construction starts have fallen 69% from recent peaks, which is tightening future supply and supporting prime yield resilience. Institutional capital is prioritizing pre‑let and built‑to‑suit schemes for major e‑commerce platforms, which compresses yields on Grade‑A assets. Landlords are retrofitting with on‑site solar and EV charging to meet occupier standards and secure longer terms. These conditions support a durable rental growth path in prime locations as older stock faces faster obsolescence in the UK commercial real estate market.
Freeports & Broad Tax‑Incentive Zones Catalysing Industrial Real Estate Investment
The UK’s ten Freeports have attracted GBP 6.4 billion in private investment, equal to USD 8.13 billion in 2025 terms, with 89% classified as foreign direct investment. Parliament extended the main tax‑relief window from five to ten years, which improves underwriting for new platforms and large pre‑lets. As of June 2025, 72% of Freeport tax‑site projects had secured planning permission, with clean energy leading capital deployment. The GBP 600 million Strategic Sites Accelerator, or USD 762 million in 2025 terms, is unlocking brownfield through remediation grants that de‑risk private co‑investment. These incentives are creating a visible pre‑let pipeline around ports, energy, and advanced manufacturing within the UK commercial real estate market.[3]https://www.local.gov.uk/
Flight‑to‑Quality Toward Grade‑A, ESG‑Certified Offices Nationwide
Minimum Energy Efficiency Standards require all commercial properties to achieve EPC C by April 1, 2027, and EPC B by April 1, 2030, with non‑compliance penalties proposed to increase and grace periods reduced. Many assets sit below Band C, and estimated upgrade costs often range from GBP 15,000 to GBP 80,000 per property, or USD 19,050 to USD 101,600 in 2025 terms, creating a clear advantage for newer or comprehensively refurbished buildings (GBP values shown first, USD values in brackets). Prime London office yields stabilized at 4.00% by the end of June 2025, while weaker secondary assets continued to lag. The share of companies requiring full on‑site presence increased to 48% in 2025, which adds pressure to secure Grade‑A space in core districts. Together, compliance deadlines and workplace policies are concentrating demand in best‑in‑class assets within the UK commercial real estate market.
Restraints Impact Analysis*
| Restraints | (~) % Impact on CAGR Forecast | Geographic Relevance | Impact Timeline |
|---|---|---|---|
| Construction‑Material Inflation & Labour Shortage Post‑Brexit | -0.5% | National, particularly acute in London, Southeast England | Short term (≤ 2 years) |
| Tightening LTV Ratios amid Volatile Gilt Yields | -0.4% | National, with London and the Southeast most sensitive to financing conditions | Short term (≤ 2 years) |
| Persistent Retail Space Rationalisation in Secondary Cities | -0.3% | Secondary cities and towns across England, Wales, and Scotland | Medium term (2–4 years) |
| Source: Mordor Intelligence | |||
Construction‑Material Inflation & Labour Shortage Post‑Brexit
Ready‑mixed concrete sales in Great Britain fell 4.3% from Q1 2025 to Q2 2025, and were down 7.1% year‑on‑year in Q1 2025. The construction‑materials trade deficit widened 1.8% in 2024 to GBP 14,410 million, which equals USD 17,100 million in 2024 terms. The sector is set to require 251,500 additional workers by 2028, or more than 50,000 per year, which underscores the depth of the skills gap. Tender‑price inflation forecasts from Mace point to 3.5% escalation for national real estate in 2025 and 3.0% in 2026, with national infrastructure at 4.0% in both years. Developers are responding with modular methods and design‑for‑manufacture approaches to control on‑site labor exposure in the UK commercial real estate market.
Tightening LTV Ratios amid Volatile Gilt Yields
Thirty‑year gilt yields spiked to 5.75% in early September 2025, which tightened underwriting and widened debt spreads across acquisitions. Commercial real estate transactions totaled GBP 7 billion in Q3 2025, or USD 8.89 billion in 2025 terms, nearly 50% below the ten‑year quarterly average. The OBR expects a 5.2% decline in commercial property transactions in 2025, with a 1.5% improvement in 2026. Bank of England survey indicators show the share of firms citing the cost of finance as a major constraint fell from 46% in January 2024 to 38% in January 2025. As gilt curves flatten toward 2026, the UK commercial real estate market should see narrower bid‑ask spreads and more portfolio rotation.
*Our forecasts treat driver/restraint impacts as directional, not additive. The impact forecasts reflect baseline growth, mix effects, and variable interactions.
Segment Analysis
By Property Type: Logistics Propels Growth While Offices Hold Largest Share
Offices held 46% of the UK commercial real estate market share in 2025, reflecting the depth of London’s core districts and long‑standing institutional ownership. Logistics is set to grow at a 4.55% CAGR during 2026 to 2031 as e‑commerce demand meets a constrained pipeline after a 69% drop in starts from recent highs. Prime yields for top London industrial assets have held below 5% as competition for Grade‑A space persists. Retail remains under pressure in secondary towns while prime city‑center locations in Scotland show near‑zero vacancy, illustrating a split between destination streets and struggling high streets. The UK commercial real estate market is therefore re‑weighting toward high‑quality logistics and mission‑critical alternatives.
Comparing logistics to the overall growth rate shows that this segment contributes a meaningful share of incremental value despite a smaller base, which supports a targeted allocation strategy. The UK commercial real estate market size for logistics is projected to expand in line with the 4.55% CAGR outlook through 2031 as developers commit capital to pre‑let schemes. Office outcomes are bifurcating, with Grade‑A space seeing firmer rents while older stock faces upgrade costs to meet EPC thresholds. UK hotel and hospitality assets recorded steady 2025 progress with value and revenue growth across select portfolios. Data‑center and life‑sciences assets are competing for power‑adjacent sites, reinforcing alternatives as a major leg of growth in the UK commercial real estate market.


By Business Model: Rental Segment Outpaces Sales Amid Institutional Capital Inflows
Sales represented 66% of activity in 2025, consistent with long‑term balance‑sheet ownership preferences in the UK. The rental segment is projected to grow at a 4.66% CAGR from 2026 to 2031, driven by build‑to‑rent adoption and portfolio platforms that monetize inflation‑indexed leases. Logistics landlords reported strong like‑for‑like rental income growth and sizeable uplifts on rent reviews and renewals in the first half of 2025, underscoring pricing power in core locations. The UK commercial real estate market is favoring rental‑backed cash flows in logistics and residential as funding costs normalize.
Sales activity has been constrained by volatile gilt yields, which widened debt costs and reduced transaction volumes in 2025. The OBR expects a modest recovery in transactions during 2026, which should support a gradual pick‑up in sales executions. Impact‑oriented vehicles have committed new funds for UK housing delivery, which may add pipeline for rental platforms over time. The UK commercial real estate market size tied to rental income is set to grow as portfolios scale and securitization options broaden. Portfolio owners continue to favor shorter breaks with higher base rents to balance flexibility and income durability.
By End‑user: Corporates Dominate but Households Segment Gains Momentum
Corporates and SMEs accounted for 73% of end‑user demand in 2025, reflecting their share of office, logistics, and prime retail occupancy. The individuals‑and‑households segment is forecast to grow at a 4.22% CAGR, supported by persistent rental inflation and build‑to‑rent activity in regional cities with yields above 5%. Public‑sector owners are accelerating refurbishment or disposal decisions ahead of EPC deadlines to avoid penalties and upgrade costs. Healthcare‑linked real estate has attracted inbound capital with multi‑decade lease terms and inflation‑linked rents.
Corporate leasing behavior is normalizing with more firms requiring full on‑site presence in 2025, which tightens Grade‑A availability in core submarkets. Households’ rising contribution is a function of supply shortfalls and policy targets that outstrip completion rates, which should sustain demand for institutional rental platforms. Healthcare transactions in 2025 signaled durable income streams backed by long leases and public referrals. The UK commercial real estate industry is tracking toward a mix that blends corporate demand with scaled residential rental exposure across city regions.
Geography Analysis
England is the largest geography with a 77.33% share in 2025, anchored by London’s deep office market and the South East’s logistics corridor. Prime office yields in London stabilized around 4.00% by mid‑2025, aided by tenant flight‑to‑quality and a clearer view on upgrade obligations. Logistics demand remains steady despite a slowdown in speculative starts, and developers are focusing on pre‑lets and power‑capable sites. The UK commercial real estate market continues to prioritize power, transport, and planning certainty around Greater London and the South East.
Scotland is the fastest‑growing region, projected at a 4.66% CAGR for 2026 to 2031, supported by energy transition and Freeport projects that anchor long‑term occupier demand. High‑street prime in Edinburgh shows very low vacancy and stable to firming yields, which supports refurbishment activity and cash‑flow predictability. The Inverness and Cromarty Firth Freeport has secured major manufacturing commitments that will spur adjacent logistics and supplier activity. The UK commercial real estate market in Scotland benefits from more affordable development inputs and targeted policy signals compared with saturated southern corridors.
Wales and Northern Ireland represent smaller shares but are positioned to capture spillover as AI zones and supply chains scale. Wales is preparing to leverage AI Growth Zone benefits, while Northern Ireland features in cross‑border healthcare portfolios bought by inbound investors. Freeports and investment zones across the UK have secured planning for most tax‑site projects, which supports forward funding in industrial corridors. These dynamics point to broader geographic participation in the UK commercial real estate market as policy anchors bed in and power access tightens site selection.
Regulatory Landscape
Energy and carbon regulation shapes asset pricing, capex timing, and development specifications in the UK commercial real estate market. In June 2026, the UK Government issued an interim response on non-domestic private rented sector Minimum Energy Efficiency Standards (MEES), removing the previously proposed 2027 EPC C milestone for existing stock. Under the revised direction, privately rented buildings over 1,000 sq m are set to reach EPC B by 2031 where cost-effective, while units below 1,000 sq m remain subject to the current minimum EPC E floor with existing exemptions, including the 7-year payback test.
This change affects near-term refurbishment sequencing and reduces the immediate compliance cliff for legacy offices and retail assets, while still leaving a defined upgrade pathway for larger, institutionally held assets. For new build, Building Regulations updates tighten performance baselines for non-domestic projects in England. The Building Regulations etc. (Amendment) (England) Regulations 2026 (S.I. 2026/335), laid on 24 March 2026, implement the Future Homes and Buildings Standards (FHBS) via updates to Part L, with amended requirements taking effect from 24 March 2027 for general building work (and from 24 September 2027 for higher-risk building work). Together, the MEES direction for existing rental stock and the FHBS trajectory for new non-domestic buildings support a premium for energy-efficient logistics, data centers, and refurbished Grade-A offices, while increasing the cost of delay for landlords with sub-scale, energy-inefficient portfolios.
Value Chain Analysis
The UK commercial real estate value chain covers land assembly and planning, development and contracting (including specialist MEP packages), building materials manufacturing and distribution, financing (banks, insurers, debt funds, and REIT capital), leasing and agency, and long-term asset and property management. In 2025-2026, execution risk has clustered around procurement and delivery, as developers and contractors manage tender-price volatility, constrained specialist capacity, and lead-time uncertainty for energy-intensive inputs used in logistics upgrades and data-center-ready shells.
Construction supply conditions have been a key bottleneck for project feasibility and delivery models. Industry updates in 2026 pointed to renewed inflation pressure linked to energy-driven volatility in steel, copper, and MEP packages, along with logistics disruptions that lifted freight costs, including rerouting impacts, and domestic fuel surcharges reported by merchants. With construction output down in the three months to January 2026 and brick deliveries in 2025 materially below 2019 levels, contractors have leaned into more selective tendering and tighter contract terms, while developers increasingly favor pre-let, built-to-suit, and refurbishment-led strategies to reduce demand risk and lock in specifications aligned with evolving energy-performance expectations.
Competitive Landscape
The UK commercial real estate market remains fragmented, with no single owner exceeding a low single-digit share, yet consolidation is progressing among listed vehicles and private platforms. The 2025 merger between Picton Property Income and Tritax Big Box reflected a push for scale and diversified balance sheets. Platforms with lower funding costs are competitively positioned to manage MEES upgrades, finance development near power nodes, and secure large pre‑lets.
Strategic moves in 2025 concentrated on data‑center adjacency, logistics rental growth, and select office refurbishments that can hit EPC B ahead of 2030. SEGRO’s 50:50 joint venture with Pure Data Centres to build a 56 MW West London facility with around GBP 1 billion of gross capital, or USD 1.27 billion in 2025 terms, targeted a 9% to 10% unlevered net yield and a hyperscaler pre‑let. Derwent London rebalanced its capital stack with asset disposals and new unsecured debt while sequencing major refurbishments across prime West End addresses. Specialist credit investors increased exposure through floating‑rate senior loans secured by hotel portfolios with double‑digit running yields.
Inbound investors also expanded in 2025. CareTrust REIT acquired Care REIT plc for USD 840.5 million, adding 132 care homes with a 20.2‑year weighted average remaining lease term and USD 68.6 million of annualized rent. Vantage Data Centers announced GBP 12 billion of UK commitments, equal to USD 15.2 billion in 2025 terms, aligned with AI capacity targets. Large advisors and owners are piloting AI tools to streamline planning tasks such as Biodiversity Net Gain assessments, which can reduce cost and compress critical paths.
UK Commercial Real Estate Industry Leaders
Land Securities Group PLC
Segro PLC
British Land Company PLC
Tritax Big Box REIT plc
LondonMetric Property plc
- *Disclaimer: Major Players sorted in no particular order

Market Opportunities and Future Outlook
Refurbishment and repositioning of existing stock is a major near-term whitespace across offices and retail-led assets, as energy-performance rules tighten and occupiers keep concentrating demand in higher-quality space. The June 2026 interim response on non-domestic MEES, including the proposed EPC B by 2031 (where cost-effective) for privately rented buildings over 1,000 sq m, supports a phased, portfolio-level retrofit pipeline rather than a single compliance cliff. That approach creates a clearer delivery window for investors who can aggregate, upgrade, and re-lease assets under more predictable standards. In parallel, Building Regulations changes implementing the Future Homes and Buildings Standards (through Part L amendments effective from March 2027 for general work) raise the bar for new non-domestic development, which pushes specification toward design-for-performance and electrification-ready solutions that can lower operating cost burdens for occupiers.
Capital is also concentrating in operationally resilient segments with benchmarks that can be replicated across adjacent submarkets. In logistics, evidence in H1 2026 showed Grade-A big box take-up of 13 million sq ft, and Colliers reported prime headline rents for distribution warehouses over 100,000 sq ft at GBP 12.40 per sq ft in H1 2026. This supports demand for well-located, specification-led industrial space and for upgrading older sheds with power, EV charging, and solar. In living-led strategies tied to commercial real estate capital allocation, CBRE reported GBP 4.4 billion of living sector investment in H1 2026 (including a GBP 1.8 billion multi-family BTR quarter in Q2 2026), while large portfolio transactions included Morgan Stanley Real Estate Investing and Ridgeback Group acquiring a GBP 1 billion private rented sector portfolio from L&Q, and Greystar acquiring the 904-home Elephant Park portfolio for GBP 500 million. These deal markers provide visible support for scalable platform strategies and mixed-use regeneration that combines prime offices, urban logistics, and institutionally managed rental components where planning and infrastructure constraints favor experienced sponsors.
Recent Industry Developments
- July 2026: SEGRO and Pure Data Centres Group announced a second 50:50 joint venture to develop a 48MW fully fitted data centre in Paris, with anticipated gross capital of around GBP 0.8 billion. The partners extended their data-centre development model beyond the UK, adding a comparable reference point for capital allocation, yield expectations, and power-secured site strategy across European gateway markets.
- January 2025: Broadgate REIT (owned by British Land and GIC) formed a joint venture with Modon Holding to deliver the 2 Finsbury Avenue development in London. The structure spreads development risk and funding requirements for a large City office scheme while aligning the project with occupier flight-to-quality and refurbishment-led delivery strategies.
- March 2024: British Land and Royal London Asset Management announced a joint venture to reposition 1 Triton Square for the science and innovation market. The partnership points to ongoing recycling of prime London assets into life-sciences and innovation use cases, where tenant demand places higher value on specification, compliance-ready building systems, and longer lease structures.


Research Methodology Framework and Report Scope
Market Definition and Coverage
For this study, the United Kingdom commercial real estate market is defined as the annual value linked to owning and leasing income-producing commercial buildings in the country, captured through sale and rental activity across major non-residential property types.
Scope exclusions: Residential-only homes, raw land transactions, and service-only revenues such as brokerage and facilities management are excluded.
Segmentation Overview
- By Property Type
- Offices
- Retail
- Logistics
- Others (industrial real estate, hospitality real estate, etc.)
- By End-user
- Individuals / Households
- Corporates & SMEs
- Others
- By Region
- England
- Wales
- Scotland
- Northern Ireland
Data Sources, Market Sizing, and Validation
Desk Research
Desk research was used to set the boundaries of what counts as commercial property value and to anchor the model to real-world signals that are published regularly. We referenced public and official sources such as the UK Office for National Statistics releases on construction and services activity, Bank of England series on lending and interest rates, HM Land Registry price statistics (where relevant for non-residential indicators), and UK government planning and building pipeline publications.
To make the sizing more realistic, the desk layer was also supported by listed-company annual reports, investor presentations, association websites, and reputable press coverage of transaction volumes and leasing conditions. Where a direct company split was needed, paid subscriptions for company financials, news and financials, and patent databases were used selectively to validate business exposure and keep the assumptions consistent. These desk sources are not exhaustive, and many other references were used for data collection, cross-checks, and clarification during the research process.
Primary Interviews and Surveys
Primary interviews and surveys were run to pressure-test demand and pricing assumptions across offices, retail, industrial and logistics, hospitality, and other specialized assets. We spoke with a mix of owners, operators, developers, lenders, advisors, and large occupiers across the United Kingdom so gaps from desk findings could be closed and the final model could be triangulated using practical deal and leasing experience.
Distribution of primary research fieldwork respondents
| Company type | Respondent position | Region |
|---|---|---|
| Top tier: 35% | CXOs: 18% | |
| Mid tier: 44% | Functional/Unit leaders: 37% | |
| Smaller Players: 21% | Managers: 45% |
Market-Sizing & Forecasting
Market sizing was built by starting with a top-down reconstruction of the UK commercial property value pool using investable stock signals and activity indicators, which are then translated into annual market value using consistent currency timing and pricing logic. We then corroborated the totals through selective bottom-up approximations, such as sampled rent levels by asset type, typical occupancy ranges, and sanity checks based on large-owner and listed-portfolio disclosures, before the final total was locked.
Inputs that were tracked in the model included commercial leasing momentum (net absorption and vacancy direction), rental growth expectations by property type, capitalization rate and yield movement, lending conditions (cost of debt and availability), and the pipeline of delivered and planned space that can add to income-producing stock. Because forecasting can swing a lot when rates and demand change quickly, scenario analysis was used around interest rate paths and sector recovery speed, and the final forecast path was selected only after it aligned with what interviewees described as the most likely case. Where bottom-up detail was missing for smaller niches, the gaps were handled using share-of-stock proxies that were tied back to observed activity and then reviewed again with primary respondents.
Data Validation & Update Cycle
Validation was done through multiple checks so the final values did not rely on a single indicator. Analysts compared the model output against independent signals like transaction activity direction, yield trends, credit conditions, and delivered supply, and then reviewed large variances by sector to confirm that the drivers were consistent.
Before sign-off, the numbers go through step-by-step analyst review, and follow-up outreach is triggered if a key input shifts outside an expected range or if primary feedback contradicts the desk pattern. Reports are refreshed annually, with interim updates when material events occur, and a final pre-delivery pass is completed so clients receive the most recent view available.
Mordor Intelligence's United Kingdom Commercial Real Estate Market Size Compared Against Other Published Estimates
Published market sizes for UK commercial real estate often come out different because the underlying definition is not the same, even when the title looks identical. Differences are usually driven by what is counted as market value, how sale versus rental activity is treated, and whether adjacent services are included in the total.
Transaction and leasing activity checks, along with yield and financing-condition signals, are the guardrails that keep Mordor Intelligence's 2025 estimate tied to income-producing built assets only, which avoids inflating totals by mixing in residential stock, land-only trades, or service revenues. The largest gaps we see in other figures typically come from broader inclusion of leisure and other end uses without a clear boundary to income-producing stock, plus different currency conversion timing and more aggressive pricing progression assumptions across the forecast window.
Benchmark comparison
| Source | Market Size | Gaps in Research Methodology |
|---|---|---|
| Mordor Intelligence | USD 147.70 B (2025) | |
| Industry Publisher A | USD 269.20 B (2025) | Uses a broader end-use framing that can pull in additional commercial activity categories (for example, leisure and other uses) without consistently filtering to income-producing built stock, which can raise the counted value base. |
| Industry Publisher B | USD 151.76 B (2025) | Scope boundaries are less explicit on exclusions, and the sizing narrative leans on growth drivers without clearly showing how stock, yields, and activity indicators are converted into a repeatable annual value total. |
The spread across the three numbers is mainly explained by scope and conversion choices rather than a simple disagreement on direction. When the counted universe is kept to income-producing assets and the model is tied back to observable activity, pricing, and financing signals, the result stays easier to trace and to re-run during annual refreshes.


Key Questions Answered in the Report
What is the current size and 2031 outlook for the UK commercial real estate market?
The UK commercial real estate market size is USD 153.33 billion in 2026 and is projected to reach USD 184.58 billion by 2031 at a 3.8% CAGR.
Which property type is growing fastest in the UK commercial real estate market?
Logistics is forecast to expand at a 4.55% CAGR from 2026 to 2031 as e-commerce demand meets a constrained pipeline and pre-let development models strengthen.
How do policy initiatives affect the UK commercial real estate market in 2026?
Data centre designations, AI Growth Zones, and Freeports are unlocking investment, speeding grid connections, and supporting pre-lets across industrial and alternative segments.
Which region leads and which is growing fastest in the UK commercial real estate market?
England leads with a 77.33% share in 2025, while Scotland is projected to grow fastest at a 4.66% CAGR through 2031 based on energy transition and Freeport activity.
How are financing conditions influencing transactions in the UK commercial real estate market?
Thirty-year gilt volatility pushed up debt costs, which reduced 2025 volumes, but forecasts indicate a modest recovery in 2026 as yield curves stabilize.
What types of assets are attracting the most capital in the UK commercial real estate market?
Data centers, life sciences campuses, last-mile logistics, and high-quality Grade-A offices are drawing the most capital due to policy support and resilient occupier demand.
Page last updated on:




