
Market Overview
| Study Period | 2020 - 2031 |
|---|---|
| Market Size (2026) | USD 254.36 Billion |
| Market Size (2031) | USD 366.91 Billion |
| Growth Rate (2026 - 2031) | 7.62 % |
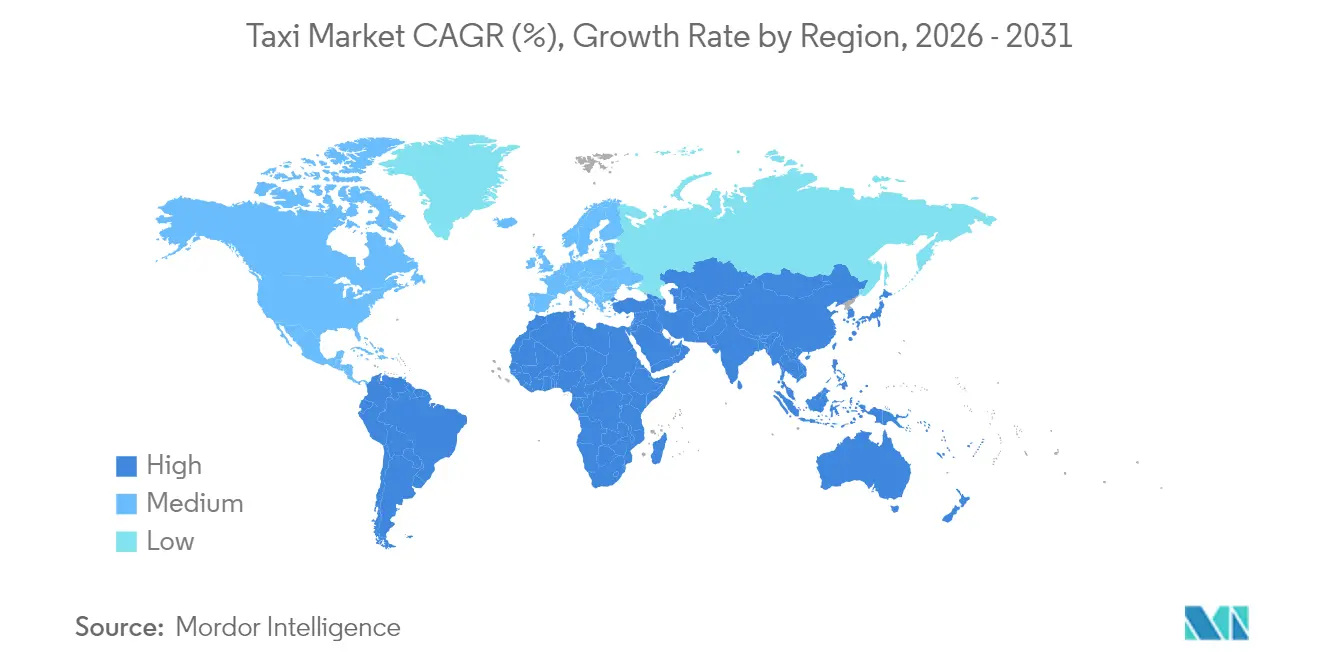
| Fastest Growing Market | Middle East and Africa |
| Largest Market | Asia Pacific |
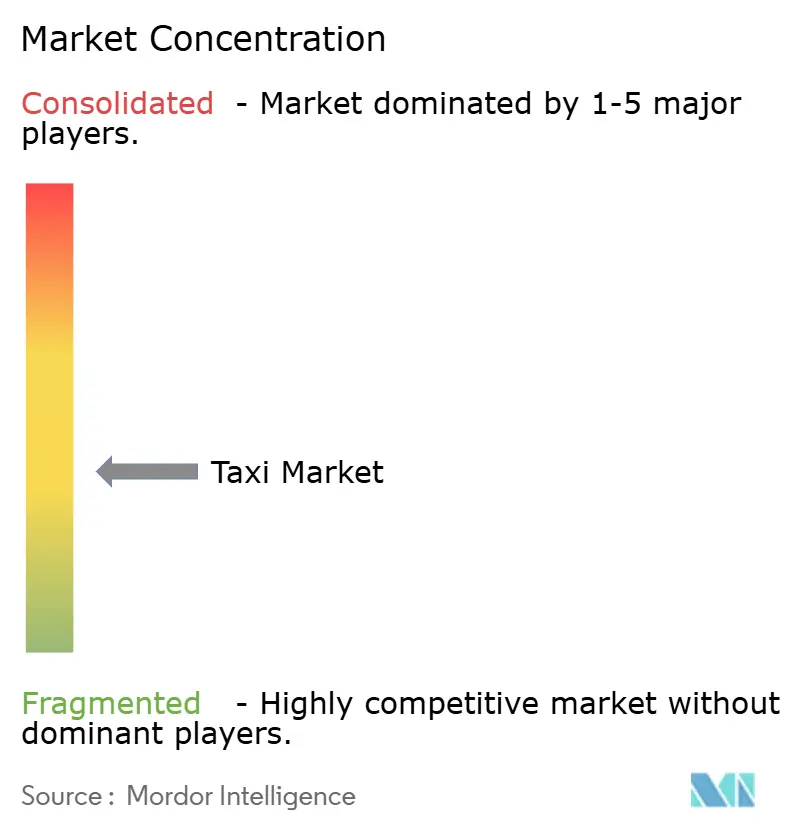
| Market Concentration | Medium |
Major Players *Disclaimer: Major Players sorted in no particular order Image © Mordor Intelligence. Reuse requires attribution under CC BY 4.0. | |
Taxi Market Analysis by Mordor Intelligence
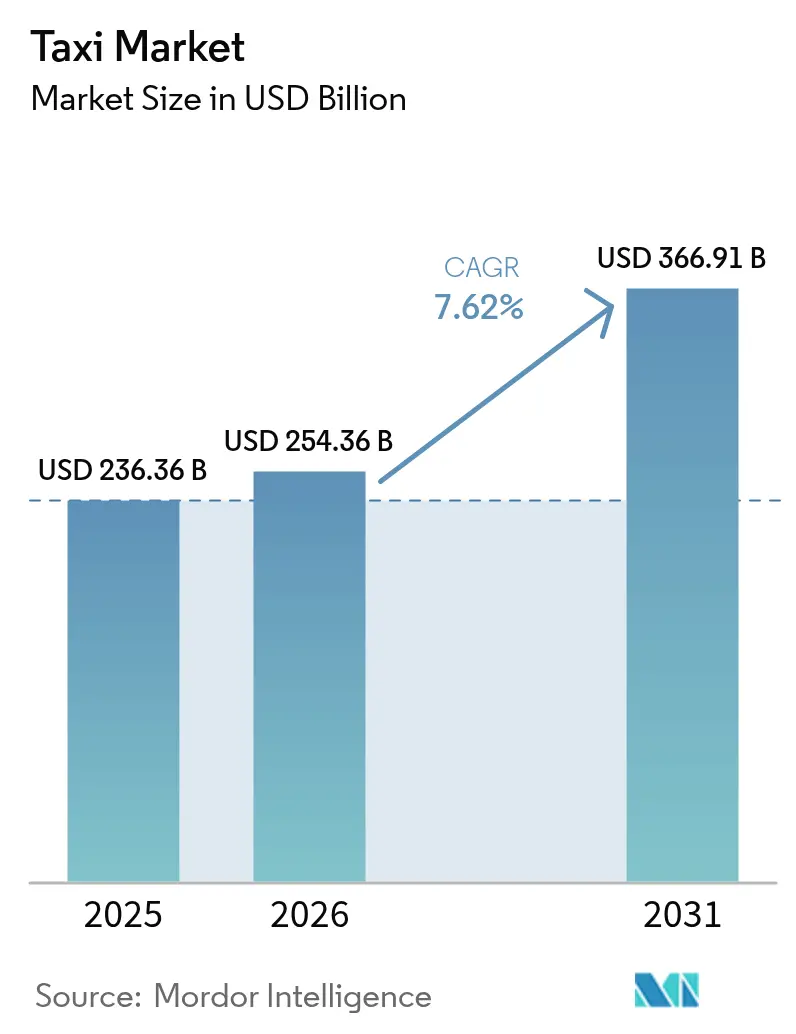
The Taxi Market size was valued at USD 236.36 billion in 2025 and estimated to grow from USD 254.36 billion in 2026 to reach USD 366.91 billion by 2031, at a CAGR of 7.62% during the forecast period (2026-2031). Underscoring a sizeable taxi market size that continues to expand on the back of digital integration, AI-driven dispatch systems, and growing urban populations. Demand accelerates as super-apps embed on-demand mobility alongside food, payments, and finance, enabling single-tap bookings that raise platform stickiness and average revenue per user. Operators are widening service portfolios with electric, autonomous, and accessibility-focused fleets that lower lifetime operating costs and open new revenue layers such as in-vehicle advertising. Governments increasingly view app-based taxis as complements to public transit and are issuing incentives for EV adoption, improved accessibility, and data sharing that favor agile players with strong regulatory teams. Taken together, these forces are reshaping driver economics, pushing industry participants to invest in algorithmic pricing, dynamic routing, and vertical integration that compress time-to-pickup and improve fleet utilization.
Key Report Takeaways
- By booking type, online channels captured 63.78% of taxi market share in 2025 and are forecast to grow at an 7.92% CAGR through 2031.
- By service type, ride-hailing secured 74.85% share of the taxi market size in 2025; pooled ride-sharing is advancing at an 7.78% CAGR through 2031.
- By vehicle type, passenger cars held 60.58% of taxi market share in 2025, whereas two-wheeler formats are forecast to grow at an 7.71% CAGR over the same period.
- By propulsion, internal-combustion vehicles commanded 71.35% of the taxi market size in 2025; electric taxis are projected to scale at an 8.05% CAGR through 2031.
- By geography, Asia-Pacific led with 37.42% taxi market share in 2025; the Middle East and Africa is positioned to record an 7.88% CAGR to 2031.
Note: Market size and forecast figures in this report are generated using Mordor Intelligence’s proprietary estimation framework, updated with the latest available data and insights as of 2026.
Market Trends and Insights
Drivers Impact Analysis of Taxi Market*
| Driver | (~) % Impact on CAGR Forecast | Geographic Relevance | Impact Timeline |
|---|---|---|---|
| Rapid Smartphone and Internet Penetration | +1.8% | Global, with highest impact in Asia Pacific and Middle East and Africa | Medium term (2-4 years) |
| Urban Congestion and Declining Private-Car Ownership | +1.5% | Global, concentrated in major metropolitan areas | Long term (≥ 4 years) |
| Ride-Hailing Platform Expansion | +1.2% | Asia Pacific, Middle East and Africa, South America | Medium term (2-4 years) |
| AI-Based Dynamic Routing | +0.9% | Global, led by North America and Europe | Short term (≤ 2 years) |
| Accessibility Mandates Driving Fleet Renewal | +0.7% | North America, Europe | Medium term (2-4 years) |
| Super-App API Integrations | +0.6% | Asia Pacific core, spill-over to global markets | Short term (≤ 2 years) |
| Source: Mordor Intelligence | |||
Rapid Smartphone & Internet Penetration
Smartphone penetration above four-fifths in leading urban centers lets platforms algorithmically match riders and drivers faster, shrinking average wait times from 15-20 minutes to under 5 minutes in top-tier cities[1]. Ubiquitous 5G coverage allows richer location data, which boosts fleet utilisation and lowers deadhead mileage. Higher data speeds also mean in-app video ads and real-time driver coaching, unlocking diversified revenue streams. Mobile wallets embedded in ride-hailing apps now account for more than four-fifths of transactions in developed markets, lowering cash-handling risk and reducing airport queue times. In emerging economies, internet upgrades bypass legacy dispatch systems, enabling leap-frog adoption of digital bookings.
Urban Congestion & Declining Private-Car Ownership
Vehicle utilisation in dense cities often falls slightly, motivating residents to replace private cars with on-demand rides that eliminate parking fees. Municipal congestion charges plus rising fuel prices raise the total cost of car ownership, reinforcing the appeal of taxi services, especially pooled formats that can cut per-trip fares by up to 40%. Younger consumers aged 25-35 are most receptive, preferring bundled mobility-as-a-service subscriptions integrating taxis with rail, bus, and micro-mobility in one app. Congestion costs topping USD 100 billion annually in the U.S. place political pressure on cities to privilege high-occupancy modes, indirectly boosting taxi market demand.
Ride-Hailing Platform Expansion In Emerging Economies
Localized playbooks such as cash payments, smaller vehicles, and tailored insurance let platforms penetrate frontier markets rapidly. Grab’s integration of legacy taxis raised gross bookings by more than four-fifths in certain Southeast Asian metros. In the MENA region, ride-sharing revenue is p rojected to scale exponentially by 2028 due to youthful demographics and supportive digital policies. Three-wheeler and motorcycle taxis resonate in congested cities because they lower trip costs and shorten travel times, accelerating ride-hailing adoption curves beyond those in developed markets.
AI-Based Dynamic Routing & Pricing Optimisation
Machine-learning systems now factor in weather, events, mass-transit outages, and micro-zone demand to rebalance vehicles proactively, lifting completed trips per driver by up to quarter[2]. Uber’s i-Rebalance trials raised driver income nearly 10% and improved acceptance rates by almost two-fifth. Dynamic pricing models calibrate fares in real time, maximizing revenue per mile while keeping wait times competitive with public transit. Predictive analytics also support demand forecasting for scheduled events, prompting pre-positioning of vehicles that cuts surge spikes and enhances brand loyalty among price-sensitive users.
Restraints Impact Analysis of Taxi Market*
| Restraint | (~) % Impact on CAGR Forecast | Geographic Relevance | Impact Timeline |
|---|---|---|---|
| Evolving Licensing and Regulatory Crack-Downs | -1.1% | Global, with highest impact in Europe and North America | Medium term (2-4 years) |
| Intensifying Price Wars Eroding Driver Earnings | -0.8% | Global, concentrated in mature markets | Short term (≤ 2 years) |
| Limited Public EV-Charging Slowing E-Taxi Uptake | -0.6% | Global, most severe in developing markets | Long term (≥ 4 years) |
| Data-Privacy Litigation Around Trip-Tracking | -0.4% | Europe, North America, expanding to Asia Pacific | Medium term (2-4 years) |
| Source: Mordor Intelligence | |||
Evolving Licensing & Regulatory Crack-Downs
City regulators are modernising medallion structures and tightening background-check rules, raising compliance costs for app-based and traditional operators. Seattle plans to phase out its medallion regime by March 2026, while New York City requires half of all cabs to be wheelchair-ready by March 2025. The Singaporean watchdog blocked Grab’s planned acquisition of Trans-Cab over antitrust concerns, signalling closer scrutiny of platform consolidation. Divergent regional standards increase legal complexity and can delay market entries, suppressing near-term growth momentum.
Intensifying Price Wars Eroding Driver Earnings
Fierce fare promotions in saturated cities drive down driver net income, raising churn to around two-fifths at some platforms. Subsidised pricing models pressure insurers like American Transit Insurance Company, whose USD 700 million in net losses threaten coverage availability for thousands of medallion holders. Continued investor subsidies mask structural profitability challenges, and any pullback in funding could trigger abrupt fare increases that dent demand elasticity.
*Our forecasts treat driver/restraint impacts as directional, not additive. The impact forecasts reflect baseline growth, mix effects, and variable interactions.
Taxi Market Segment Analysis
By Booking Type:
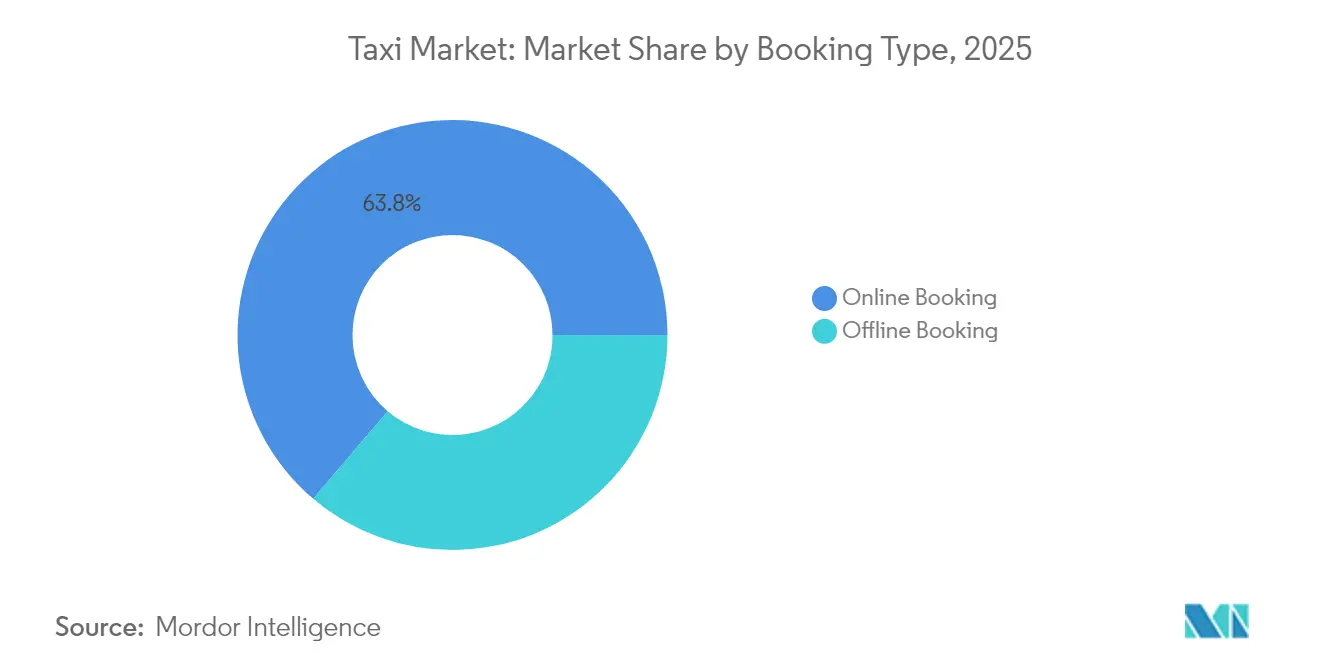
Digital Adoption Outpaces Legacy DispatchOnline channels delivered 63.78% of the taxi market share in 2025, illustrating the structural pivot toward app-based demand aggregation. The dominance of digital bookings strengthened business intelligence loops that sharpen demand prediction, resulting in higher asset utilisation and lower passenger wait times. The offline segment remains relevant among older demographics and jurisdictions where medallion systems still confer street-hail privilege, yet its growth trajectory lags the broader taxi market. Operators are therefore integrating voice-based IVR and kiosk interfaces alongside apps to preserve legacy users while nudging them toward digital interactions.
Looking forward, online bookings are forecast to grow at an 7.92% CAGR. Super-apps bundling mobility with payments and e-commerce will underpin incremental trip volumes, especially in APAC megacities where smartphone penetration exceeds four-fifths. Online channels also furnish granular trip-level data that powers targeted loyalty and dynamic pricing, reinforcing share gains. Contractual corporate accounts, airport concessions, and mandated accessibility services sustain the offline channel’s CAGR. Yet, its revenue mix is expected to shrink below one-third of the taxi market size by 2031.

By Service Type:
Pooled Formats Lift OccupancyRide-hailing controlled 74.85% of taxi market size in 2025, owing to network effects that ensure quicker matches and transparent pricing. Market-leading platforms invest heavily in safety verification, real-time monitoring, and driver training that elevate service reliability above informal rivals. Pooled rides are projected to outpace overall taxi market expansion with an 7.78% CAGR because they ease congestion and lower per-seat fares by sharing costs among passengers. Environmental compliance agendas further catalyse pooled demand as corporates set fleet-wide carbon reduction targets.
Corporate mobility contracts, once dominated by black-car fleets, are increasingly awarded to app-based providers offering digital receipts and per-seat expense allocation. The embedded data facilitates carbon-reporting dashboards now demanded by ESG-focused boards. Although ride-hailing maintains gross-booking supremacy, pooled formats generate higher occupancy and superior asset productivity, especially during peak hours when single-occupancy trips face surge pricing.
By Vehicle Type:
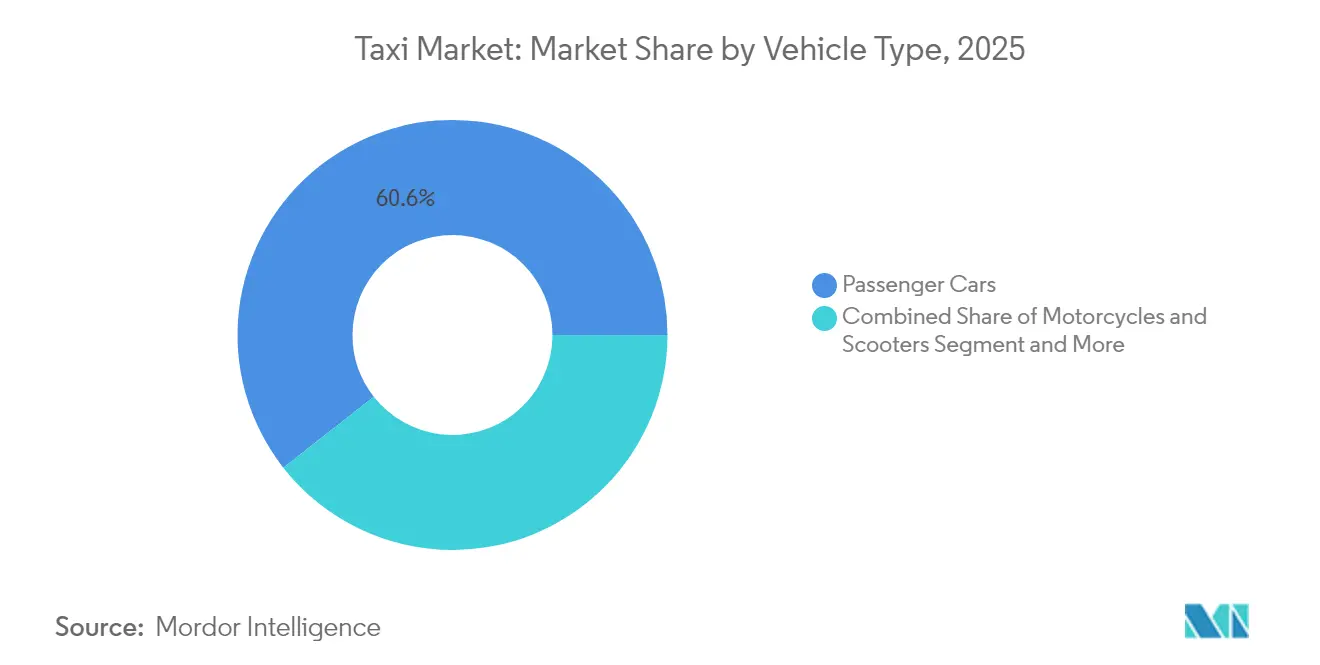
Two-Wheeler Momentum BuildsPassenger cars accounted for 60.58% of the taxi market share in 2025, yet motorcycles and scooters are growing at an 7.71% CAGR due to agility in traffic-choked corridors and lower acquisition costs. In Jakarta, two-wheelers slash peak-hour travel times by up to 50% relative to four-wheelers. Operators onboard couriers during off-peak hours, smoothing driver earnings and adding ancillary delivery revenue. Vans and MPVs remain niche, serving group travel and contract school runs where per-capita cost parity with mass transit is advantageous.
The electrification wave is most pronounced in the three-wheeler subset. India sold 1.73 million EV three-wheelers over the past decade under a subsidy-backed push to reduce urban pollution. With operating costs nearly two-fifths lower than diesel, electric three-wheelers strengthen driver profitability despite higher capex. Passenger cars will retain comfort-oriented use cases such as airport transfers, yet incremental volume growth will favor nimble two-wheeler fleets that can navigate gridlocked megacities efficiently.
By Propulsion Type:
Electric Gains but ICE PersistsInternal-combustion vehicles still dominated 71.35% of the taxi market in 2025, but electric alternatives are growing fastest at an 8.05% CAGR, fostered by fuel savings and tightening emissions standards. China’s mandate that all new city taxis registered after 2025 must be electric is expected to shift more than a lakh units annually to zero-emission powertrains. Hybrid models serve as interim solutions in regions where charging remains uneven. Battery-swapping services led by Gogoro and Sun Mobility bypass charger scarcity, cutting downtime to under three minutes and appealing to high-utilisation fleets.
Fleet electrification supports upselling in-vehicle digital services such as immersive infotainment and targeted advertising leveraged by consistent 4G/5G connectivity. As the total cost of ownership parity with ICE cars arrives around 2027 for high-kilometre taxis, operators will allocate growing capex to EV fleets even in developing markets. However, limited grid capacity and fragmented charger standards may prolong ICE relevance in rural catchments, ensuring propulsion diversity over the forecast horizon.
Geography Analysis
APAC Taxi Market
Asia-Pacific contributed 37.42% taxi market share in 2025, sustained by rapid urbanisation, smartphone usage above four-fifth, and widespread two-wheeler taxis that thrive in dense corridors. Government policies offering EV subsidies and medallion exemptions accelerate fleet turnover throughout India, Vietnam, and Thailand. Japan’s taxi incumbents partner with Uber to integrate 20,000 vehicles on the platform, reinforcing cross-border digital standardisation.
EMEA Taxi Market
The Middle East and Africa is projected to register an 7.88% CAGR through 2031, due to national digital-economy programmes and mega-city infrastructure. Dubai Taxi Company aims to migrate around four-fifth of rides to e-booking by 2029 while electrifying one-quarter of its fleet, aligning with the UAE Net-Zero 2050 roadmap. Ride-hailing apps proliferate in Egypt, Saudi Arabia, and Nigeria where youthful, tech-savvy populations leapfrog legacy dispatch models. Pan-regional super-apps such as Careem integrate payments, delivery, and transport under one umbrella, enhancing user retention. Authorities impose stricter accessibility and data-privacy mandates, requiring material compliance outlays that favor scaled operators. Lyft’s acquisition of FREENOW in April 2025 doubled its European reach to 11 countries and opened access to nearly 300 billion annual personal vehicle trips. Meanwhile, city councils across Germany are testing zero-emission zones that could bump EV adoption thresholds earlier than corporate plans anticipate. Net effect: growth slows but remains positive as platforms diversify into deliveries and subscription mobility passes.
Regulatory Landscape
Taxi and ride-hailing regulation is shifting from fragmented city-by-city rules toward tighter minimum standards centered on safety, licensing, and enforcement. In England, the English Devolution and Community Empowerment Act 2026 (Chapter 6) grants the Secretary of State powers to prescribe national standards for taxi and private hire vehicle licences, and a UK Parliament committee report published in June 2026 reinforced the direction of travel after the national-minimum-standards announcement in November 2025. Transport for London also updated taxi conditions of fitness in 2025, retaining requirements tied to vehicle type approval and emissions capability for new taxis, which continues to set operational and fleet-compliance thresholds in a major hub.
Outside Europe, regulators are codifying app-based mobility controls through permit frameworks, ongoing driver screening, and training mandates. Massachusetts Department of Public Utilities opened a rulemaking in April 2026 aimed at rideshare safety, including continuous background-check monitoring and defined disqualification standards for TNC drivers. Hong Kong gazetted subsidiary legislation in May 2026 detailing ride-hailing operations, including a cap of 10,000 vehicle permits and combined driving tests for taxi and ride-hailing drivers. Maryland enacted House Bill 829 in 2026 requiring human trafficking awareness training for transportation network operator license applicants and renewals, which increases standardized compliance obligations across platforms and fleets.
Value Chain Analysis
The taxi value chain connects vehicle and energy inputs (OEMs, leasing and finance, fuel or charging providers), driver onboarding and compliance (licensing, background checks, training, insurance), and demand aggregation through dispatch and marketplaces (street-hail and radio dispatch, airport and corporate accounts, and app-based ride-hailing platforms). Payments and identity layers (wallets, card networks, fraud tools) and data systems (routing, pricing, telematics, safety monitoring) support utilization, while aftersales service networks (maintenance, tires, and parts) shape fleet uptime and total cost of ownership, especially for high-mileage vehicles.
Key bottlenecks emerge in regulation-heavy onboarding and in vehicle servicing and logistics. Moves to standardize and tighten rules can shift downstream requirements for operators and intermediaries: the UK signaled a Draft Taxi and Private Hire Vehicle Bill in the King’s Speech in May 2026 to standardize licensing and enforcement across England, and Finland submitted amendments in June 2026 to tighten licensing, improve driver training, and enhance supervision with enforcement beginning September 1, 2026. On the supply side, parts and service constraints can extend repair cycles and push operators toward newer vehicles; broader automotive logistics disruption also affects fleet renewals. C.H. Robinson highlighted ongoing cross-border driver authorization issues in North America, including about 20,000 driver visas revoked between April 2025 and April 2026, which can affect procurement and maintenance lead times and costs.
Competitive Landscape
The taxi market shows moderate fragmentation with regional heavyweights buttressed by deep capital and data advantages. Uber commands more than three-fifth U.S. share, but faces localized challengers like Didi in China and Grab in Southeast Asia that tailor services to domestic user behaviors. Industry focus is shifting toward autonomous vehicle integration, with Uber investing USD 300 million in partnership with Lucid and Nuro to field 20,000 premium robotaxis from 2026, targeting business travellers willing to pay a surcharge for luxury self-driving rides.
Players accelerate vertical integration to capture value beyond core ride fees. Grab’s super-app bundles BNPL finance, grocery delivery, and travel-booking, driving multi-product cross-sell that lifts customer lifetime value. Traditional taxi cooperatives deploy white-label booking apps via SaaS vendors to stay relevant while lobbying for preferential street-hail rights. Data analytics and AI become bigger differentiators as seat-belt monitoring, fatigue detection, and personalised promo codes deliver safety improvements and incremental bookings.
White-space opportunities include specialised services for wheelchair users, schoolchildren, and corporate commuters requiring consistent service-level agreements. Electric vehicle makers such as BYD and Tesla are exploring direct fleet ventures, threatening to disintermediate platform middlemen where regulatory conditions permit. Start-ups offering battery-swap hubs and real-time fleet health analytics position themselves as enabling layers across the value chain, further intensifying competition for driver attention and customer loyalty.
Taxi Industry Leaders
-
Uber Technologies Inc.
-
Lyft Inc.
-
Didi Chuxing
-
GrabTaxi Holdings Pte Ltd
-
ANI Technologies Pvt. Ltd (Ola)
- *Disclaimer: Major Players sorted in no particular order
Taxi Market Companies Covered in this Report
- Uber Technologies Inc.
- Beijing Xiaoju Technology Co. Ltd (DiDi)
- Lyft Inc.
- Grab Holdings Inc.
- Bolt Technology OU
- ANI Technologies Pvt Ltd (Ola)
- Gojek Tech
- FREE NOW (Intelligent Apps GmbH)
- BlaBlaCar
- Curb Mobility LLC
- Flywheel Software Inc.
- Kabbee Exchange Ltd
- Addison Lee Group
- Gett Inc.
- Yandex Go (Yandex NV)
- Careem Networks FZ-LLC
- Via Transportation Inc.
- Beat Mobility Services Ltd
- Easy Taxi (Tappsi SAS)
- Cabify España SL
Market Opportunities and Future Outlook
Autonomous taxi commercialization is creating whitespace around permitted operations, fleet depots, charging, and dispatch integration with incumbent platforms. Dubai is a concrete testbed, with Baidu’s Apollo Go commencing fully driverless commercial ride-hailing in April 2026 through a partnership with Dubai Taxi Company after permit acquisition, followed by a July 2026 public-facing autonomous taxi offering in select neighborhoods via Uber and Apollo Go. These deployments increase the pull for local operating partners, safety and compliance processes, and purpose-built fleet support capabilities that can be replicated in other cities once permitting pathways become clearer.
Regulatory redesign is also increasing opportunity for scaled operators and specialist enablers that can meet tighter safety, screening, and labor-compliance requirements. In April 2026, Massachusetts DPU initiated rulemaking to mandate continuous background-check monitoring for TNC drivers, which raises the value of integrated onboarding, identity, and monitoring workflows. Hong Kong’s May 2026 ride-hailing framework introduces a 10,000 permit cap, which increases the premium on high-utilization operations and differentiated fleet types (including accessible and EV fleets) under constrained supply. Kenya’s Ministry of Roads and Transport released draft digital taxi policy and related regulations in 2026, including minimum compensation proposals and public participation windows, pointing to how platforms, insurers, and fleet managers can package compliant driver economics, transparent trip accounting, and auditable data-sharing with regulators.
Recent Industry Developments in Taxi Market
- June 2026: Uber announced Houston as the second market for its autonomous robotaxi program, targeting a mid-2027 launch using Lucid Gravity vehicles equipped with Nuro Driver technology. The plan includes dedicated operational infrastructure to support charging, maintenance, and fleet management, signaling a more asset-backed approach to autonomy at city scale.
- July 2025: Uber, Lucid, and Nuro announced a next-generation autonomous robotaxi program targeting deployment of at least 35,000 vehicles globally over six years. The partnership formalized a multi-party stack combining vehicle platform and autonomy system integration, with Uber as the marketplace, tightening differentiation around robotaxi supply.
- July 2025: Lyft completed its acquisition of FREENOW, expanding operations into 11 countries and nearly 1,000 cities. The deal broadened Lyft’s multi-mobility footprint and strengthened its position with local taxi supply and regulated market access across Europe.
Taxi Market Report Scope and Research Methodology
Market Definition and Coverage
This market covers paid passenger trips where a driver and vehicle are hired for point to point travel, booked either offline or through an app. It includes ride hailing and pooled ride sharing where passengers can choose private or shared rides.
Scope exclusions: The sizing does not include public transit fares, self drive car rentals, or pure carpooling where no professional driver service is provided.
Segments Covered in This Report
- By Booking Type
- Online Booking
- Offline Booking
- By Service Type
- Ride-hailing
- Ride-sharing (pooled)
- Corporate & Institutional Contracts
- By Vehicle Type
- Passenger Cars
- Motorcycles & Scooters
- Vans & MPVs
- Auto-Rickshaws & Tuk-tuks
- By Propulsion Type
- Internal Combustion Engine (ICE)
- Electric
- Hybrid
- By Geography
- North America
- United States
- Canada
- Rest of North America
- South America
- Brazil
- Argentina
- Rest of South America
- Europe
- Germany
- United Kingdom
- France
- Spain
- Russia
- Rest of Europe
- Asia-Pacific
- China
- India
- Japan
- South Korea
- Australia
- Vietnam
- Rest of Asia-Pacific
- Middle East and Africa
- GCC
- Turkey
- South Africa
- Rest of Middle East and Africa
- North America
Data Sources, Market Sizing, and Validation
Desk Research
Desk research was used to set the demand pool, map service formats, and build starting points for trip volumes and pricing logic. We referred to public sources such as national transport departments and city mobility portals, statistics offices, regulator circulars on taxi permits and fare cards, and road safety agencies that publish vehicle registrations and utilization indicators. Where available, urban travel surveys and peer reviewed transport studies were used to cross check trip purpose split and occupancy patterns.
On the supply side, company filings, investor presentations, and reputed press were reviewed to understand fleet mix and the shift toward online bookings. A paid subscription for company financials and news helped standardize reported revenues and avoid double counting across subsidiaries, and a patent database was used as a light signal for dispatch and routing technology intensity. The sources listed here are illustrative, and other public references were also used for data collection, validation, and clarification.
Primary Interviews and Surveys
Primary discussions were run with fleet operators, driver aggregators, dispatch and platform teams, and a few large corporate travel buyers to validate real world trip volumes and take rates. Inputs were also used to sanity check how pricing moves with fuel, congestion, and incentive levels, and then to align assumptions across the main demand regions where taxis are used daily.
Distribution of primary research fieldwork respondents
| Company type | Respondent position | Region |
|---|---|---|
| Top tier: 36% | CXOs: 18% | APAC: 38% |
| Mid tier: 45% | Functional/Unit leaders: 22% | EMEA: 36% |
| Smaller Players: 19% | Managers: 60% | Americas: 26% |
Market-Sizing & Forecasting
Sizing was built by starting from a top-down demand pool, where urban population, trip frequency indicators, and the share of trips served by taxis are used to reconstruct annual ride volumes by region, which are then multiplied by an average fare per trip. To keep the totals realistic, we also corroborated results using selective bottom-up checks such as sampled city level trip counts, fleet activity benchmarks, and spot checks on average fares from dispatch and app quotes.
Key model inputs included online versus offline booking mix, average trip length and occupancy, fuel and electricity price direction, fleet mix shifts (cars versus two and three wheelers where relevant), and local regulation signals such as permit caps and fare revisions. Forecasts were built using scenario analysis anchored to consensus ranges from interviews, and then adjusted using demand indicators like urbanization pace and tourism and business travel recovery. Where a direct read on trip volume or fare was missing for smaller countries, proxy ratios from comparable cities were applied and then rechecked through follow up calls.
Data Validation & Update Cycle
Outputs are checked through several passes so the final number stays aligned with how the market actually behaves. We compare implied rides per capita, fleet utilization, and fare progression against independent public signals, and any outliers are reworked until the assumptions are explainable. Before sign off, the model is reviewed by another analyst to confirm that currency conversion timing, inflation treatment, and regional roll ups are consistent.
Reports are refreshed annually, and interim updates are added when material events show up, such as major regulatory fare resets, sharp fuel price moves, or step changes in incentive intensity. Right before delivery, a final pass is done to incorporate the latest releases and to re contact sources when a variance cannot be explained with the existing evidence.
Mordor Intelligence's Taxi Market Size Compared With Other Published Estimates
Published taxi market values often do not match because each publisher draws the line around slightly different services and geographies, and then uses its own volume and pricing assumptions. Differences also show up when the base year is not the same, or when currency conversion and inflation handling are done at different points in the model.
Limousine only revenue and chauffeur rentals are kept outside Mordor Intelligence's scope here, which is one reason the 2026 baseline can look different versus estimates that blend taxi with broader hired car categories. Another common gap driver is how pooled rides are treated, since some studies value the full trip fare once, and others split value by passenger counts, which changes the total even when trip numbers are similar.
Benchmark comparison
| Source | Market Size | Gaps in Research Methodology |
|---|---|---|
| Mordor Intelligence | USD 254.36 B (2026) | |
| Global Consultancy A | USD 96.31 B (2025) | Uses a narrower value pool that appears closer to regulated taxi service revenue and selected ownership models, which can exclude parts of app-based supply and several non-car vehicle formats covered in broader taxi definitions. |
| Industry Publisher B | USD 255.40 B (2025) | Keeps a similar service label but anchors to a different base year and may apply a smoother fare growth path, which can shift totals when incentive intensity, fuel-linked pricing, and local fare resets move unevenly by region. |
The spread mainly comes from what gets counted as a taxi service and how ride volumes are converted into value through fares and take rates. By tying the model to trip activity signals, fare revision patterns, and cross checks from operator interviews, the estimate stays traceable to clear inputs that can be reviewed and updated year by year.
Key Questions Answered in the Report
How large will the taxi market be by 2031?
It is projected to reach USD 366.91 billion by 2031, expanding at an 7.62% CAGR from 2026.
Which region contributes the highest revenue?
Asia-Pacific led with 37.42% share in 2025, supported by dense urban centers and high smartphone penetration.
What is driving electric taxi adoption?
Lower fuel costs, government subsidies, and city emissions mandates are pushing fleet operators toward EV formats that are growing at an 8.05% CAGR.
Why are two-wheeler taxis gaining popularity?
They navigate congestion efficiently and offer cheaper fares, which is why the segment is growing at an 7.71% CAGR, especially in Southeast Asia.
How are regulations affecting the sector?
Accessibility rules, evolving licensing, and data-privacy legislation raise compliance costs and can slow expansion.
Are autonomous taxis commercially viable yet?
Pilot deployments have begun, and partnerships like Uber-Lucid-Nuro aim to roll out 20,000 robotaxis from 2026, signaling accelerating commercialization within the decade.