
Market Overview
| Study Period | 2020 - 2031 |
|---|---|
| Market Volume (2026) | 87.09 Million tonnes |
| Market Volume (2031) | 103.06 Million tonnes |
| Growth Rate (2026 - 2031) | 3.42% CAGR |
| Fastest Growing Market | Asia Pacific |
| Largest Market | North America |
| Market Concentration | Low |
Major Players *Disclaimer: Major Players sorted in no particular order Image © Mordor Intelligence. Reuse requires attribution under CC BY 4.0. | |
Glass Bottles And Containers Market Analysis by Mordor Intelligence
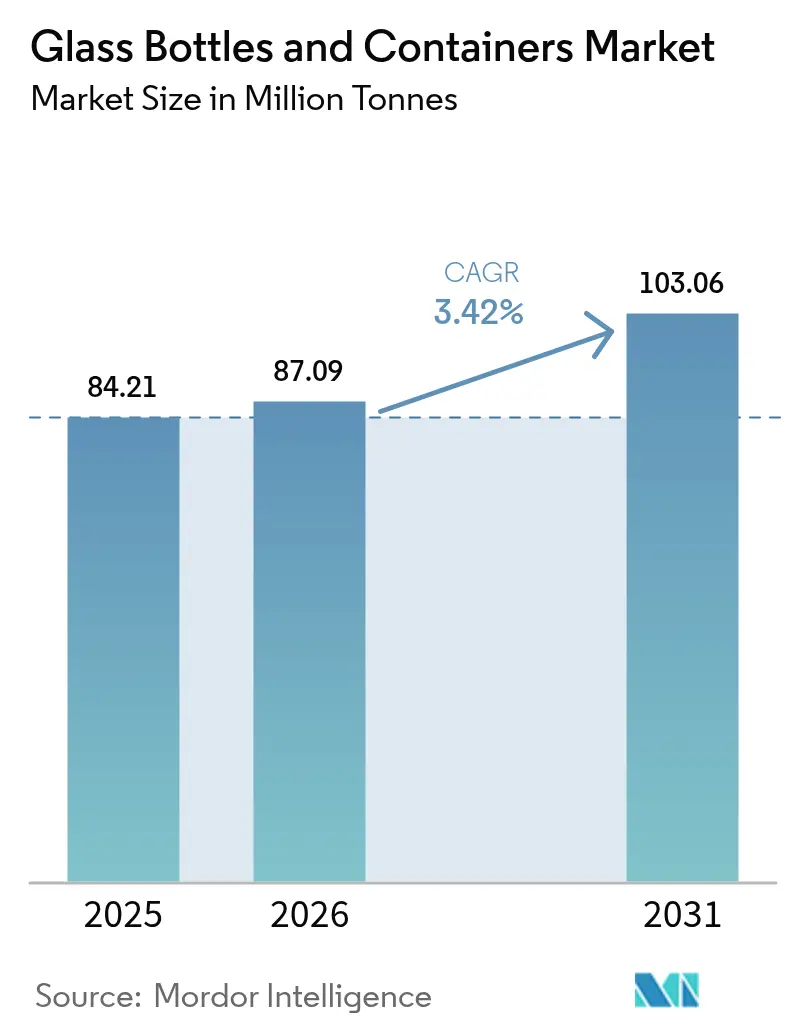
The Glass Bottles and Containers market size is expected to grow from 84.21 million tonnes in 2025 to 87.09 million tonnes in 2026 and is forecast to reach 103.06 million tonnes by 2031 at 3.42% CAGR over 2026-2031. Heightened regulatory pressure on single-use plastics, premiumization in beauty and spirits, and pharmaceutical fill-finish expansion are steering steady gains despite energy-price headwinds. California’s 65% plastic-reduction mandate and France’s polystyrene ban have already swung demand toward infinitely recyclable glass.[1]California Legislative Information, “Senate Bill No. 54,” leginfo.legislature.ca.govHybrid furnaces, oxy-fuel combustion, and high-cullet recipes are mitigating cost exposure, while lightweighting breakthroughs such as Vidrala’s 260-gram 75 cl bottle trim material intensity without sacrificing shelf appeal. Producers also leverage color differentiation, especially amber, to protect light-sensitive drugs and craft beverages, reinforcing value over lighter substitutes.
Key Report Takeaways
- By end-user, beverages captured 64.02% of the glass bottles and containers market share in 2025.
- By color, the glass bottles and containers for amber glass are projected to grow at a 3.79% CAGR between 2026-2031.
- By geography, North America captured 55.18% of the glass bottles and containers market share in 2025.
Note: Market size and forecast figures in this report are generated using Mordor Intelligence’s proprietary estimation framework, updated with the latest available data and insights as of 2026.
Global Glass Bottles And Containers Market Trends and Insights
Drivers Impact Analysis*
| Driver | (~) % Impact on CAGR Forecast | Geographic Relevance | Impact Timeline |
|---|---|---|---|
| Plastic bans drive shift to recyclable glass packaging | +0.8% | California, France, EU | Medium term (2–4 years) |
| Prestige beauty “glassification” trend lifts jar and bottle volumes | +0.6% | North America and Europe | Long term (≥ 4 years) |
| Pharma fill-finish expansion boosts demand for glass vials | +0.5% | APAC, global | Long term (≥ 4 years) |
| Craft alcohol boom spurs custom container demand | +0.4% | North America and Europe | Medium term (2–4 years) |
| Source: Mordor Intelligence | |||


Plastic Bans Drive Shift to Recyclable Glass Packaging
California’s SB 54 mandates a 65% cut in single-use plastic packaging by 2032, while France has barred expanded polystyrene food containers from January 2025, propelling brand owners to switch to glass. The European Union’s pending bisphenol-A restrictions further reinforce conversion in food contact segments. Because glass maintains an endless closed loop and established curb-side collection, converters are capturing new volumes even as they absorb retooling costs. The ripple effect is evident in beverage and condiment lines moving back to glass at big-box retailers. Though cullet supply tightens temporarily, hybrid furnaces and lightweighting partially offset margin compression, paving a sustained uplift through the forecast horizon.
Prestige Beauty “Glassification” Trend Lifts Jar and Bottle Volumes
Luxury skincare and fragrance brands increasingly adopt glass to signal premium quality and environmental stewardship. Verallia’s 100% post-consumer-recycled (PCR) Vista bottles cut energy use by 40% versus virgin production, proving that circularity can coexist with high-end aesthetics.[2]Packaging Europe, “Verallia unveils bottle made from 100% PCR glass,” packagingeurope.comEmbossing, color gradations, and refillable designs amplify shelf differentiation and justify higher price points. Since packaging cost is a small share of retail value in beauty, brands absorb higher unit costs more easily than mass-market beverages. The trend scales globally but is most pronounced in North America and Western Europe, reinforcing long-tail demand for custom molds and short production runs.
Pharma Fill-Finish Expansion Boosts Demand for Glass Vials
Surging biologics pipelines and injectable therapies such as GLP-1 drugs require chemically inert vials that prevent interaction and delamination. Gerresheimer derived EUR 898.6 million (USD 1.02 billion) in primary packaging glass revenue in 2024 and doubled down with its Bormioli Pharma acquisition, illustrating strategic consolidation around pharma glass. Asia Pacific’s contract-manufacturing boom compounds volume needs, while the FDA and EMA continue to specify Type I borosilicate for sensitive formulations. High-margin, specification-driven vials insulate producers from commodity pricing cycles and anchor capacity investments for the long term.
Craft Alcohol Boom Spurs Custom Glass Container Demand
Craft distilleries produced 13.5 million cases in 2024, pursuing ornate bottle shapes that elevate brand storytelling. Similar momentum in the United Kingdom, where the number of licensed distilleries widened 42.8% from pre-COVID levels, underscores a flourishing niche for bespoke glass. Small-batch spirits command price premiums that absorb container cost inflation, incentivizing manufacturers to offer low-minimum-order, high-decoration services. The trend also spills into ready-to-drink cocktails and low-alcohol variants, broadening addressable demand for custom designs.
Restraints Impact Analysis*
| Restraint | (~) % Impact on CAGR Forecast | Geographic Relevance | Impact Timeline |
|---|---|---|---|
| Energy price volatility threatens furnace economics | -0.9% | Europe, global | Short term (≤ 2 years) |
| rPET bottle adoption undercuts glass in logistics-sensitive channels | -0.7% | Global beverage logistics | Medium term (2–4 years) |
| Weak Cullet Collection Infrastructure Limits Recycled Content | -0.4% | Developing markets, rural areas globally | Long term (≥ 4 years) |
| Breakage Losses in Long-Haul Shipping Discourage Glass Use | -0.3% | Global trade routes, emerging markets | Medium term (2–4 years) |
| Source: Mordor Intelligence | |||
Energy Price Volatility Threatens Furnace Economics
Electricity prices in the United Kingdom spiked to record levels in 2024, compelling glassmakers to idle lines during peak tariffs. Energy constitutes roughly 18% of production costs, so volatility can erase margins faster than price adjustments reach the market. Carbon-pricing schemes further penalize fossil-fuel consumption, intensifying capital commitments toward hybrid furnaces and on-site renewables. In contrast, O-I Glass secured USD 125 million in federal funding for decarbonization, but smaller regional plants face liquidity strains, potentially curbing short-term supply.
rPET Bottle Adoption Undercuts Glass in Logistics-Sensitive Channels
Lightweight rPET bottles weigh nearly 90% less than comparable glass, yielding freight savings that make a decisive difference for low-margin, long-haul beverage SKUs. Breakage rates of 2-3% in glass shipments amplify the cost gap. As recycling rates climb and bottle-to-bottle loops mature, sustainability objections erode, especially for private-label soft drinks where aesthetics carry less weight. Glass retains an edge in premium tiers, but the value segment’s tilt toward rPET will restrain container glass packaging market growth in high-volume channels.
*Our forecasts treat driver/restraint impacts as directional, not additive. The impact forecasts reflect baseline growth, mix effects, and variable interactions.
Segment Analysis
By End-user: Beverages Anchor Market Despite Cosmetics Surge
Beverages commanded 64.63% of the container glass packaging market in 2024, but growth has begun to plateau as major breweries trial lightweight rPET for economy lines. In contrast, cosmetics and personal care, though on a smaller base, are set to post the fastest 4.24% CAGR as brands use glass to signal luxury and sustainability. The container glass packaging market size for cosmetics jars is projected to widen materially by 2030 as refill stations and PCR glass creations gain ground. Food, condiments, and preserves maintain a stable share thanks to shelf-life advantages, while pharmaceutical demand continues to expand on the back of biologics.
The cosmetics advance springs from consumer willingness to pay a premium for beautiful, tactile jars and bottles. Custom shapes, pastel tints, and heavy bases espouse the sensorial narrative that glass uniquely delivers. Moreover, zero-plastic brand pledges, amplified by social-media influencers, accelerate brand conversions in key Western markets. Although drinks still dominate absolute tonnage, value growth is migrating toward higher-margin beauty and health categories, diversifying revenue streams for producers.


By Color: Amber Gains Ground Through Pharma and Craft Applications
Flint maintained a 58.28% share of the container glass packaging market size in 2024, owing to its broad utility across beverages and foods. Nonetheless, amber glass-favored for its ultraviolet-blocking feature-will outpace at a 3.83% CAGR through 2030 as pharma vials and craft drinks proliferate. The container glass packaging market share for amber beer bottles in Europe is already climbing in tandem with independent breweries that prize product stability and rustic aesthetics.
Growth in amber owes much to pharmaceutical regulatory guidance that specifies light protection for biologics, boosting procurement contracts for Type I amber borosilicate. Craft distillers also gravitate toward darker hues to convey heritage themes. Green and specialty colors persist as niche domains, notably in wine and limited-edition spirits, where marketing narratives trump functional considerations.

Geography Analysis
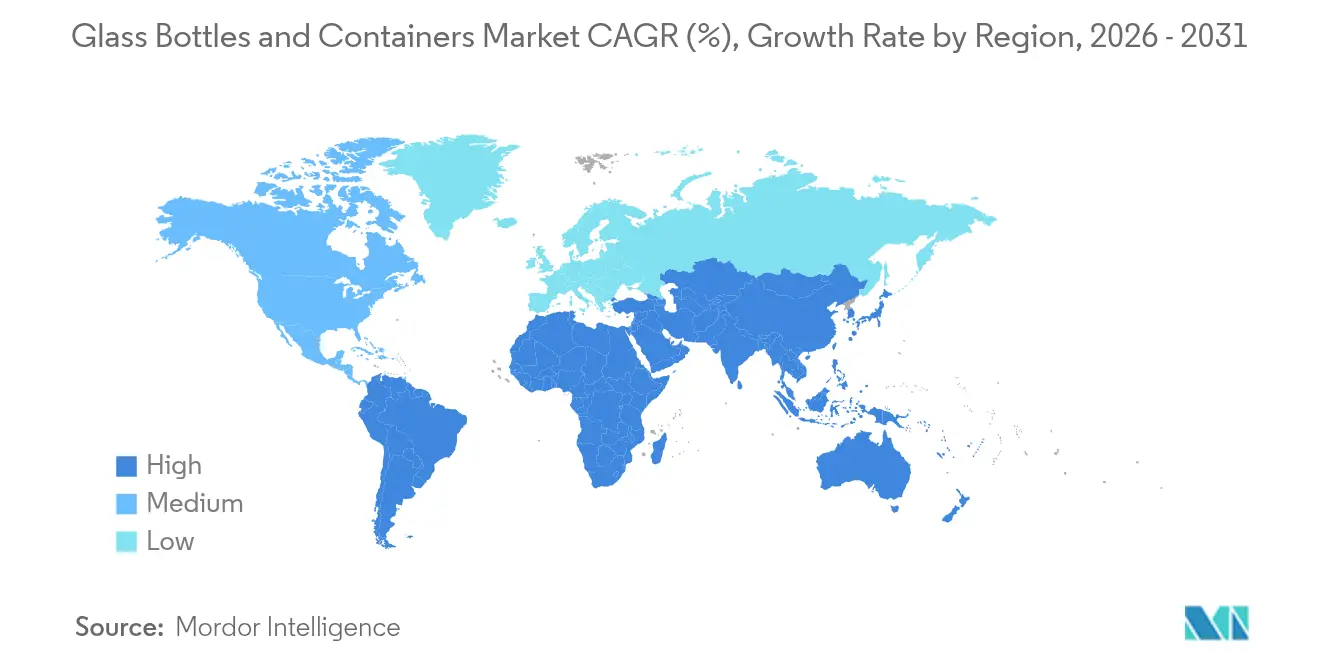
North America captured 55.18% of the container glass packaging market in 2025, leveraging mature curbside collection and corporate sustainability goals that encourage high-cullet recipes. The Glass Packaging Institute’s roadmap to reach a 50% recycling rate by 2030 underpins the long-term feedstock base. Yet energy-price swings and growing rPET penetration in value beverages temper volume gains, shifting strategic emphasis toward premium spirits and beauty care.
Europe trails but benefits from the EU’s 80.8% recycling rate, which secures cullet and lowers furnace energy demand. Ardagh and Verallia are investing in electric-boost and hydrogen-ready furnaces to hedge carbon-pricing exposure while maintaining output. However, power-price stress and environmental levies suppress near-term margins, sparking collaboration on shared renewable micro-grids and cross-border cullet trade.
Asia Pacific is the fastest-growing region, expanding 4.76% CAGR through 2031 and rapidly closing the gap in the container glass packaging market. India and China build greenfield pharmaceutical plants that require sterile vials, while South Korea and Japan import premium cosmetic glass for luxury skincare. O-I Glass’s USD 120 million upgrade in Zipaquirá, Colombia, signals how producers replicate best-in-class technology in emerging regions to capture demand while aligning with ESG mandates. Limited cullet infrastructure in parts of Southeast Asia constrains recycled content, creating cost penalties versus Western peers; nevertheless, rising incomes and regulatory push for circularity promise robust long-term demand.
Regulatory Landscape
Regulatory actions across major consuming regions continue to steer packaging choices toward circular materials while adding compliance and trade-cost complexity for container glass. In the European Union, Regulation (EU) 2025/40 on packaging and packaging waste (PPWR) entered into force in February 2025, with key provisions applying from August 12, 2026. These include harmonized sorting labels and packaging-minimization requirements that affect all packaging placed on the EU market, including glass bottles and jars.
Food-contact and trade measures are also shaping material selection and sourcing. The European Commission published Commission Regulation (EU) 2026/250 in February 2026 to correct and update rules for bisphenol A (BPA) in food contact materials, reinforcing attention to compliance documentation for closures, coatings, and contact surfaces used with glass containers. On the trade front, the U.S. Department of Commerce finalized antidumping duty orders in February 2025 on certain glass wine bottles from China and Mexico. The UK Trade Remedies Authority launched anti-subsidy and anti-dumping investigations in March 2026 covering imported glass containers under 2.5 litres, which can shift regional supply economics and procurement strategies for beverage and food packers.
Competitive Landscape
The container glass packaging market remains moderately consolidated. O-I Glass, Verallia, and Ardagh collectively shipped just over 55% of global volumes in 2024, wielding scale advantages in procurement, furnace technology, and distribution. O-I Glass’s MAGMA modular furnace, now topping off in Kentucky, exemplifies capital-light expansion that trims changeover downtime and improves glass quality. Verallia focuses on PCR breakthroughs, while Ardagh pilots hydrogen-assisted melting.
Medium-sized regional specialists vie on custom molds, agile batch sizes, and service proximity, addressing craft beverage and beauty segments that the majors sometimes overlook. Vidrala’s record-light 260-gram bottle showcases value creation through engineering-diminishing glass-to-product weight ratio, lowering logistics emissions, and courting environmentally conscious brands.
M&A stays active: Gerresheimer’s December 2024 acquisition of Bormioli Pharma bolsters its molded-glass unit and strengthens a pharma-heavy portfolio. Joint ventures emerge in Latin America and Africa, where greenfield capital needs are high, but political risk is equally elevated. Despite moderate concentration, high furnace costs form a barrier to entry that keeps new competitors at bay unless they secure government or customer co-funding.
Glass Bottles And Containers Industry Leaders
O-I Glass, Inc.
Ardagh Group S.A.
Gerresheimer AG
Vidrala S.A.
Verallia S.A.
- *Disclaimer: Major Players sorted in no particular order


Market Opportunities and Future Outlook
Regulatory programs that tighten packaging design, labeling, and producer-responsibility obligations are creating whitespace for suppliers that can combine premiumization with measurable circularity. With EU PPWR application starting August 2026, brand owners and converters are pushed to standardize pack formats, improve sortability, and document compliance. That direction elevates demand for lightweighted designs and higher-cullet recipes that reduce material intensity while preserving shelf differentiation. Industry coordination to operationalize these requirements is showing up through trade-body activity, including the March 31, 2026 webinar hosted by the Glass Packaging Institute (GPI) and FEVE on PPWR impacts across glass packaging supply chains and business models.
Investment and capacity moves point to where producers are placing near-term emphasis, including modernized melting, electrification, and efficient furnace rebuilds aimed at both output continuity and decarbonization targets. Stoelzle Glass USA announced a USD 100 million transformation of its Monaca, Pennsylvania facility, including a furnace rebuild beginning in July 2026 that lifts melting capacity by about 400 tons per day, while Ciner Glass confirmed EUR 504 million financing in January 2026 for its Lommel, Belgium container glass project as it moved into active furnace construction. Meanwhile, weight-based EPR and deposit-return debates are sharpening demand for lighter formats and stronger collection systems, supported by July 2026 legal challenges around Oregon EPR fees and ongoing UK discussions on pEPR and glass handling. This is opening supplier opportunities around lightweighting, refillable designs, and verified recycled content with stable cullet access.
Recent Industry Developments
- June 2026: O-I Glass produced its first glass using a new air-gas hybrid furnace at the Veauche, France facility on June 7, 2026, using Fives technology that can replace up to 70% of fossil fuels with electricity. The milestone signals a practical pathway for large-scale container glass decarbonization while protecting throughput, a key constraint for producers facing energy-price volatility. It also strengthens O-I Glass positioning in tender requirements tied to lower-carbon packaging and higher recycled-content recipes.
- April 2026: Ardagh Glass Packaging-North America launched a 275ml glass beverage bottle in collaboration with Fitz's Bottling Company. The introduction expands standardized, ready-to-adopt formats for regional beverage fillers and supports shorter lead times versus fully bespoke molds. The move also reinforces how suppliers are using stock and semi-custom offerings to capture craft and specialty beverage demand without sacrificing manufacturing efficiency.
- October 2025: Gerresheimer held the groundbreaking ceremony for a 4,000 m2 production facility for ready-to-fill (RTF) vials and EZ-fill Smart packaging at its Wertheim, Germany site, supported by a EUR 30 million investment. The project deepens Gerresheimer capacity in specification-driven pharma primary packaging where quality systems and contamination control are decisive purchasing criteria. It also underlines continued capital allocation toward higher-margin medical and injectable-drug packaging as biologics pipelines expand.


Research Methodology Framework and Report Scope
Market Definition and Coverage
This market covers glass bottles and rigid glass containers used to pack and store commercial products, and the demand is tracked using finished container glass consumption across major end-use industries worldwide.
Coverage exclusions: It excludes pharmaceutical vials and ampoules, and it also excludes non-container glass items such as flat glass, fibers, and lab glassware.
Segmentation Overview
- By End-user
- Beverages
- Alcoholic
- Beer
- Wine
- Spirits
- Other Alcoholic Beverages (Cider and Other Fermented Drinks)
- Non-Alcoholic
- Juices
- Carbonated Drinks (CSDs)
- Dairy Product Based Drinks
- Other Non-Alcoholic Beverages
- Alcoholic
- Food (Jam, Jelly, Marmalades, Honey, Sausages and Condiments, Oil, Pickles)
- Cosmetics and Personal Care
- Pharmaceuticals (excluding Vials and Ampoules)
- Perfumery
- Beverages
- By Color
- Green
- Amber
- Flint
- Other Colors
- By Geography
- North America
- United States
- Canada
- Mexico
- South America
- Brazil
- Argentina
- Rest of South America
- Europe
- United Kingdom
- Germany
- France
- Italy
- Spain
- Russia
- Rest of Europe
- Asia Pacific
- China
- Japan
- India
- South Korea
- Australia
- Rest of Asia Pacific
- Middle East and Africa
- Middle East
- United Arab Emirates
- Saudi Arabia
- Turkey
- Rest of Middle East
- Africa
- South Africa
- Nigeria
- Rest of Africa
- Middle East
- North America
Data Sources, Market Sizing, and Validation
Desk Research
For desk research, we first pull the core industry structure, including container-glass uses, trade flows, and regional manufacturing footprints. Public sources that help here include materials and packaging statistics from agencies such as the USGS, UN Comtrade, World Bank indicators, and government environment and waste programs that track glass collection and recycling rates.
To keep the model practical, we also review company annual reports, investor presentations, and plant or capacity announcements to confirm where volumes are produced and shipped. Patent databases are checked to identify process shifts such as lightweighting and furnace upgrades, and an import and export shipment-level database is used selectively to sanity-check major routes and product movement patterns. The sources listed above are illustrative, and many other public references were also consulted for data collection, validation, and clarification.
Primary Interviews and Surveys
Primary work focused on validating where glass containers are used the most and how ordering patterns are changing across beverage, food, personal care, and pharma packaging teams. We spoke with manufacturers, converters, brand owners, and distributors across APAC, EMEA, and the Americas, so assumptions on mix, utilization behavior, and substitution pressure could be cross-checked before finalizing the model.
Distribution of primary research fieldwork respondents
| Company type | Respondent position | Region |
|---|---|---|
| Top tier: 32% | CXOs: 13% | APAC: 49% |
| Mid tier: 53% | Functional/Unit leaders: 32% | EMEA: 31% |
| Smaller Players: 15% | Managers: 55% | Americas: 20% |
Market-Sizing & Forecasting
Market sizing is built using a top-down approach where production and trade signals, adjusted for conversion losses and regional consumption patterns, are used to reconstruct the demand pool for container glass in tonnes. Once the total is formed, it is tested with selective bottom-up approximations such as sampled supplier roll-ups by region, channel checks with large buyers, and average volume per pack format multiplied by observed shipment trends.
Key inputs include beverage output and mix shifts (beer, spirits, wine, and non-alcoholic drinks), packaged food demand signals, glass collection and recycling rates that affect cullet availability and costs, furnace capacity additions and rebuild cycles, and lightweighting intensity that changes average container weight over time. Where bottom-up checks have gaps, the missing parts are filled using conservative ranges tied to capacity utilization and end-use penetration, then the totals are rebalanced to avoid overstating any single region.
For forecasting, scenario analysis is applied with a base case anchored to expected beverage and food volumes, and then adjusted using expert inputs on pricing pass-through, substitution to other materials, and regulatory pressure around sustainable packaging. Assumptions are kept consistent across regions, and currency is not treated as a driver because the market output is modeled in physical volume.
Data Validation & Update Cycle
Validation is done through triangulation across independent signals, then followed by variance checks at the region and end-use levels so that outliers are visible early. If the model implies a step-change that is not supported by capacity, trade, or demand indicators, the assumption is revisited and the related inputs are recalibrated.
Before sign-off, the work goes through multi-step analyst reviews, and follow-up calls are triggered when an interview response conflicts with desk evidence or when a major plant change is reported. Reports are refreshed annually, and interim updates are made when material events occur, such as large furnace shutdowns, expansions, or major policy shifts. Right before delivery, a final pass is completed so clients receive the most current view available.
Mordor Intelligence's Global Glass Bottles Containers Market Market Size Compared Against Other Published Estimates
Published market sizes for glass bottles and containers often differ because the underlying product scope and units are not aligned, even when the titles look similar. Differences also show up when one source tracks value in USD and another tracks consumption in tonnes, which can move results materially when prices and lightweighting change.
In this study, the biggest gap driver is the decision to size container glass as consumption volume and to exclude pharmaceutical vials and ampoules, while some other estimates include those pharma formats in the total and then present a USD value built on broad average pricing and currency timing, a choice kept explicit here by Mordor Intelligence.
Benchmark comparison
| Source | Market Size | Gaps in Research Methodology |
|---|---|---|
| Mordor Intelligence | USD 87.09 M (2026) | |
| Global Consultancy A | USD 79.17 B (2025) | Uses a value-based container glass definition that is likely price-led, which can blend bottles and jars with adjacent glass packaging categories and makes results sensitive to assumed ASP progression and currency conversion timing. |
| Industry Publisher B | USD 76.46 B (2024) | Includes wider pharma packaging formats such as vials and ampoules within the product scope, and the market value outcome depends heavily on the implied price deck and the chosen base year for inflation adjustments. |
The table shows that scope and measurement choices explain most of the spread, more than any single growth assumption. When the demand pool is tied to observable consumption drivers and checked against capacity and trade signals, the estimate stays easier to trace and update even when pricing cycles shift.


Key Questions Answered in the Report
What is the current size of the container glass packaging market?
The sector reached 87.09 million tonnes in 2026 and is forecast to hit 103.06 million tonnes by 2031.
How fast is Asia Pacific demand for container glass rising?
Volume in Asia Pacific is expected to grow at a 4.76% CAGR between 2026-2031 on the back of pharma and beauty applications.
Which end-user segment shows the strongest growth?
Cosmetics and personal care leads with an anticipated 4.18% CAGR through 2031 thanks to luxury-branding and sustainability trends.
How are energy costs influencing glass manufacturing?
Volatile electricity and gas prices, especially in Europe, squeeze margins and hasten adoption of hybrid and oxy-fuel furnaces.
What innovation is helping reduce glass weight?
Vidrala’s 260-gram 75 cl bottle exemplifies lightweighting that cuts materials and freight emissions.
Who are the top players in the market?
O-I Glass, Verallia, and Ardagh together account for just over 55% of global shipments, reflecting moderate consolidation.
Page last updated on:




