Dimensão e Quota do Mercado de Gelatina da Índia
Visão Geral do Mercado
| Período de Estudo | 2021 - 2031 |
|---|---|
| Período de Dados de Previsão | 2026 - 2031 |
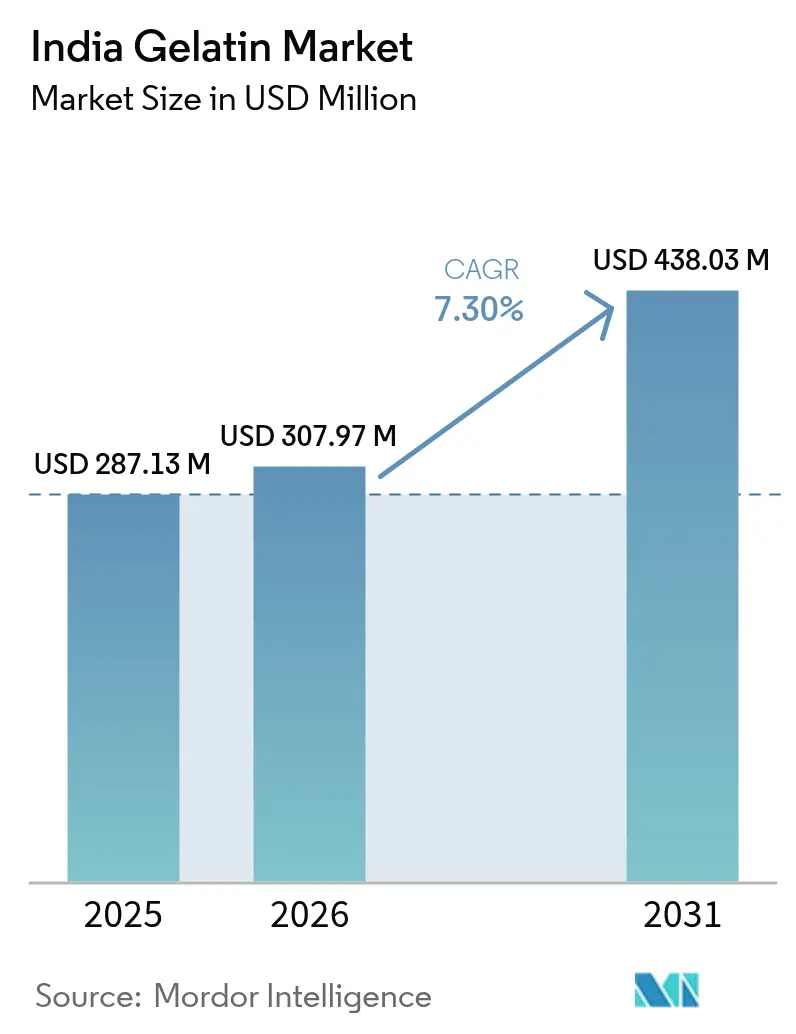
| Tamanho do mercado no ano base (2025) | 287.13 Milhões de dólares |
| Tamanho do Mercado (2026) | 307.97 Milhões de dólares |
| Tamanho do Mercado (2031) | 438.03 Milhões de dólares |
| Taxa de crescimento (2026 - 2031) | 7.30% CAGR |
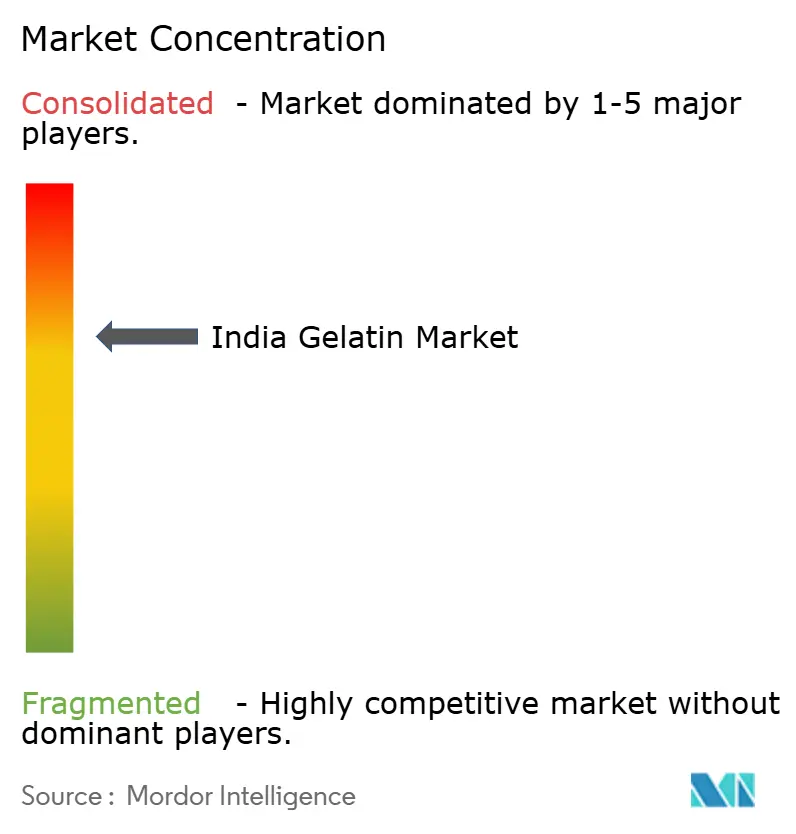
| Concentração do Mercado | Médio |
Principais jogadores *Isenção de responsabilidade: Principais participantes classificados em nenhuma ordem específica Imagem © Mordor Intelligence. O reuso requer atribuição conforme CC BY 4.0. | |
Análise do Mercado de Gelatina da Índia pela Mordor Intelligence
A dimensão do mercado de gelatina indiano deverá crescer de USD 287,13 milhões em 2025 para USD 307,97 milhões em 2026, com previsão de atingir USD 438,03 milhões até 2031, a uma CAGR de 7,30% no período 2026-2031. O crescimento do mercado é impulsionado pelo aumento da procura proveniente dos setores de alimentos funcionais, produtos farmacêuticos e cuidados pessoais. Os fabricantes beneficiam de acesso fiável a matérias-primas através de fontes de colagénio bovino, suíno e marinho. Os incentivos de produção vinculada do governo para o processamento de alimentos e os requisitos obrigatórios de certificação halal para mercados de exportação específicos levaram as principais empresas a aprimorar as suas capacidades tecnológicas e sistemas de gestão da qualidade. As perspetivas de crescimento do mercado são reforçadas pelo aumento da urbanização, por uma base de consumidores cada vez mais consciente da saúde e por diretrizes regulatórias claras para a rotulagem de nutracêuticos. A estrutura do mercado é caracterizada por consolidação moderada, desenvolvimentos contínuos no colagénio marinho e tecnologias emergentes de proteínas por fermentação que poderão influenciar os padrões futuros de investimento.
Principais Conclusões do Relatório
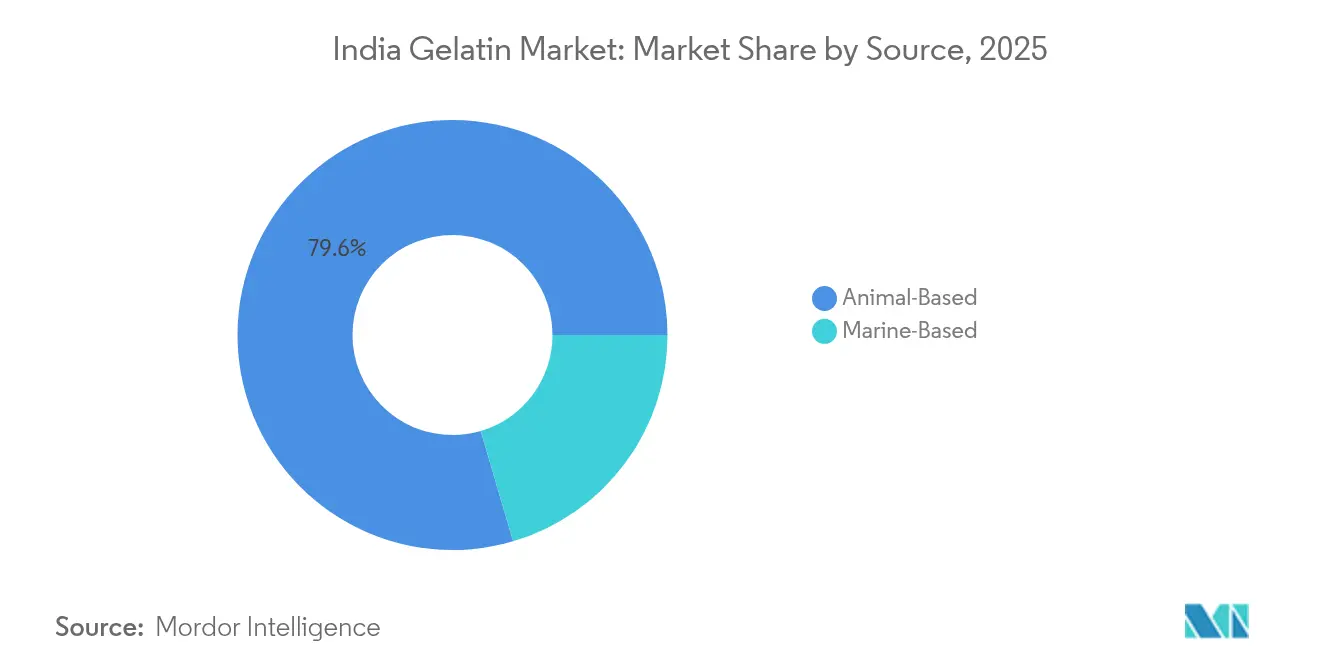
- Por fonte, a gelatina de base animal detinha 79,55% da quota do mercado de gelatina em 2025, enquanto as fontes marinhas estão projetadas para liderar o crescimento a uma CAGR de 7,70% até 2031.
- Por grau, o segmento de grau alimentar representava 55,05% da dimensão do mercado de gelatina em 2025; o grau farmacêutico está previsto para superar todos os graus com uma CAGR de 7,82% até 2031.
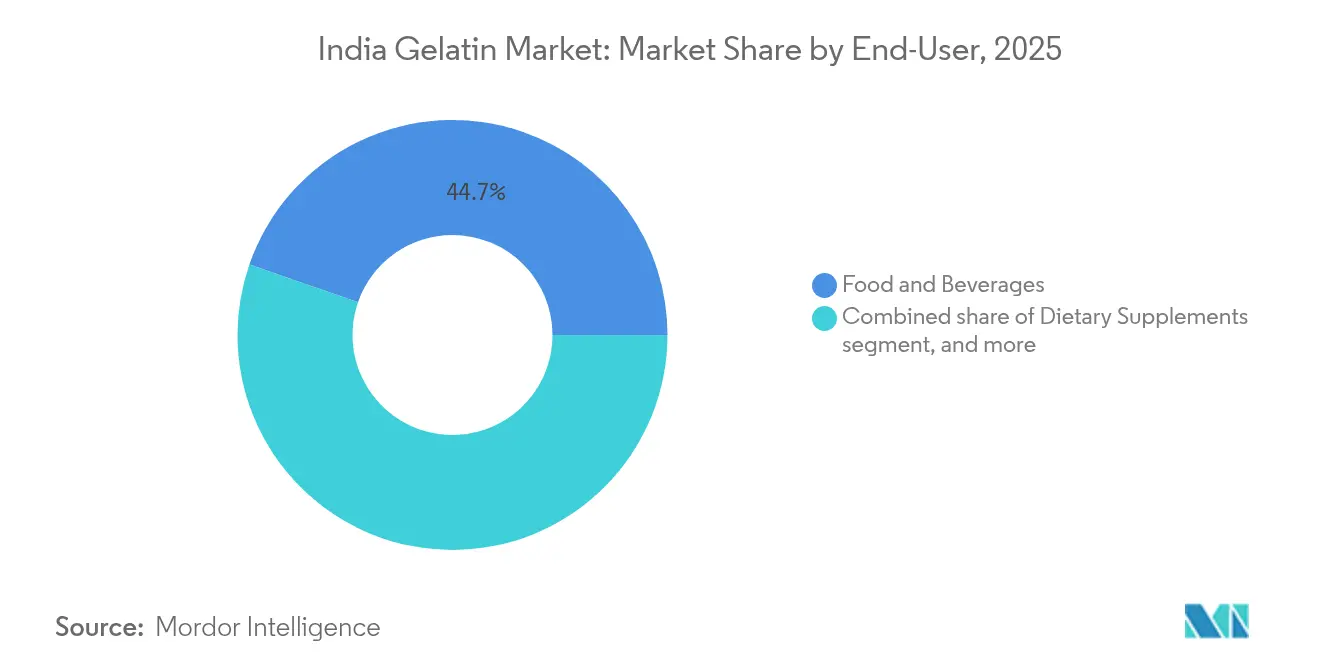
- Por utilizador final, alimentos e bebidas dominavam com 44,68% da quota do mercado de gelatina em 2025, enquanto os suplementos alimentares deverão crescer mais rapidamente a uma CAGR de 8,06% no período 2026-2031.
Nota: Os números de tamanho de mercado e previsão neste relatório são gerados usando a estrutura de estimativa proprietária da Mordor Intelligence, atualizada com os dados e insights mais recentes disponíveis até 2026.
Tendências e Perspetivas do Mercado de Gelatina da Índia
Análise de Impacto dos Impulsionadores*
| Impulsionador | (~) % de Impacto na Previsão de CAGR | Relevância Geográfica | Horizonte Temporal de Impacto |
|---|---|---|---|
| Expansão do setor de confeitaria e laticínios processados | +1.2% | Nacional, com concentração em Gujarat, Maharashtra, Tamil Nadu | Médio prazo (2-4 anos) |
| Crescimento de alimentos e bebidas funcionais | +1.8% | Mercados urbanos em todo o país, adoção antecipada nas metrópoles | Curto prazo (≤ 2 anos) |
| Mudança para produtos com rótulo limpo e enriquecidos em proteínas | +1.5% | Nacional, segmentos premium em cidades de Nível 1 | Médio prazo (2-4 anos) |
| Utilização substancial de gelatina em produtos farmacêuticos | +1.1% | Centros farmacêuticos de Gujarat, Hyderabad, Goa | Longo prazo (≥ 4 anos) |
| Adoção crescente em cuidados pessoais e cosméticos | +0.9% | Centros urbanos, fabricação orientada para exportação | Médio prazo (2-4 anos) |
| Incentivos governamentais para a recuperação de colagénio de resíduos de carne | +0.8% | Estados com infraestrutura de processamento de carne | Longo prazo (≥ 4 anos) |
| Fonte: Mordor Intelligence | |||
Expansão do Setor de Confeitaria e Laticínios Processados
O crescimento do mercado de confeitaria da Índia aumentou a procura de gelatina, uma vez que os fabricantes a utilizam para melhorar a textura e prolongar o prazo de validade dos produtos. A expansão do mercado é apoiada pelo aumento dos rendimentos disponíveis e pela mudança das preferências alimentares em direção a produtos ocidentais, especialmente em áreas urbanas onde os artigos de confeitaria premium geram margens mais elevadas. O segmento de processamento de laticínios, apoiado pelo estatuto da Índia como o maior produtor mundial de leite, incorpora gelatina em iogurtes, sobremesas e produtos lácteos funcionais para melhorar a textura e o teor nutricional. O Ministério das Indústrias de Processamento de Alimentos (MOFPI) disponibiliza financiamento de infraestrutura para unidades de processamento de alimentos, permitindo-lhes expandir a capacidade e atualizar a tecnologia, o que aumenta a utilização de gelatina na produção. O governo identificou diversas oportunidades de crescimento no setor de processamento de laticínios para 2025, incluindo tecnologias avançadas de processamento de laticínios, desenvolvimento de cadeia de frio e inovação de produtos em queijo, smoothies, leite com sabor, pudim, iogurte e produtos tradicionais indianos[1]Fonte: Ministério das Indústrias de Processamento de Alimentos (MOFPI), Oportunidades no Setor de Laticínios na Índia,
mofpi.gov. Estes desenvolvimentos expandem a utilização de gelatina como ingrediente funcional tanto em produtos de confeitaria como em laticínios processados.
Crescimento de Alimentos e Bebidas Funcionais
A expansão do segmento de alimentos e bebidas funcionais da Índia está a impulsionar o aumento da procura de gelatina. Os fabricantes estão a incorporar gelatina em bebidas enriquecidas com proteínas, gomas fortificadas e suplementos nutricionais para satisfazer as necessidades dos consumidores conscientes da saúde. Nestas aplicações, a gelatina serve tanto como ingrediente funcional para textura e estabilidade como como meio de encapsulamento para vitaminas, minerais e compostos bioativos. Os péptidos de colagénio obtidos através da hidrólise da gelatina proporcionam propriedades bioativas benéficas para a saúde da pele, função articular e bem-estar geral, contribuindo para o desenvolvimento de produtos de nutrição premium. Um estudo global da Wonderful Pistachios revelou que 58% dos indianos urbanos priorizam os benefícios nutricionais em detrimento do sabor nas suas compras de alimentos, superando a média global de 52%. Delhi e Ahmedabad demonstram a mentalidade mais forte de nutrição em primeiro lugar, com mais de 60% dos consumidores urbanos a priorizar os benefícios para a saúde. Bengaluru e Chennai mostram tendências semelhantes, indicando uma mudança nacional mais ampla em direção a escolhas alimentares orientadas para a saúde em 2024[2]Fonte: Food and Beverage News, Estudo revela que a maioria dos indianos prioriza a nutrição em detrimento do sabor,
fnbnews.com . Este foco crescente na nutrição entre os consumidores indianos reforça a posição da gelatina como ingrediente essencial no mercado de alimentos e bebidas funcionais.
Mudança para Produtos com Rótulo Limpo e Enriquecidos em Proteínas
A procura de listas de ingredientes transparentes e de fortificação proteica está a aumentar a utilização de gelatina como ingrediente natural e reconhecível em substituição de alternativas sintéticas. As fontes de gelatina de base marinha estão a ganhar destaque, uma vez que satisfazem os requisitos dos consumidores por opções proteicas sustentáveis e religiosamente aceitáveis. O movimento do rótulo limpo alinha-se com a preferência tradicional indiana por ingredientes naturais, criando oportunidades para fornecedores que garantem rastreabilidade e controlo de qualidade nas suas cadeias de abastecimento. Os fabricantes estão a desenvolver produtos de gelatina com processamento mínimo e documentação de aprovisionamento transparente para satisfazer as expectativas dos consumidores. O Relatório de Snacks Saudáveis (2024) indica que 73% dos indianos examinam as listas de ingredientes e os valores nutricionais antes de adquirirem snacks processados, demonstrando uma mudança para hábitos de consumo de snacks mais saudáveis e informados[3]Fonte: Business Standard, 73% dos indianos leem as listas de ingredientes e o valor nutricional dos snacks: Relatório,
business-standard.com . Esta maior consciencialização dos consumidores está a impulsionar a incorporação de gelatina em formulações enriquecidas em proteínas e com rótulo limpo nos mercados alimentar e nutracêutico da Índia.
Utilização Substancial de Gelatina em Produtos Farmacêuticos
A expansão do setor farmacêutico da Índia, impulsionada pela procura interna e pelas oportunidades de exportação, cria uma procura consistente de gelatina para o fabrico de cápsulas e aplicações de administração de fármacos. O setor beneficia de esquemas governamentais de incentivos de produção vinculada que promovem o fabrico interno de IFA e reduzem a dependência de importações, apoiando o crescimento da procura de gelatina. Gujarat emergiu como o centro farmacêutico da Índia, com processos regulatórios eficientes e vantagens de infraestrutura, concentrando o consumo de gelatina em clusters geográficos onde os fabricantes farmacêuticos alcançam economias de escala. Os sistemas de administração de fármacos utilizam cada vez mais matrizes à base de gelatina para formulações de libertação controlada, expandindo-se para além das aplicações tradicionais de cápsulas para áreas terapêuticas especializadas. O enquadramento regulatório da Organização Central de Controlo de Normas de Medicamentos mantém padrões de qualidade que favorecem fornecedores de gelatina estabelecidos com capacidades de certificação de grau farmacêutico.
Análise de Impacto dos Condicionantes*
| Condicionante | (~) % de Impacto na Previsão de CAGR | Relevância Geográfica | Horizonte Temporal de Impacto |
|---|---|---|---|
| Ascensão de substitutos de hidrocoloides de base vegetal | -1.1% | Mercados urbanos, segmentos orientados para exportação | Curto prazo (≤ 2 anos) |
| Desafios regulatórios e de certificação | -0.7% | Nacional, particularmente mercados de exportação | Médio prazo (2-4 anos) |
| Volatilidade do abastecimento e dos preços de matéria-prima de osso bovino | -0.9% | Estados do norte e oeste com concentração pecuária | Curto prazo (≤ 2 anos) |
| Restrições religiosas/vegetarianas à origem animal | -0.6% | Nacional, variando por demografia regional | Longo prazo (≥ 4 anos) |
| Fonte: Mordor Intelligence | |||
Ascensão de Substitutos de Hidrocoloides de Base Vegetal
As alternativas de base vegetal, incluindo ágar-ágar, carragenina e pectina, desafiam cada vez mais a posição de mercado da gelatina, particularmente nos segmentos conscientes do vegetarianismo e nos mercados de exportação com mandatos de sustentabilidade. A investigação técnica demonstra que a κ-carragenina combinada com a goma de alfarroba pode replicar as propriedades de gelificação da gelatina em aplicações específicas, embora persistam limitações na estabilidade térmica e nas características de textura. O desenvolvimento de formulações sofisticadas de base vegetal por tecnólogos alimentares cria alternativas viáveis para aplicações sensíveis ao preço, embora os segmentos premium continuem a preferir a gelatina pelas suas propriedades funcionais superiores. As campanhas de consciencialização dos consumidores por parte dos fornecedores de ingredientes de base vegetal enfatizam as vantagens ambientais e éticas, influenciando as decisões de compra nos mercados urbanos onde as preocupações com a sustentabilidade orientam a seleção de produtos. No entanto, as alternativas de base vegetal enfrentam os seus próprios condicionamentos na cadeia de abastecimento e volatilidade de preços, limitando a sua capacidade de deslocar completamente a gelatina nas aplicações sensíveis ao preço.
Desafios Regulatórios e de Certificação
Os requisitos regulatórios em múltiplas jurisdições criam desafios de conformidade, afetando particularmente os fabricantes de gelatina de menor dimensão e limitando a entrada no mercado. As normas de segurança alimentar da FSSAI requerem investimento contínuo em sistemas de qualidade e documentação. Os mercados de exportação requerem certificações adicionais, incluindo credenciais halal, kosher e orgânicas, aumentando a complexidade operacional. A implementação da certificação halal obrigatória para exportações de produtos de carne para 15 países através do Esquema de Avaliação de Conformidade da Índia aumentou os custos de conformidade e alargou os prazos para os exportadores de gelatina. Os regulamentos da FSSAI exigem o registo de instalações estrangeiras, acrescentando requisitos administrativos para fornecedores internacionais, enquanto os fabricantes nacionais enfrentam maior escrutínio das normas de aprovisionamento de matérias-primas e de processamento. Estes requisitos regulatórios beneficiam as empresas maiores e estabelecidas com recursos dedicados à conformidade, criando simultaneamente barreiras à entrada para novos concorrentes.
*Nossas previsões tratam os impactos dos impulsionadores e restrições como direcionais, e não aditivos. As previsões de impacto refletem o crescimento de base, os efeitos de composição e as interações entre variáveis.
Análise de Segmentos
Por Fonte: As Alternativas Marinhas Ganham Terreno
A gelatina de base marinha demonstra um potencial de crescimento significativo com uma CAGR de 7,70% até 2031, apesar de deter uma quota de mercado menor. Este crescimento resulta das preferências alimentares religiosas e dos benefícios para a saúde em comparação com as alternativas de base animal. A expansão da indústria de aquacultura costeira da Índia e a melhoria das capacidades de processamento de peixe fornecem subprodutos ricos em colagénio para extração de gelatina. A gelatina de base animal mantém a dominância de mercado com uma quota de 79,55% em 2025, apoiada por cadeias de abastecimento estabelecidas e pela extensa infraestrutura de processamento pecuário da Índia. O segmento beneficia da posição da Índia como principal exportador de carne bovina e produtor de laticínios, garantindo um abastecimento estável de matéria-prima bovina.
Os avanços tecnológicos no processamento melhoraram a resistência do gel e a estabilidade térmica da gelatina marinha, alargando as suas aplicações. A Autoridade de Segurança Alimentar e Normas da Índia (FSSAI) fornece supervisão regulatória através de normas estabelecidas para a pureza e segurança da gelatina, com requisitos adicionais para fontes marinhas relativamente à contaminação por metais pesados e rastreabilidade. As iniciativas governamentais de apoio ao desenvolvimento da economia azul e à gestão sustentável das pescas contribuem para o crescimento do setor de gelatina marinha, melhorando a qualidade e disponibilidade de matérias-primas.
Nota: As quotas de segmento de todos os segmentos individuais estão disponíveis com a compra do relatório


Por Grau: As Aplicações Farmacêuticas Impulsionam o Crescimento Premium
A gelatina de grau alimentar detém uma quota de mercado de 55,05% em 2025, mantendo a sua posição dominante nos setores de confeitaria, laticínios e alimentos processados em expansão na Índia. O crescimento deste segmento alinha-se com o desenvolvimento da indústria de processamento de alimentos do país, apoiado por esquemas governamentais de incentivos de produção vinculada que promovem o fabrico nacional e reduzem a dependência de importações. O segmento de grau farmacêutico, embora menor em volume, demonstra um crescimento mais elevado a uma CAGR de 7,82%. Este crescimento resulta da posição da Índia como um centro global de fabrico farmacêutico e do aumento do consumo interno de cuidados de saúde.
As aplicações farmacêuticas incluem o fabrico tradicional de cápsulas e sistemas avançados de administração de fármacos, como formulações de libertação prolongada e aplicações terapêuticas direcionadas. O segmento farmacêutico beneficia do cluster farmacêutico de Gujarat, que oferece processos regulatórios simplificados e infraestrutura desenvolvida, reduzindo os custos e os prazos de fabrico. Os elevados requisitos de capital para instalações de sala limpa e sistemas de controlo de qualidade criam barreiras de entrada significativas, ajudando os fornecedores estabelecidos a manter as suas posições de mercado.
Por Utilizador Final: Os Suplementos Alimentares Emergem como Motor de Crescimento
As aplicações de alimentos e bebidas detêm uma quota de mercado dominante de 44,68% em 2025, impulsionadas pela utilização generalizada de gelatina no fabrico de confeitaria, texturização de produtos lácteos e aplicações de alimentos processados. Esta posição de mercado resulta da crescente indústria de processamento de alimentos da Índia e do aumento da procura dos consumidores por alimentos de conveniência e produtos de confeitaria. O segmento de cuidados pessoais e cosméticos apresenta um crescimento significativo devido à adoção crescente de produtos antienvelhecimento para a pele e formulações de beleza contendo ingredientes derivados do colagénio pelos consumidores.
O segmento de suplementos alimentares exibe a taxa de crescimento mais elevada a uma CAGR de 8,06%, apoiado pelas tendências de bem-estar da Índia e pelos regulamentos nutracêuticos da FSSAI. Esta expansão reflete o maior foco dos consumidores nos cuidados de saúde preventivos e na suplementação nutricional, particularmente nas áreas urbanas com rendimentos disponíveis mais elevados. O segmento farmacêutico continua a crescer de forma constante, apoiado pela expansão da indústria de fabrico de medicamentos genéricos da Índia e pelo aumento do consumo de cuidados de saúde devido ao envelhecimento da população e ao aumento dos casos de doenças crónicas.
Nota: As quotas de segmento de todos os segmentos individuais estão disponíveis com a compra do relatório
Análise Geográfica
O mercado de gelatina da Índia demonstra padrões distintos de concentração regional alinhados com os centros de processamento de alimentos e fabrico farmacêutico. Gujarat lidera a produção, apoiado pelo seu estabelecido cluster da indústria farmacêutica, enquadramento regulatório favorável e infraestrutura logística eficiente. A localização estratégica do estado próximo dos principais portos facilita tanto a distribuição interna como as operações de exportação. Maharashtra e Tamil Nadu servem como principais centros de consumo devido às suas extensas indústrias de processamento de alimentos e mercados urbanos que exigem produtos de confeitaria de alta qualidade e alimentos funcionais. Estes estados aproveitam as suas instalações de processamento de laticínios existentes, infraestrutura de cadeia de frio e localização estratégica próxima dos principais centros de consumo para minimizar os custos de distribuição e garantir uma resposta rápida ao mercado.
Os estados do norte, particularmente Punjab e Haryana, fornecem matéria-prima significativa através das suas indústrias de processamento pecuário e do setor bem desenvolvido de criação de animais, embora a sua capacidade de fabrico de gelatina permaneça menor em comparação com as regiões ocidentais e meridionais. As relações comerciais internacionais em expansão da Índia criam oportunidades de crescimento, especialmente para produtos com certificação halal nos mercados do Médio Oriente e do Sudeste Asiático. A implementação de requisitos obrigatórios de certificação halal para exportações para 15 países através do Esquema de Avaliação de Conformidade da Índia estabelece requisitos de conformidade específicos, ao mesmo tempo que permite um posicionamento premium no mercado. Este processo de certificação envolve medidas rigorosas de controlo de qualidade, requisitos de documentação e auditorias regulares por organismos de certificação autorizados.
As políticas governamentais de apoio aos princípios da economia circular e à valorização de resíduos de carne incentivam a expansão da capacidade e o avanço tecnológico em todas as regiões. Estas iniciativas incluem incentivos financeiros para a redução de resíduos, apoio à investigação e desenvolvimento para tecnologias de processamento e subsídios para o desenvolvimento de infraestruturas, embora a eficácia da implementação varie consoante a infraestrutura industrial local e as capacidades regulatórias.
Panorama Competitivo
O mercado de gelatina indiano demonstra consolidação moderada, com empresas estabelecidas a deter posições de mercado substanciais enquanto acomodam concorrentes especializados e novas tecnologias. Os líderes de mercado implementam estratégias de integração vertical, controlando o aprovisionamento de matérias-primas através de operações de processamento pecuário e mantendo ligações a jusante através de parcerias com a indústria farmacêutica e alimentar.
Esta integração oferece benefícios de custo e fiabilidade da cadeia de abastecimento que os concorrentes de menor dimensão encontram dificuldade em igualar sem investimentos de capital significativos. As empresas priorizam a adoção de tecnologia e a expansão de capacidade, investindo em equipamentos de processamento avançados e sistemas de controlo de qualidade para cumprir os requisitos de grau farmacêutico e as normas dos mercados de exportação.
O mercado apresenta oportunidades de crescimento significativas na produção de gelatina marinha, péptidos de colagénio premium e aplicações farmacêuticas especializadas, onde a especialização técnica e a conformidade regulatória criam vantagens competitivas. Os novos participantes no mercado concentram-se em práticas de aprovisionamento sustentável, sistemas de rastreabilidade abrangentes e tecnologias de proteínas alternativas para satisfazer eficazmente a crescente procura dos consumidores conscientes do ambiente e dos mercados de exportação com requisitos rigorosos de sustentabilidade.
Líderes do Setor de Gelatina da Índia
Foodchem International Corporation
India Gelatine & Chemicals Ltd
Jellice Group
Nitta Gelatin Inc.
Sterling Gelatin (Godrej)
- *Isenção de responsabilidade: Principais participantes classificados em nenhuma ordem específica

Desenvolvimentos Recentes do Setor
- Julho de 2025: A Nitta Gelatin India Ltd (NGIL), uma joint venture entre a Nitta Gelatin Inc. do Japão e a Kerala State Industrial Development Corporation, iniciou uma expansão de ₹60 crore nas suas instalações em Kakkanad, Kochi. O projeto, parte de um investimento mais amplo de ₹200 crore no Kerala, inclui a construção de uma unidade de péptidos de colagénio, uma unidade de fabrico de gelatina e uma sede corporativa em Kakkanad para reforçar as capacidades de fabrico da NGIL.
- Junho de 2023: A Pioneer Jellice India Pvt Ltd (uma joint venture entre o Pioneer Asia Group de Sivakasi e a Jellice do Japão) e a Ashok Matches & Timbers concluíram a aquisição da Narmada Gelatines Ltd em duas fases. Através desta aquisição, os promotores com sede em Sivakasi obtiveram a propriedade total da Narmada Gelatines, fabricante de gelatinas para aplicações farmacêuticas, alimentares, industriais e fotográficas, bem como de fosfato dicálcico.
- Março de 2023: A GELITA introduziu a CONFIXX®, uma formulação de gelatina sem amido que acelera a produção de gomas fortificadas. O produto permite uma gelificação rápida a baixas temperaturas, reduzindo o tempo de produção de dois dias para várias horas, mantendo a textura de goma desejada. A CONFIXX® elimina a necessidade de moldes de amido, preparação e etapas de secagem, o que reduz os requisitos de espaço, o consumo de energia e os riscos de contaminação entre lotes de produção.


Âmbito do Relatório do Mercado de Gelatina da Índia
A gelatina é um produto de origem animal e um ingrediente comum em sopas, caldos, molhos, rebuçados gomosos, marshmallows, cosméticos e medicamentos.
O mercado de gelatina indiano é segmentado por forma como de base animal e de base marinha. Por utilizadores finais, como cuidados pessoais e cosméticos e alimentos e bebidas; os alimentos e bebidas são sub-segmentados em produtos de panificação, bebidas, condimentos/molhos, confeitaria, laticínios e produtos alternativos aos laticínios, produtos alimentares prontos a comer/prontos a cozinhar e snacks.
Para cada segmento, o relatório oferece a dimensão do mercado em termos de valor em USD e em termos de volume em toneladas para todos os segmentos acima mencionados.
| Base Animal |
| Base Marinha |
| Grau Alimentar |
| Grau Farmacêutico |
| Cuidados Pessoais e Cosméticos | |
| Alimentos e Bebidas | Panificação |
| Bebidas | |
| Confeitaria | |
| Laticínios e Alternativas aos Laticínios | |
| Produtos Alimentares Prontos a Comer/Prontos a Cozinhar | |
| Suplementos Alimentares | |
| Produtos Farmacêuticos | |
| Outros |
| Por Fonte | Base Animal | |
| Base Marinha | ||
| Por Grau | Grau Alimentar | |
| Grau Farmacêutico | ||
| Por Utilizador Final | Cuidados Pessoais e Cosméticos | |
| Alimentos e Bebidas | Panificação | |
| Bebidas | ||
| Confeitaria | ||
| Laticínios e Alternativas aos Laticínios | ||
| Produtos Alimentares Prontos a Comer/Prontos a Cozinhar | ||
| Suplementos Alimentares | ||
| Produtos Farmacêuticos | ||
| Outros | ||


Principais Questões Respondidas no Relatório
Qual é a dimensão do mercado de gelatina na Índia em 2026?
A dimensão do mercado de gelatina é de USD 307,97 milhões em 2026 e está projetada para atingir USD 438,03 milhões até 2031.
Qual é o segmento de fonte com crescimento mais rápido?
A gelatina de base marinha está prevista para expandir a uma CAGR de 7,70% devido à neutralidade religiosa e ao apelo da sustentabilidade.
Qual é o grau com a CAGR mais elevada esperada?
A gelatina de grau farmacêutico está projetada a uma CAGR de 7,82%, apoiada pela expansão do fabrico de medicamentos genéricos na Índia.
Qual é o utilizador final que impulsiona o crescimento da procura mais rápido?
Os suplementos alimentares lideram com uma CAGR de 8,06% à medida que os gastos em bem-estar aceleram.
Página atualizada pela última vez em:


