
Energy & Power
30th JulyUnlocking Market Potential for Solid-State Transformers
3 Min Read
The Subsea Power Grid System Market Report is Segmented by Component (Cables, Variable-Speed Drives, and More), Power-Generation Source (Captive Generation, Offshore Wind, and More), Installation Depth (Shallow, Deepwater, and Ultra-Deep), Voltage Rating (Medium, High, and Extra-High), End-User Industry (Oil and Gas Upstream, Offshore Wind Farm Developers, and More), and Geography (North America, Europe, Asia-Pacific, and More).
Market Overview
| Study Period | 2021 - 2031 |
|---|---|
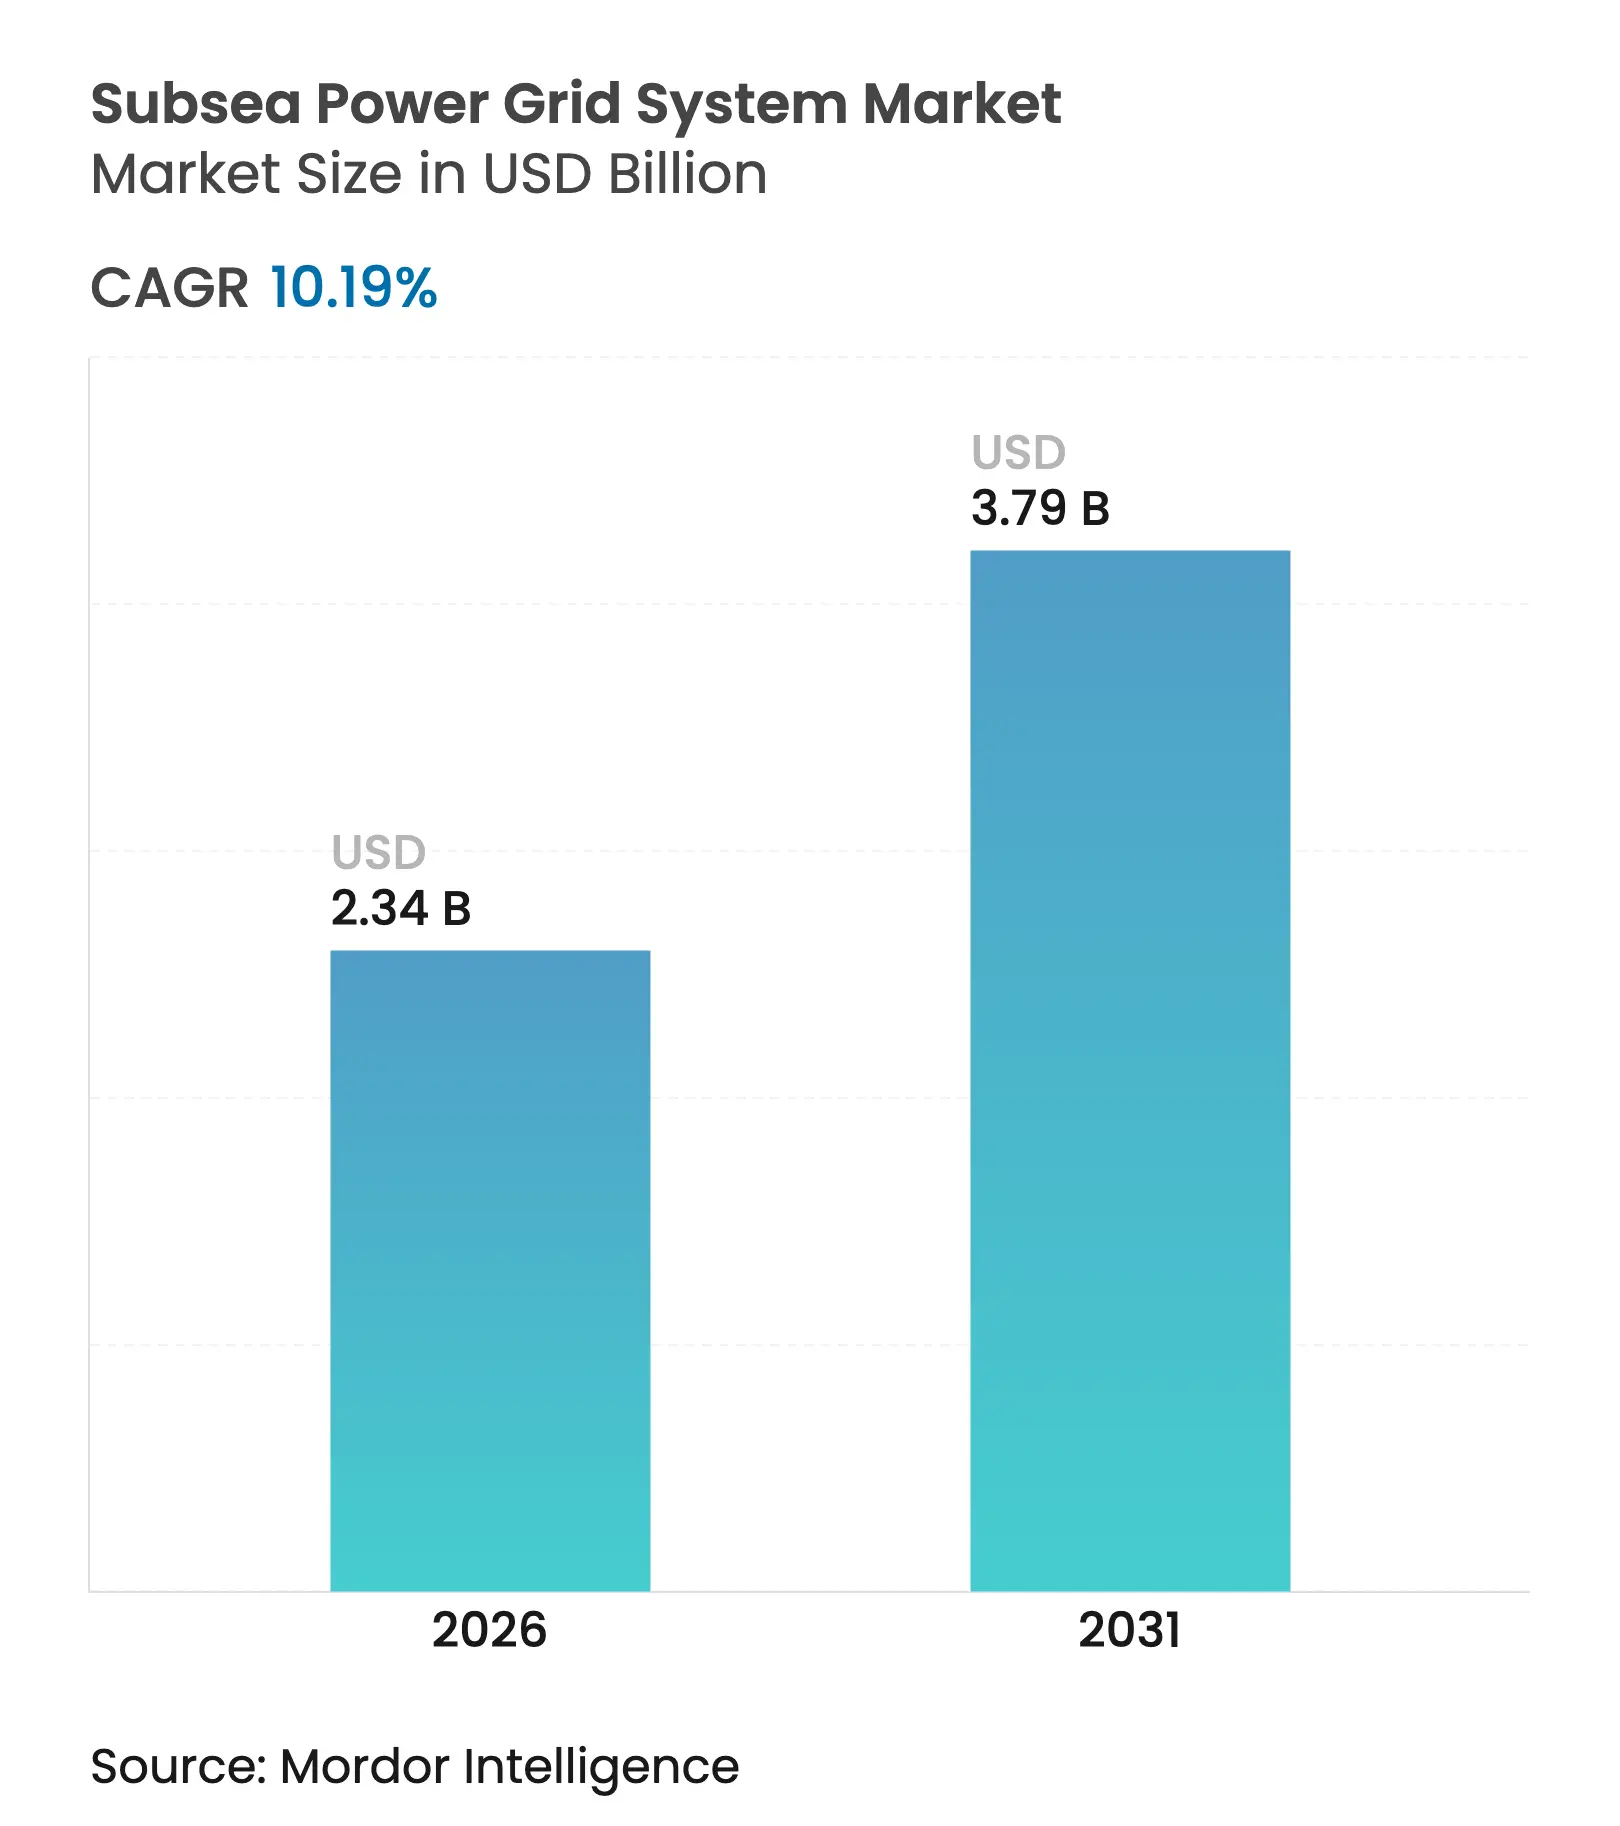
| Market Size (2026) | USD 2.34 Billion |
| Market Size (2031) | USD 3.79 Billion |
| Growth Rate (2026 - 2031) | 10.19 % CAGR |
| Fastest Growing Market | Asia Pacific |
| Largest Market | Europe |
| Market Concentration | Medium |
Major Players *Disclaimer: Major Players sorted in no particular order. Image © Mordor Intelligence. Reuse requires attribution under CC BY 4.0. |
The accelerating electrification of offshore assets drives robust growth, the large-scale development of floating wind farms, and government-backed grid-hardening initiatives. Operators pursuing lower Scope 1 emissions are shifting away from onboard generation toward grid-connected solutions, while Europe’s offshore wind licensing rounds and the Asia-Pacific region’s manufacturing scale bring new capacity online at a rapid clip. Deepwater renewable projects beyond 60 m are unlocking previously untapped wind resources, and modular wet-mate switchgear is lowering installation costs, broadening the addressable customer base. At the same time, cable suppliers and integrated system providers are racing to engineer extra-high-voltage configurations that minimise line losses across 300 km-plus corridors. Although raw material price swings and vessel bottlenecks impose near-term cost pressure, technological innovation and policy support maintain a firmly positive medium-term outlook for the subsea power grid system market.
Key Report Takeaways
Drivers Impact Analysis
| Driver | (~) % Impact on CAGR Forecast | Geographic Relevance | Impact Timeline | |||
|---|---|---|---|---|---|---|
Surging offshore wind-farm HVDC export-cable demand Surging offshore wind-farm HVDC export-cable demand | 2.80% | Europe, North America, Asia-Pacific | Medium term (2-4 years) | (~) % Impact on CAGR Forecast:2.80% | Geographic Relevance:Europe, North America, Asia-Pacific | Impact Timeline:Medium term (2-4 years) |
Electrification of offshore O&G platforms to cut Scope-1 CO₂ Electrification of offshore O&G platforms to cut Scope-1 CO₂ | 2.10% | Global, concentration in North Sea & Gulf of Mexico | Short term (≤ 2 years) | |||
Floating wind build-out unlocking >60 m water depths Floating wind build-out unlocking >60 m water depths | 1.90% | Europe, Asia-Pacific, selected North American coasts | Long term (≥ 4 years) | |||
Deep-sea mineral extraction pilots requiring MW-scale power Deep-sea mineral extraction pilots requiring MW-scale power | 1.40% | Pacific Ocean with Atlantic spill-over | Long term (≥ 4 years) | |||
EU-U.S. grid-hardening funds for cross-border interconnectors EU-U.S. grid-hardening funds for cross-border interconnectors | 1.60% | North America & EU; allied nations | Medium term (2-4 years) | |||
Modular wet-mate switchgear lowering installation OPEX Modular wet-mate switchgear lowering installation OPEX | 1.20% | Global; early adoption in mature offshore markets | Short term (≤ 2 years) | |||
| Source: Mordor Intelligence | ||||||
Surging Offshore Wind-Farm HVDC Export-Cable Demand
Offshore wind projects scaling above 1 GW are adopting HVDC export corridors, propelling record demand for 500 kV subsea cables that transmit larger loads over longer distances with lower line losses.[1]VicGrid, “Gippsland Offshore Wind Transmission Project,” windpowermonthly.com European utilities, such as those pioneering 2 GW clusters like the Dunkerque development in France, are issuing multi-year tenders for bundled cable, transformer, and protection packages. Asian developers are replicating the model as floating wind opens deeper sites that lie 100 km or more from landfall. Procurement teams now value integrated system performance over component pricing, a shift benefiting vendors able to combine extra-high-voltage cables with digital monitoring, real-time fault detection, and robotic repair solutions. The result is a virtuous cycle in which export cable demand spurs innovation in subsea switchgear, wet-mate connectors, and intelligent asset management platforms—all of which expand the subsea power grid system market.
Electrification of Offshore O&G Platforms to Cut Scope-1 CO₂
Global energy majors are replacing onboard gas turbines with grid-supplied electricity, reducing platform emissions by up to 80% while trimming fuel logistics costs.[2]Equinor, “Power from Shore Fact Sheet,” equinor.com Grid-tied platforms need subsea step-down transformers, variable-frequency drives, and redundancy schemes that safeguard power quality during transient events. All-electric production systems extend the trend beyond topsides into subsea wellheads, where electric actuators and sensors deliver real-time control and reduce hydraulic fluid leaks. OEMs, such as Baker Hughes, now offer retrofit kits that integrate seamlessly into brownfield assets, eliminating the need for new umbilicals and thereby shortening payback timelines. As regulators tighten carbon-pricing regimes, the business case for the subsea power grid system market strengthens, reinforcing its prospects for double-digit growth.[3]Baker Hughes, “All-Electric Subsea Systems,” bakerhughes.com
Floating Wind Build-Out Unlocking Over 60 m Water Depths
Floating foundations shift turbine siting from continental shelves to high-yield wind corridors farther offshore, demanding dynamic export and inter-array cables that flex continuously yet handle currents above 1 kA. Insurance data shows that cable faults constitute 80% of offshore wind claims, a figure that intensifies the engineering spotlight on fatigue life, temperature stability, and corrosion-resistant armour. To manage motion-induced loads, system designers combine composite armouring with distributed fibre-optic sensing that detects hotspot formation before insulation breakdown. These improvements reduce unplanned outages, strengthen lender confidence, and unlock fresh investment pools for the subsea power grid system market.
Deep-Sea Mineral Extraction Pilots Requiring MW-Scale Subsea Power
Pilot dredging equipment operating at 4,000 m in the Clarion–Clipperton Zone relies on 6 MW floating substations and stepped-down distribution to crawler vehicles. High-pressure housings, silicon-carbide power electronics, and redundant cooling circuits are being tested to ensure 10-year service intervals. Success would open an entirely new customer segment, deep-sea mining, that demands ruggedised components and continuous-duty ratings, adding incremental volume to the subsea power grid system market over the long term.
Restraints Impact Analysis
| Restraint | (~) % Impact on CAGR Forecast | Geographic Relevance | Impact Timeline | |||
|---|---|---|---|---|---|---|
XLPE & copper price volatility inflating EPC costs XLPE & copper price volatility inflating EPC costs | -1.80% | Global; acute in high-volume markets | Short term (≤ 2 years) | (~) % Impact on CAGR Forecast:-1.80% | Geographic Relevance:Global; acute in high-volume markets | Impact Timeline:Short term (≤ 2 years) |
Cable-lay vessel bottlenecks from 2029 onward Cable-lay vessel bottlenecks from 2029 onward | -2.10% | Global; strongest in North Sea & Asia-Pacific | Medium term (2-4 years) | |||
Reliability gaps in dynamic inter-array cables >1 kA Reliability gaps in dynamic inter-array cables >1 kA | -1.40% | Europe, North America offshore wind regions | Medium term (2-4 years) | |||
Permitting delays for ≥320 kV export corridors Permitting delays for ≥320 kV export corridors | -1.20% | Europe & North America; repercussions worldwide | Long term (≥ 4 years) | |||
| Source: Mordor Intelligence | ||||||
XLPE & Copper Price Volatility Inflating EPC Costs
Copper and XLPE collectively account for more than 50% of a 400 kV export cable’s material bill. A USD 1,000/tonne swing in copper prices can distort project economics long before financial close. Cable makers hedge futures yet typically pass residual risk through escalation clauses, shifting uncertainty onto developers. When price spikes coincide with FX swings, early-stage projects stall, pressuring the subsea power grid system market pipeline.[4]London Metal Exchange, “Copper Price Dashboard,” lme.com
Cable-Lay Vessel Bottlenecks from 2029 Onward
Global order books for next-generation DP3 cable-lay vessels are thin relative to 2030 installation targets. New builds require 36 months and USD 250 million in capital expenditures, lengthening the supply gap. The crunch is most acute during summer weather windows in the North Sea, where day-rates already exceed USD 220,000. Project stacking could delay grid connections, compressing revenue streams and tempering near-term growth in the subsea power grid system market.
By Component: Cables Dominate Amid Drive Innovation
Cables contributed 54.45% of 2025 revenue, translating to USD 1.15 billion of the subsea power grid system market size. Variable-speed drives, despite having a smaller base, are expected to rise at a 12.08% CAGR as operators seek intelligent load balancing and energy-efficient boosting. Subsea transformers secure mid-teen share given the pivot to higher voltage classes, whereas modular switchgear registers double-digit growth thanks to wet-mate architectures.
Technological momentum centers on high-voltage, high-current polymeric insulation, real-time temperature monitoring fibers, and robot-ready terminations that reduce repair time. Vendors bundling hardware with digital twin capture service contracts may secure contracts that outlast the warranty period, thereby buttressing recurring revenue. As new projects specify predictive maintenance in their tender documents, component integration depth, rather than unit count, will determine future leadership within the subsea power grid system market.
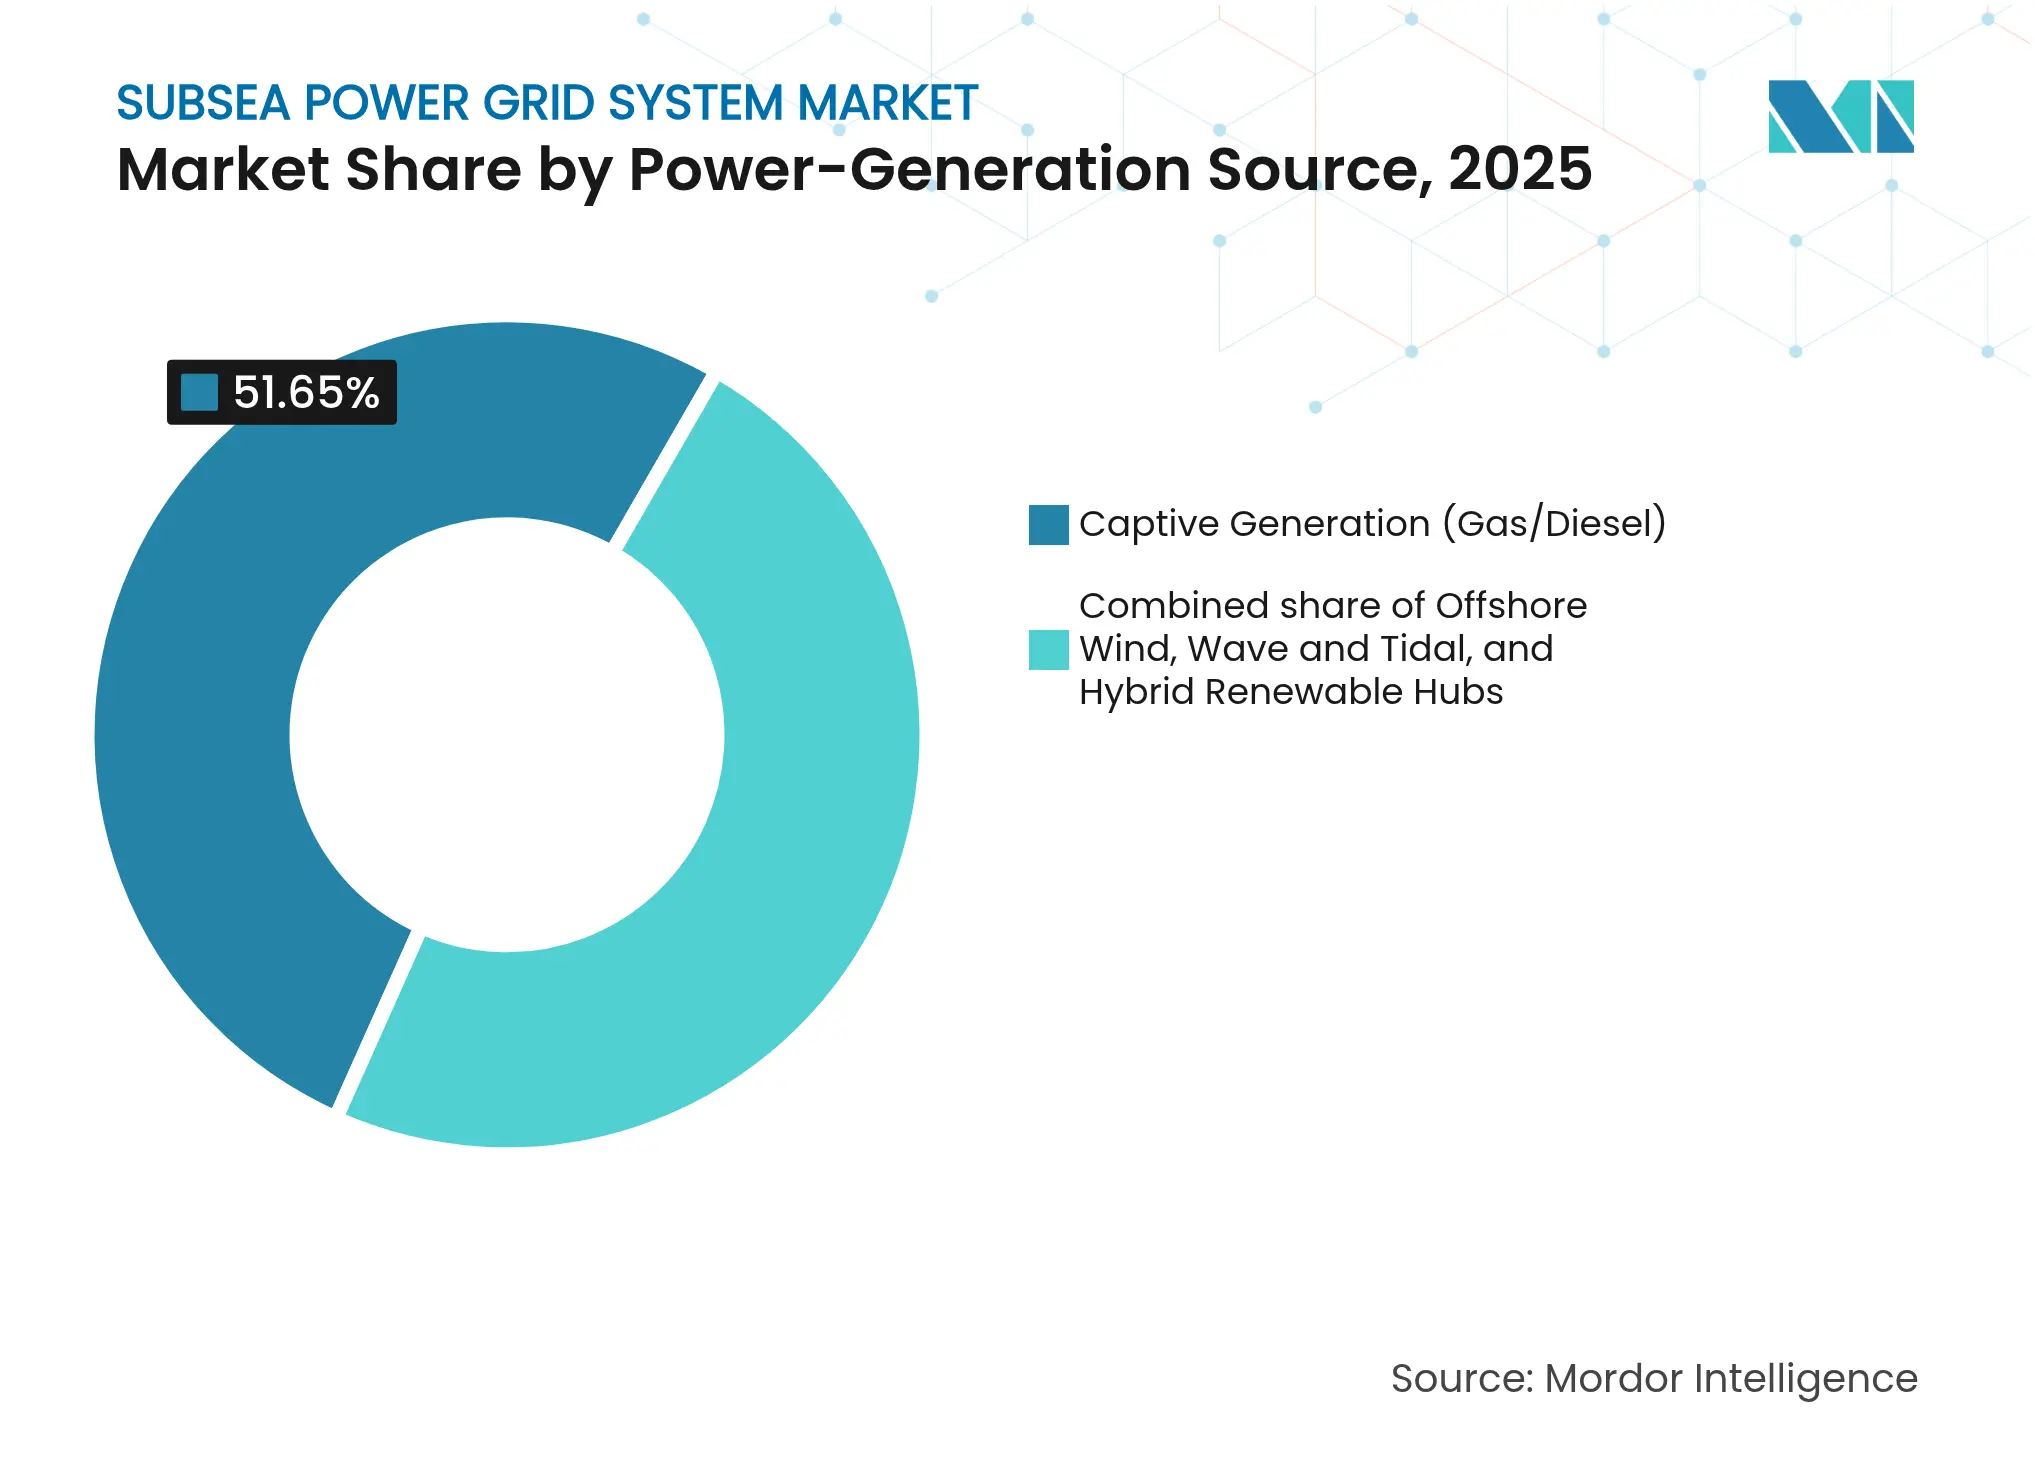
By Power-Generation Source: Wind Disrupts Gas Dominance
Captive gas-fired turbines retained a 51.65% share of the 2025 spend, yet their role is pivoting from baseload to reserve capacity. Offshore wind’s 13.55% CAGR through 2031 elevates renewables to near-parity by the end of the decade. Early-stage tidal arrays and wave prototypes draw modest capital today, but hybrid renewable hubs that blend floating wind, tidal streams, and batteries are emerging testbeds.
System planners, therefore, need multi-source synchronisation, inertia emulation, and fault-ride-through algorithms embedded at the subsea node. The interplay of intermittent wind and dispatchable gas under one control layer creates new requirements for dynamic reactive power compensation. Suppliers offering end-to-end energy management will be pivotal in preserving grid stability as the subsea power grid system market transitions to a low-carbon generation mix.
Note: Segment shares of all individual segments available upon report purchase
By Installation Depth: Deepwater Gains Despite Shallow Dominance
Shallow installations, those below 100 m, still reap economies of scale, accounting for more than half of the 2025 subsea power grid system market size. Deepwater (100-1,000 m) projects are expected to add USD 592 million of incremental value by 2031, representing the fastest absolute growth among depth tiers. Key drivers include floating wind and long-distance HVDC interconnectors that bypass coastal congestion.
Technical demands escalate sharply with the introduction of depth pressure-tolerant splice boxes, ferritic stainless-steel armor, and self-healing outer sheaths becoming standard. Installation spreads require heave-compensated tensioners and ROV-assisted touchdown monitoring. Expertise accumulated from Brazilian pre-salt and Norwegian Utsira High campaigns offers a knowledge transfer that deepens the competitive moat for incumbent deepwater contractors in the subsea power grid system market.
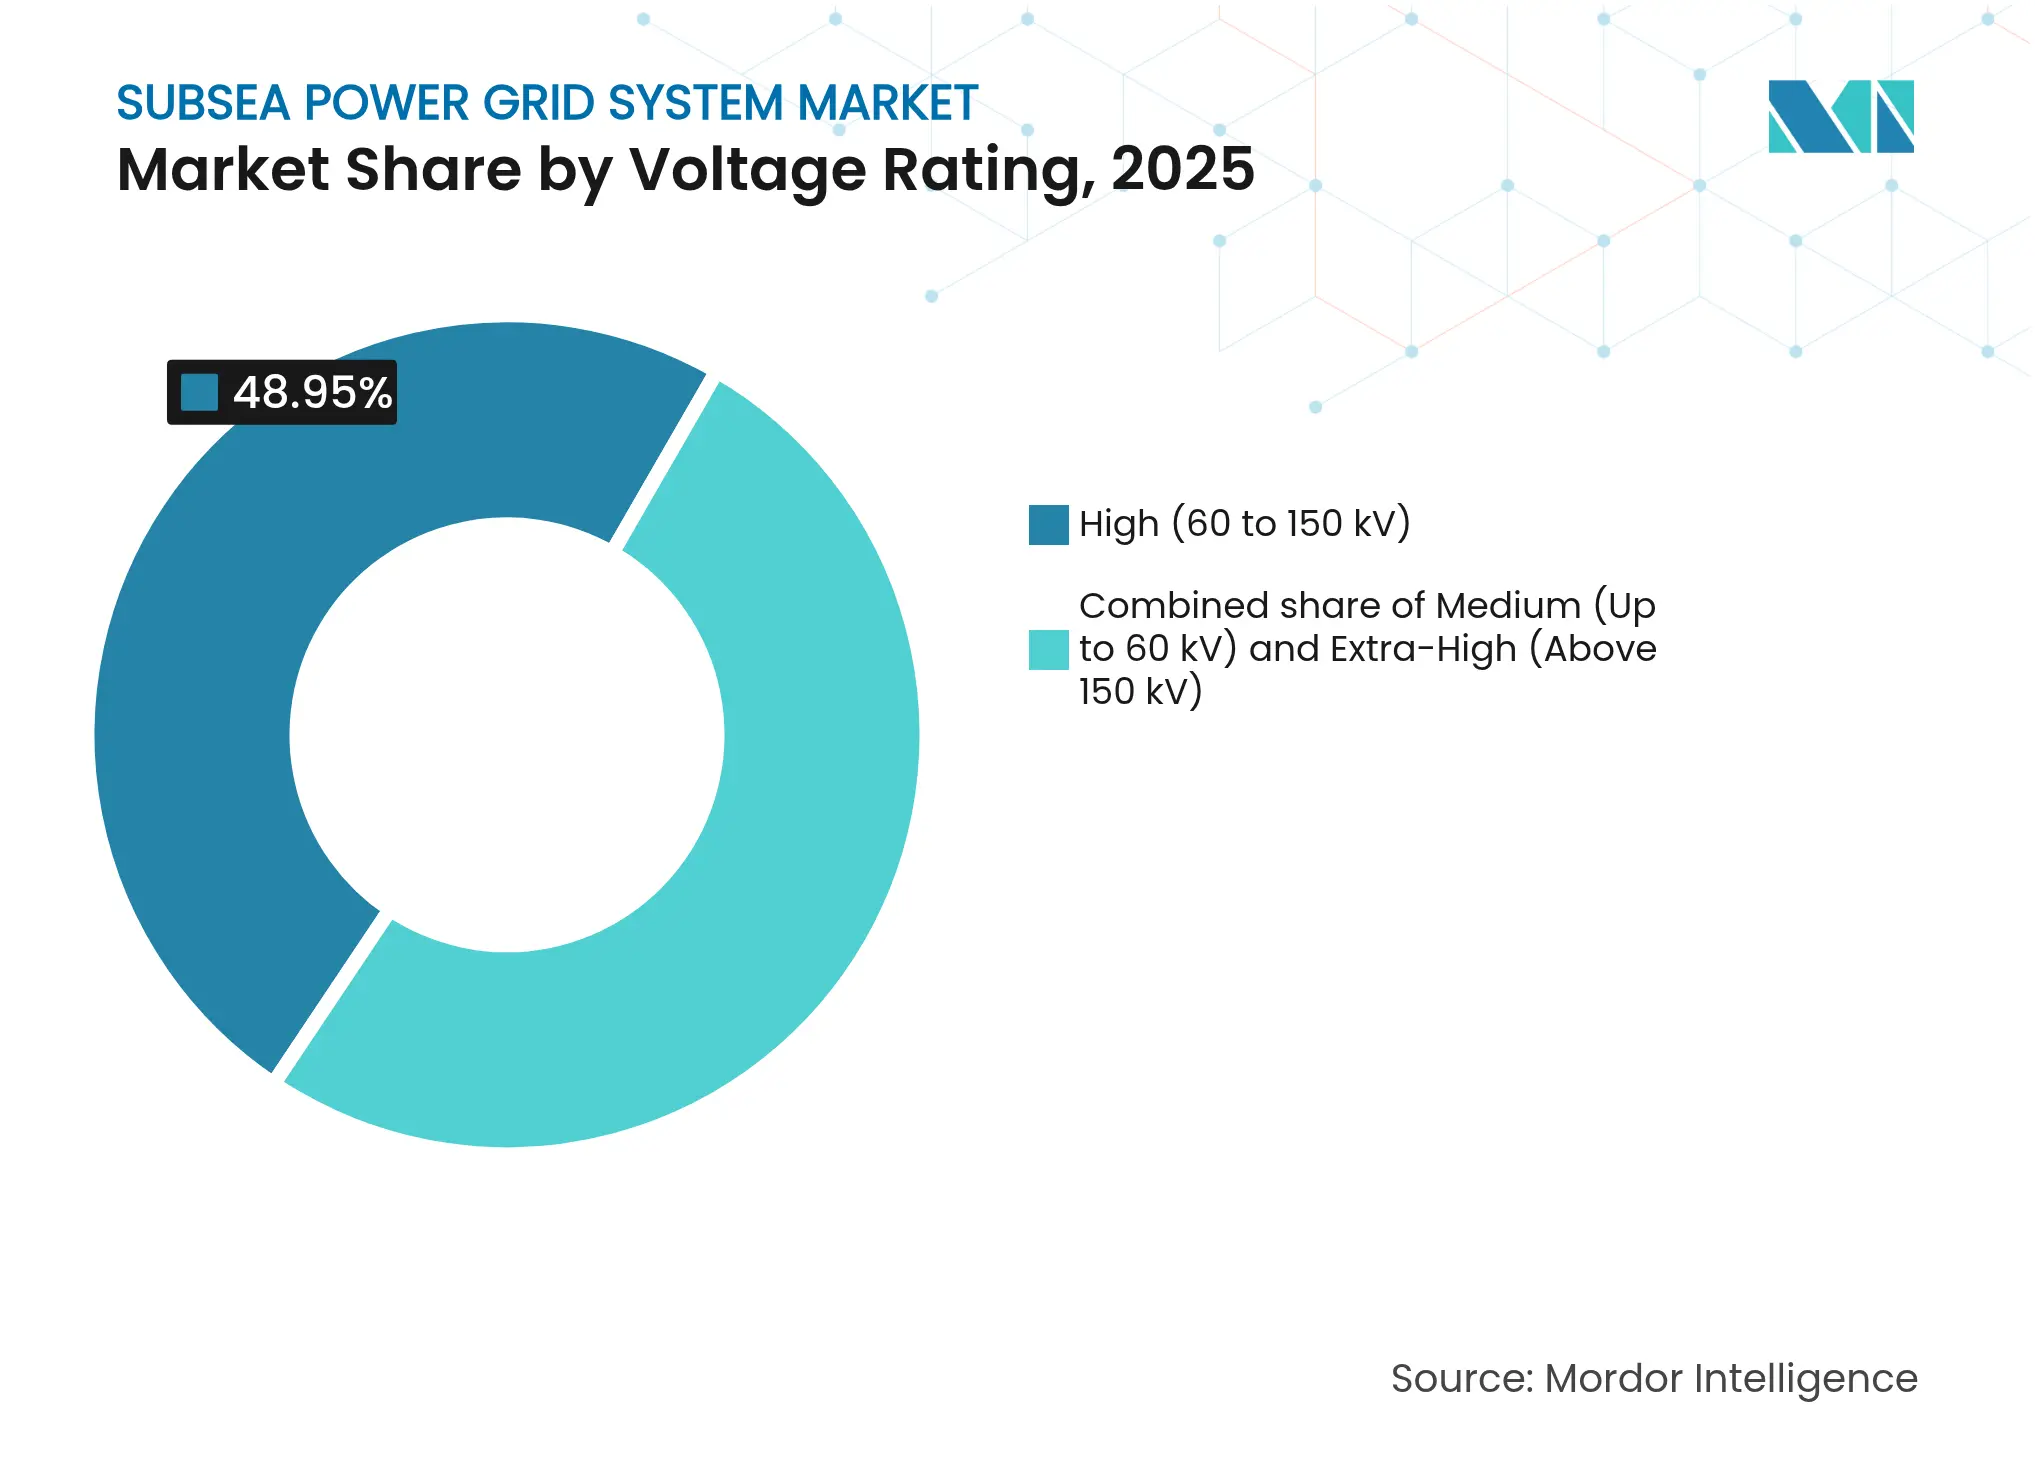
By Voltage Rating: Extra-High Voltage Accelerates Grid Evolution
Systems in the 60-150 kV band generated nearly half of the 2025 turnover; yet, the move to extra-high-voltage (above 150 kV) unlocks transmission optimisation at a continental scale. The 500 kV Sea Link selection proves that every 100 kV increment reduces resistive losses and increases delivered capacity, a cost-benefit that favors bulk wind exports.
Component design margins become tighter under higher electric field stresses, driving the adoption of nano-filled XLPE, gas-insulated switchgear, and condition-based monitoring. Manufacturers capable of repeatable factory-joint quality control will gain share as utilities specify partial-discharge-free performance. These trends reinforce the premium segment’s double-digit CAGR and push the subsea power grid system market toward technology intensification.
Note: Segment shares of all individual segments available upon report purchase
By End-user Industry: Wind Developers Challenge O&G Leadership
Oil and gas upstream clients spent USD 0.96 billion in 2025; however, wind developers are expected to close the gap within five years, driven by multi-gigawatt lease awards. Marine renewables, deep-sea mining, and defence collectively remain below 10%, but pilot demonstrations foreshadow step-out orders once reliability hurdles are cleared.
Customer diversification mitigates the cyclical swings traditionally linked to oil prices, providing the subsea power grid system market with a more balanced demand profile. Nevertheless, each user segment has unique technical requirements: explosive-atmosphere certification for oil and gas, cost-per-MWh thresholds for wind, and extreme-depth robustness for mining. Integrators must therefore tailor reference designs while preserving supply-chain leverage to stay competitive.
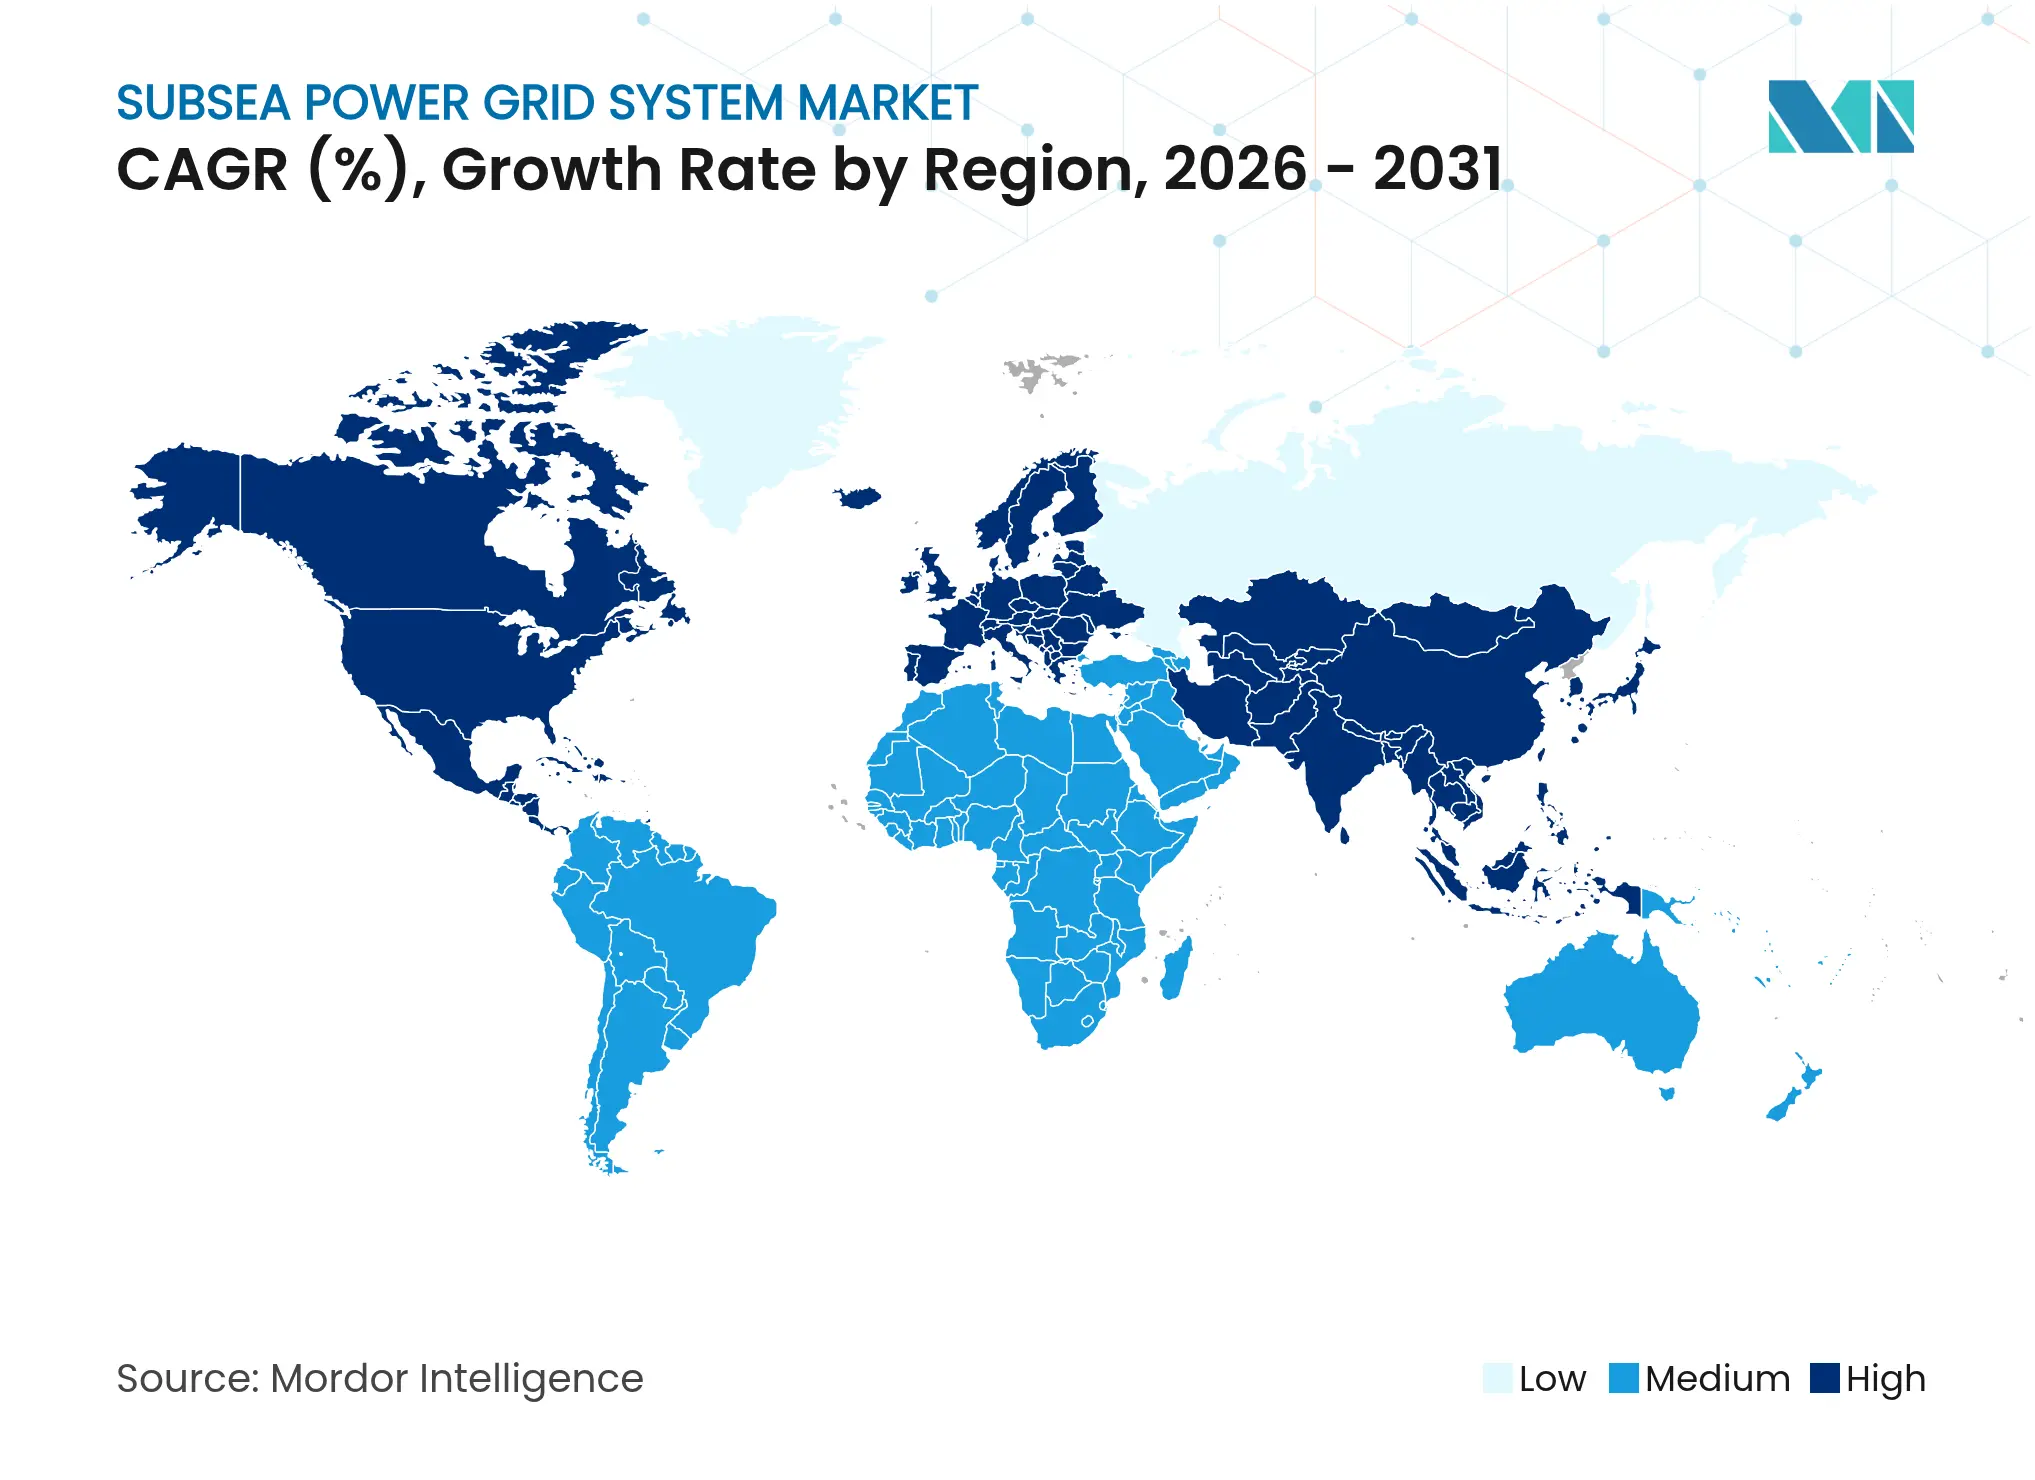
Europe accounted for 40.12% of 2025 revenue, driven by the North Sea’s mature supply chain, supportive policies, and continuous wind lease auctions. Germany’s 550 km SuedLink DC4 and the United Kingdom’s 2 GW Sea Link underscore the region’s appetite for grid reinforcement that underpins decarbonisation targets for 2030 and 2045, respectively. Cross-border connectors, such as Greenlink, Viking, and NeuConnect, further extend inter-regional balancing, compelling the procurement of higher-voltage, lighter-weight export cables. As Europe exhausts shallow siting areas, floating pilots off Spain, France, and Norway will escalate demand for dynamic cables, anchoring long-term growth in the subsea power grid system market.
The Asia-Pacific region is expected to post the fastest 12.78% CAGR through 2031, driven by China’s large-scale manufacturing and Australia’s Marinus Link HVDC project, which connects Tasmania with mainland renewable loads. Korea’s LS Cable & System expansion and Japanese-backed investments in Taiwanese offshore wind illustrate rising regional self-sufficiency. Government-mandated local-content quotas reshape tender evaluation, favouring joint ventures that combine European know-how with Asian cost optimisation. As coastal demand centres cluster in megacities, subsea cables offer congestion relief relative to land corridors, lifting the long-run addressable market.
North America benefits from a USD 2 billion federal grid-resilience program, eight commercial wind leases on the East Coast, and the 1,250 MW Champlain Hudson Power Express, which imports Canadian hydropower into New York City. Depths of 30–50 m allow fixed-bottom foundations, accelerating near-term installation, while California’s >900 m sites will push floating technology in the latter half of the decade. Cable-factory investments in South Carolina and Massachusetts shorten lead times, though Jones Act vessel restrictions still necessitate trans-Atlantic collaboration for installation. Collectively, these factors position North America as a USD 695 million opportunity within the subsea power grid system market by 2031.
Market Concentration
The market remains moderately concentrated, with the five leading suppliers collectively controlling an estimated 65% of the awarded backlog, resulting in a market concentration score of 6. Prysmian Group alone secured EUR 5 billion of German transmission awards, reinforcing scale advantages in both manufacturing throughput and engineering support. Baker Hughes leverages a 25% subsea tree installed base to cross-sell electrification upgrades, while Hitachi Energy anchors the converter station niche through HVDC reference projects such as DolWin1 and Marinus Link.
Competition is intensifying as Asian incumbents, including Taihan, LS Cable, and Sumitomo Electric, commission new 525 kV extrusion lines and court European EPC partners. Integrated packages that fuse cables, transformers, drives, and digital twins differentiate bids beyond price, particularly where utilities seek turnkey warranties. In response, Western suppliers are establishing joint ventures, co-funding vessel builds, and pursuing material substitutions to buffer copper price fluctuations.
Start-ups targeting dynamic cable fatigue life, composite armour, and autonomous inspection present acquisition targets for incumbents eager to de-risk novel segments such as floating wind and deep-sea mining. Patenting activity in smart-grid analytics rose 5.7% year-on-year in 2025, signalling sustained R&D spend despite macroeconomic headwinds. Over the forecast window, supply-chain resilience, installation productivity, and integrated asset-management software are likely to dictate share shifts within the subsea power grid system market.

*Disclaimer: Major Players sorted in no particular order
1. Introduction
2. Research Methodology
3. Executive Summary
4. Market Landscape
5. Market Size & Growth Forecasts
6. Competitive Landscape
7. Market Opportunities & Future Outlook
A network of power cables and related machinery used to transport and distribute electricity over a subsea area is known as a subsea power grid.
The Subsea Power Grid System Market is segmented by power generation type and geography. By power generation type, the market is segmented into captive generation, wind energy, and others. The report also covers the market size and forecasts for the subsea power grid system market across the major regions. For each segment, the market sizing and forecasts are based on the revenue (USD Billion).
Unlocking Market Potential for Solid-State Transformers
3 Min Read
When decisions matter, industry leaders turn to our analysts. Let’s talk.