Market Overview
| Study Period | 2021 - 2031 |
|---|---|
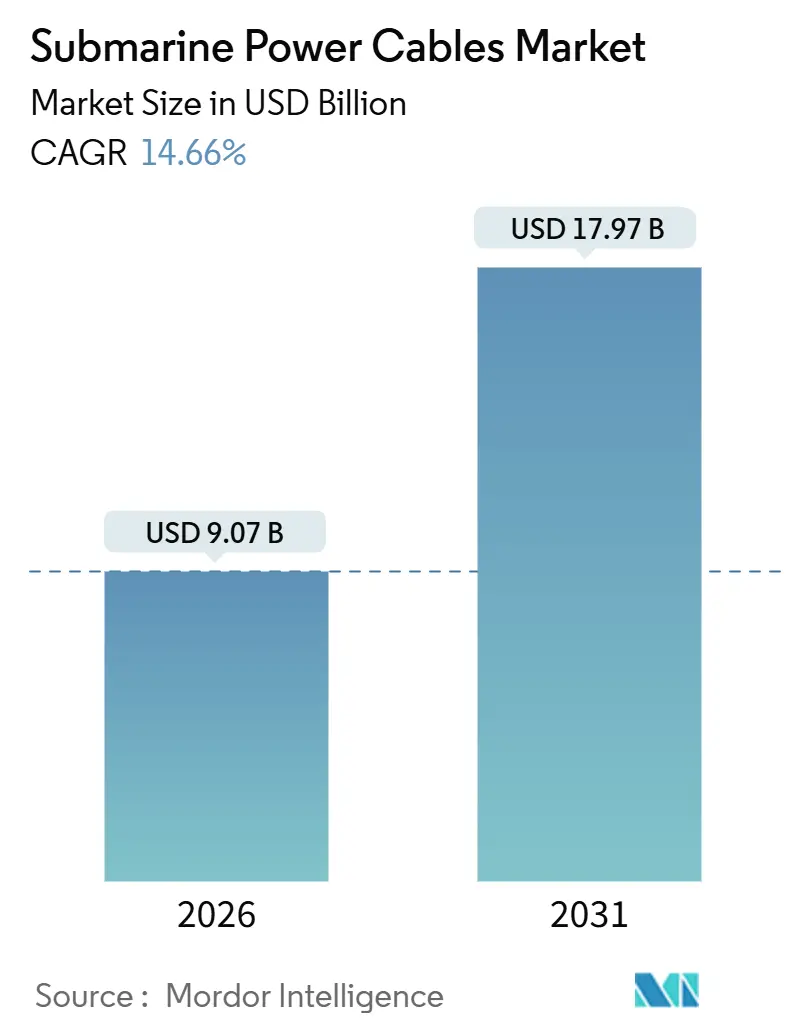
| Market Size (2026) | USD 9.07 Billion |
| Market Size (2031) | USD 17.97 Billion |
| Growth Rate (2026 - 2031) | 14.66% CAGR |
| Fastest Growing Market | North America |
| Largest Market | Europe |
| Market Concentration | Medium |
Major Players *Disclaimer: Major Players sorted in no particular order Image © Mordor Intelligence. Reuse requires attribution under CC BY 4.0. | |
Submarine Power Cables Market Analysis by Mordor Intelligence
The Submarine Power Cables Market size is estimated at USD 9.07 billion in 2026, and is expected to reach USD 17.97 billion by 2031, at a CAGR of 14.66% during the forecast period (2026-2031).
The surge reflects unrelenting offshore-wind build-outs, the mainstreaming of 525 kV XLPE HVDC links, and a wave of government-backed interconnector projects that balance renewable generation across national grids. A robust project pipeline in Europe, aggressive capacity targets in the United States, and steady policy support in Asia-Pacific keep capital commitments high, while manufacturing expansions in high-voltage extrusion give suppliers room to scale. Turbine ratings above 15 megawatts, floating-foundation pilots, and dynamic-cable innovations reshape technical specifications, nudging developers toward longer export runs and higher conductor cross-sections. Input-price volatility, especially in copper, and a shortage of repair vessels continue to pressure margins, but cost-plus contracts and aluminum-conductor adoption soften the blow. Competitive intensity remains elevated as incumbents integrate vertically, deploy next-generation laying vessels, and race to secure long-lead copper and XLPE feedstocks.
Key Report Takeaways
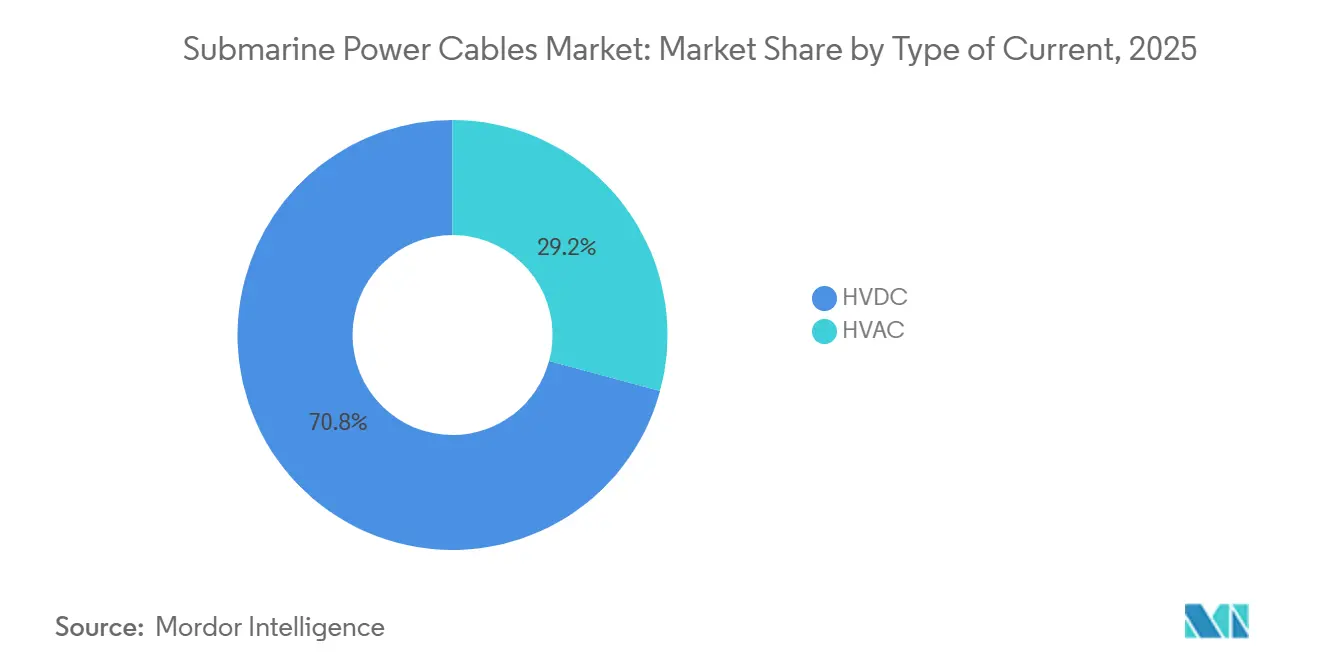
- By type of current, HVDC held 70.8% of revenue in 2025 and is expanding at a 15.1% CAGR through 2031, underscoring its dominance in long-haul, high-capacity links.
- By voltage class, the 66-220 kV segment led with 58.5% revenue share in 2025, while the above-220 kV class is forecast to register the fastest 16.9% CAGR to 2031.
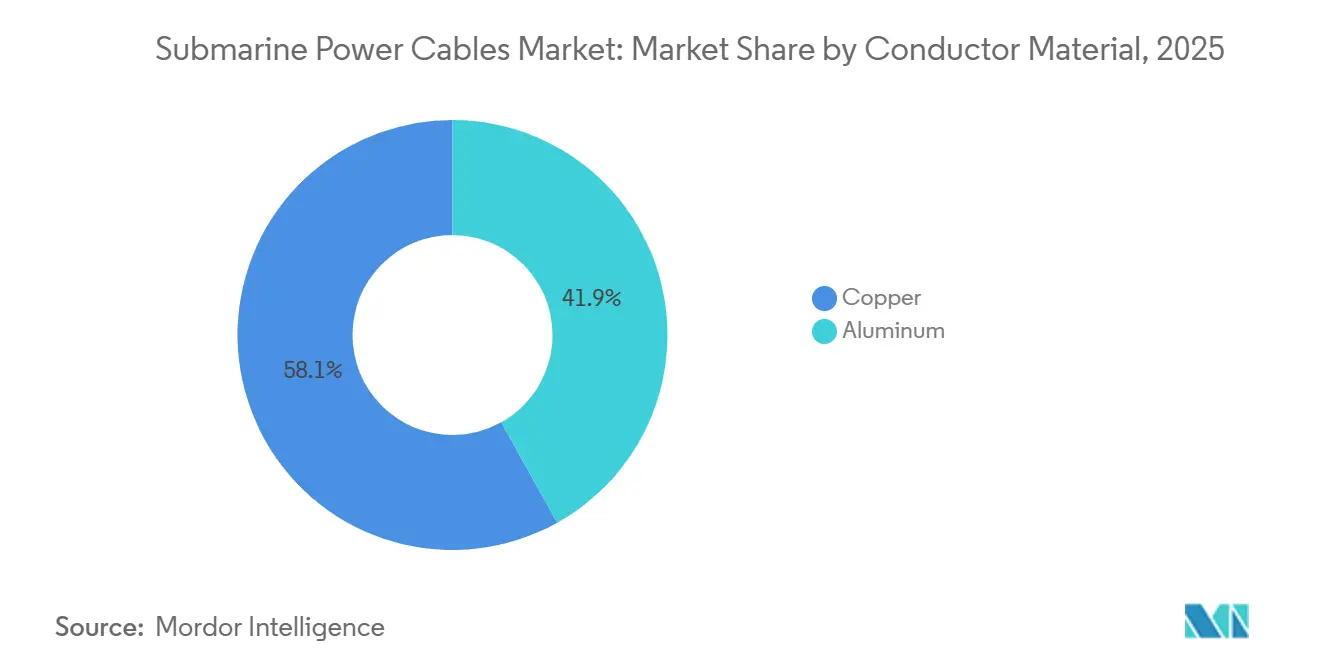
- By conductor material, copper commanded 58.1% of 2025 revenue, whereas aluminum is poised for the highest 16.5% CAGR on cost and weight advantages.
- By core type, single-core designs accounted for 64.7% of 2025 installations; multi-core variants are projected to rise at a 16.2% CAGR as developers seek trench-count reductions.
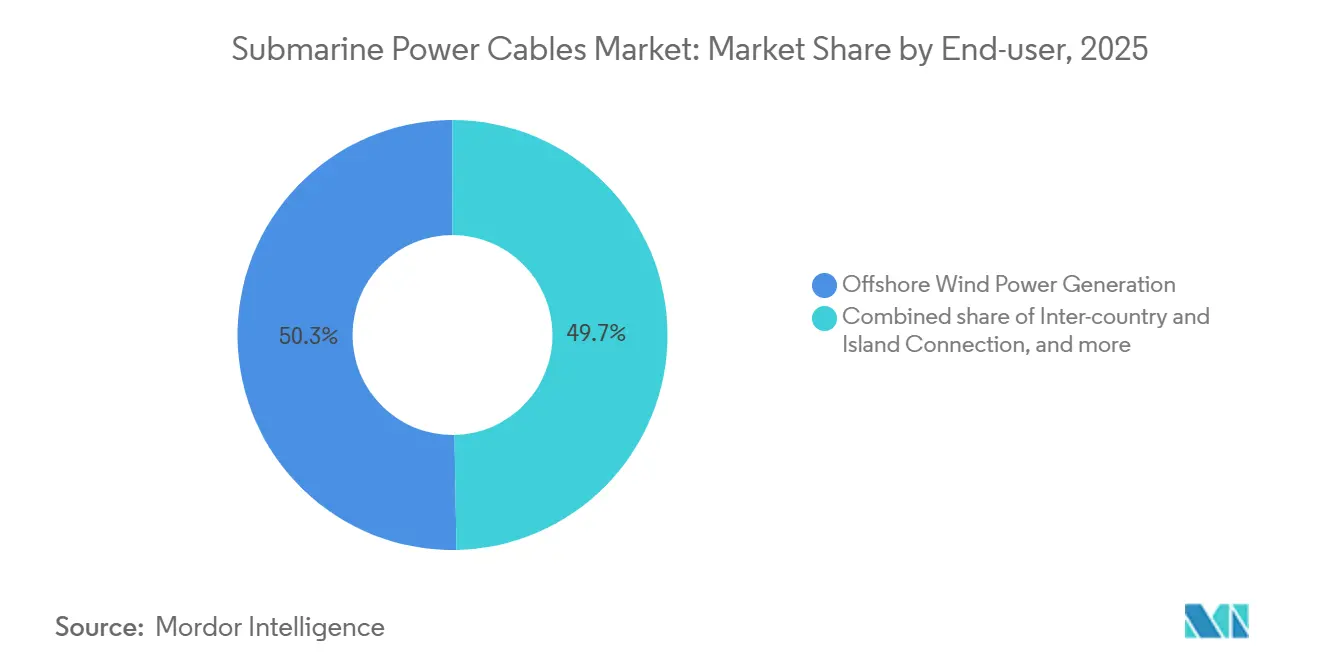
- By end-user, offshore wind generation captured 50.3% of 2025 demand; inter-country and island interconnectors lead growth at 15.7% CAGR on energy-security mandates.
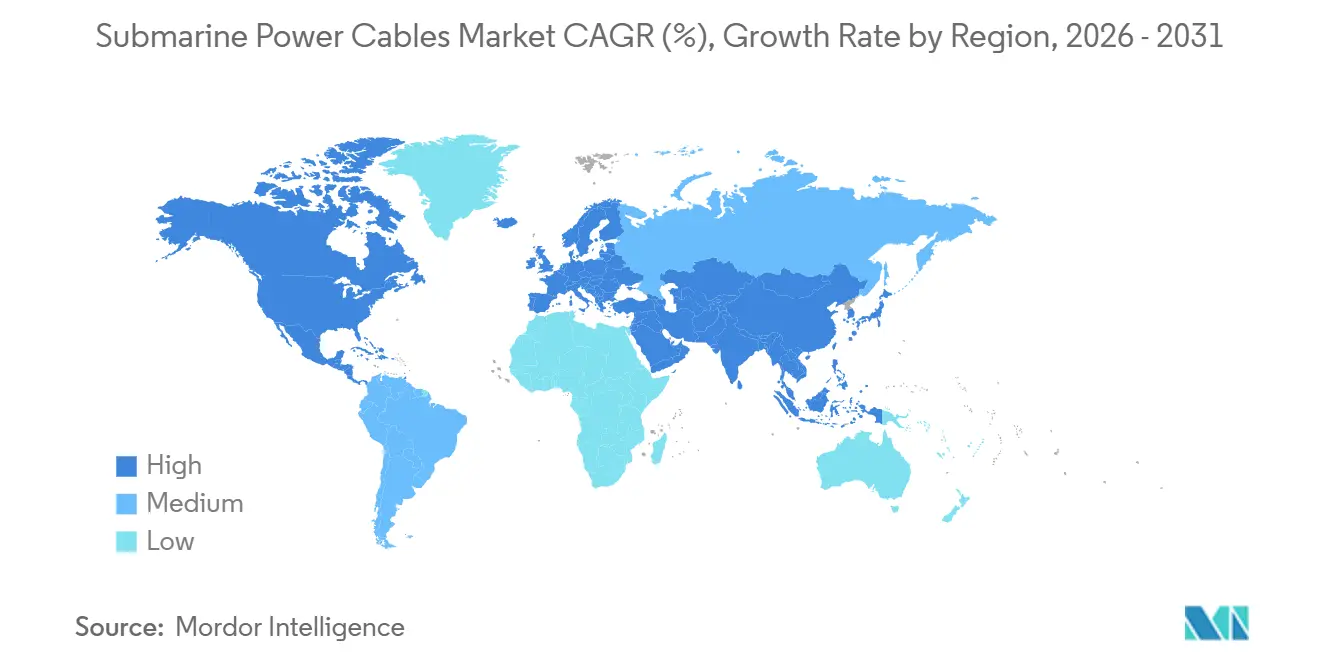
- By geography, Europe retained 55.6% of global revenue in 2025, while North America is expected to log a 17.3% CAGR driven by U.S. lease auctions.
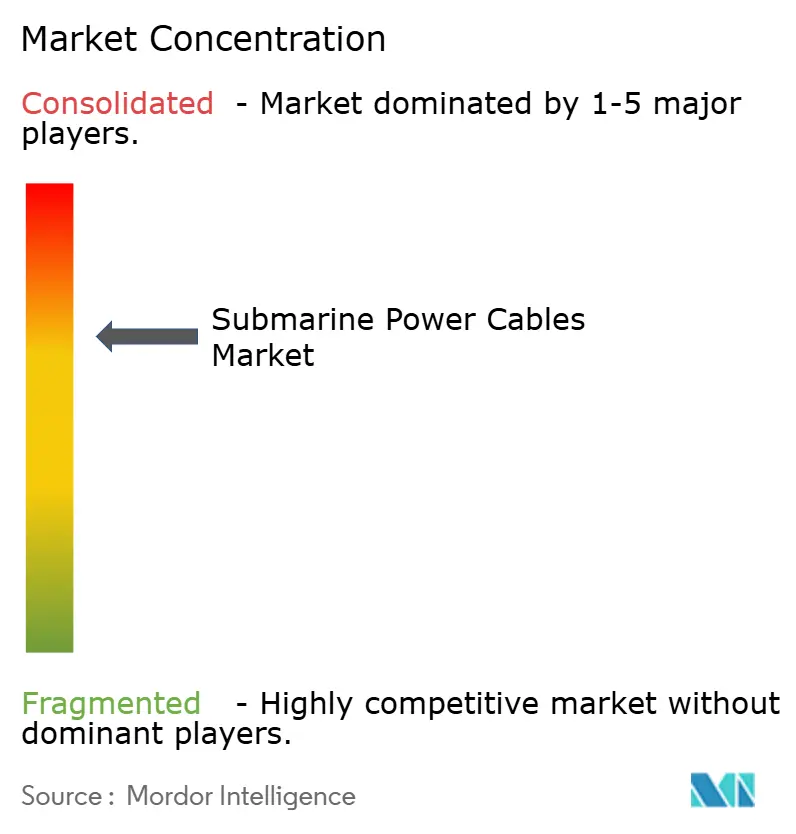
- Prysmian, Nexans, and NKT collectively held 60% of 2025 global capacity, reflecting significant submarine power cable market share concentration at the top of the value chain.
Note: Market size and forecast figures in this report are generated using Mordor Intelligence’s proprietary estimation framework, updated with the latest available data and insights as of January 2026.
Global Submarine Power Cables Market Trends and Insights
Drivers Impact Analysis*
| Driver | (~) % Impact on CAGR Forecast | Geographic Relevance | Impact Timeline |
|---|---|---|---|
| Surging offshore-wind project pipeline | 3.80% | Europe, North America, Asia-Pacific | Medium term (2-4 years) |
| Rapid adoption of 525 kV XLPE HVDC technology | 2.90% | Global, early focus in Europe & China | Long term (≥ 4 years) |
| Cross-border “green interconnector” initiatives | 2.40% | Europe, ASEAN, East Asia | Medium term (2-4 years) |
| Decarbonization of oil & gas platforms via power-from-shore | 1.70% | North Sea, Middle East | Long term (≥ 4 years) |
| CapEx reductions from next-gen cable-laying vessels | 1.50% | Global | Short term (≤ 2 years) |
| Marine-proven smart-cable health-monitoring systems | 1.20% | Global | Medium term (2-4 years) |
| Source: Mordor Intelligence | |||
Surging Offshore-Wind Project Pipeline
Global offshore-wind additions hit 10.8 GW in 2025 and are on track to average 15 GW annually through 2030, keeping the submarine power cable market firmly supplied with new tenders.[1]U.S. Department of Energy, “Offshore Wind Market Report,” energy.gov Each added gigawatt translates into more than 200 km of export and array cables, cementing baseline demand even before onshore grid upgrades are considered. China’s Jiangsu and Guangdong provinces alone commissioned 4.2 GW in 2025, relying heavily on domestic 220 kV XLPE lines that proved capable in 40 m depths. The United Kingdom’s latest Celtic Sea awards promise dynamic cable uptake as floating foundations move into 70 m waters. Japan’s designation of five promotion zones in 2025 further lifts the regional outlook, calling for fiber-optic-equipped dynamic cables that track strain in real time.[2]Bloomberg, “Global High-Voltage Cable Outlook,” bloomberg.com These trends keep the submarine power cable market on a trajectory where capacity expansions at extrusion plants struggle to keep pace with order intake.
Rapid Adoption of 525 kV XLPE HVDC Technology
Shifting from 320 kV to 525 kV reduces link losses by 35% on runs past 200 km, enabling 2 GW through a single bipole and cutting seabed corridor counts by half. Landmark contracts, TenneT’s 2 GW DolWin5 grid link and NKT’s Bornholm Energy Island supply, underline buyer confidence in extruded XLPE insulation. IEC 62067-A2, published in 2024, standardizes qualification, compressing permitting timelines and opening multi-region bidding.[3]IEC, “IEC 62067 Amendment 2,” iec.ch Cost curves flatten as more suppliers certify 525 kV capability, though lead times still hover near 36 months because only five factories worldwide can produce the diameter and purity demanded. The result is a glide path where the submarine power cable market increasingly prices projects on a cost-plus basis linked to copper indices, pushing risk back to offtakers.
Cross-Border “Green Interconnector” Initiatives
Seventeen Projects of Common Interest, backed by EUR 800 million in Connecting Europe Facility grants, prove that Brussels sees cables as low-carbon arteries.[4]European Commission, “Trans-European Networks for Energy,” ec.europa.eu Operational showpieces like the 765 km, 400 kV Viking Link validate both technical feasibility and economic worth by injecting Danish wind into the U.K. grid during lull periods. Beyond Europe, ASEAN’s Sarawak-West Kalimantan link and a revived Korea-Japan feasibility study show other regions lifting templates directly from the European playbook. Supplier order books swell accordingly: Nexans won EUR 1.9 billion for the Crete-Attica HVDC line in 2025, and LS Cable secured 150 km for Malaysia-Indonesia hydro exports the same year. With grid inertia a mounting concern, HVDC interconnectors acquire a dual role in energy trade and frequency balancing.
Decarbonization of Oil & Gas Platforms via Power-from-Shore
Emissions from offshore installations made Norway’s regulators require electrification assessments for all new fields, a move mirrored by the U.K.’s North Sea Transition Authority. Equinor’s Johan Sverdrup Phase 2 now pulls 100 MW over 200 km HVAC lines, trimming annual CO₂ by 1.2 million t and OPEX by USD 40 million. Saudi Aramco, ADNOC, and others followed, awarding multi-hundred-million-dollar HVDC packages to bring solar-derived electrons offshore. Power-from-shore, therefore, shifts the submarine power cable market into oil provinces that previously favored satellite gas turbines, diversifying demand beyond pure renewables.
Restraints Impact Analysis*
| Restraint | (~) % Impact on CAGR Forecast | Geographic Relevance | Impact Timeline |
|---|---|---|---|
| Subsea repair-vessel bottlenecks & soaring day-rates | -1.80% | Global, acute in North Sea & U.S. East Coast | Short term (≤ 2 years) |
| Copper-price volatility impacting project budgets | -1.40% | Global | Short term (≤ 2 years) |
| Permitting delays for ultra-long HVDC corridors | -0.90% | Europe, North America | Medium term (2-4 years) |
| Seabed UXO risk in legacy war zones | -0.70% | North Sea, Baltic, East China Sea | Medium term (2-4 years) |
| Source: Mordor Intelligence | |||
Subsea Repair-Vessel Bottlenecks & Soaring Day-Rates
Only 12 vessels worldwide can handle 525 kV systems, utilization tops 85%, and day-rates leapt from USD 180,000 in 2023 to USD 290,000 in 2025. Ørsted’s Walney Extension faced a six-week delay that cost USD 18 million in lost revenue, highlighting how vessel scarcity feeds insurer premium hikes. A backlog of 14 projects in early 2025 stretched average wait times to 35 days in the North Sea. While Prysmian’s plan to convert a retired pipe-layer adds capacity by 2027, certification and crew training push relief at least 18 months away. Until the fleet expands, downtime risk dampens the submarine power cable market’s otherwise strong growth trajectory.
Copper-Price Volatility Impacting Project Budgets
Copper fluctuated between USD 8,200 and USD 10,400 per tonne in 2025, forcing suppliers to invoke escalation clauses that added up to 12% on fixed-price contracts. Nexans absorbed EUR 120 million in unrecovered costs on legacy deals and migrated to cost-plus bids with monthly indexation. Developers increasingly specify aluminum conductors, trading a 15% size penalty for 75% material savings. The International Copper Association forecasts cable demand at 450 kt per year by 2030, deepening competition with EV batteries. Price swings, therefore, inject budgeting uncertainty that can stall final investment decisions.
*Our forecasts treat driver/restraint impacts as directional, not additive. The impact forecasts reflect baseline growth, mix effects, and variable interactions.
Segment Analysis
By Type of Current: HVDC Widens Its Lead
The submarine power cable market size for HVDC installations reached USD 5.7 billion in 2025 and is on pace for a 15.1% CAGR, reflecting rising average export lengths and asynchronous-grid tie-ins. HVDC’s 70.8% 2025 share stems from its sub-3% round-trip losses on links above 100 km and its ability to move bulk power without reactive-compensation hardware. HVAC retains relevance inside wind arrays where runs rarely exceed 30 km, but cost parity tips to HVDC once converter-platform costs fall below USD 110 million per 500 MW.
Looking ahead, voltage-source converter adoption gives HVDC black-start capability, enabling offshore clusters to support grid inertia markets. Suppliers report that 70% of open tenders now mandate 525 kV rating, signalling that HVDC’s design envelope will keep stretching. These dynamics confirm HVDC as the defining growth engine for the submarine power cable market.


By Voltage Class: Ultra-High Voltage Takes Off
The 66-220 kV band led 2025 volumes with 58.5% yet above-220 kV systems grow fastest at 16.9% CAGR as 2 GW export blocks head 135 km or more to shore. DolWin5 illustrates the economics, trimming line losses to 1.8% and removing interim platforms. Up to 66 kV retains niches in tidal arrays and island links but lacks the ampacity required for gigawatt-scale exports, especially as turbine nameplates exceed 15 MW.
Factory expansions underscore the pivot: Prysmian’s Arco Felice adds a second 525 kV extrusion line by 2027, and NKT’s vertical tower in Karlskrona hits zero-void insulation at 525 kV. IEC’s harmonized qualification accelerates multi-region permitting, ensuring ultra-high voltage remains the submarine power cable market’s fastest lane.
By Conductor Material: Aluminum Scales Commercial Acceptance
Copper’s 58.1% share holds for deep-water reliability, yet aluminum posts 16.5% CAGR amid persistent price gaps. Nexans’ AluPower achieves 95% conductivity of copper at half the weight, shaving USD 8 million in vessel charters on a 100 km install. LS Cable’s Shinan project cut trenching time by 20% thanks to lighter pull forces, demonstrating field acceptance. Copper price spikes compel developers to dual-spec aluminum, locking in upside if markets tighten. Consequently, aluminum’s role expands from cost hedge to mainstream alternative, especially in Asia-Pacific’s shorter, shallower routes.
By Core Type: Installation Strategy Drives Choice
Single-core cables, 64.7% of 2025 volume, remain the preferred HVDC architecture because each pole operates independently, facilitating parallel lay spreads that compress schedules by four months on a 2 GW link. Multi-core growth at 16.2% stems from HVAC arrays bundling three phases to slash seabed passes. Hornsea 3’s 66 kV three-core scheme cut vessel mobilizations by two-thirds, saving GBP 22 million. Single-core retains higher ampacity and superior thermal dissipation, but multi-core innovations such as helical armor and dynamic-fatigue designs open floating-wind applications, supporting a demand mix that keeps both formats integral to the submarine power cable market.
By End-User: Interconnectors Accelerate on Energy-Security Goals
Offshore wind still dominated 2025 with a 50.3% share, yet inter-country and island links pace growth at a 15.7% CAGR. EU funding for Projects of Common Interest and Greece’s Crete-Attica link showcase policy backing that turns cables into geopolitical assets. Oil & gas power-from-shore supply sits at 8%, but electrification mandates in Norway and the Middle East elevate long-dated backlog visibility. Emerging marine renewables like tidal add niche volume, ensuring end-user diversification remains a hallmark of the submarine power cable market.
Geography Analysis
Europe’s 55.6% share in 2025 reflects the North Sea pipeline and the EU’s mandate to double cross-border transfer capacity by 2030. Dogger Bank and Bornholm Energy Island typify massive cluster developments that bundle multiple wind farms into shared HVDC hubs, yielding economies of scale and reinforcing the region’s submarine power cable market leadership. Germany’s TenneT accelerated contract awards worth EUR 2.8 billion through 2025, spurring suppliers to expand extrusion lines despite 36-month delivery queues.
North America is set for a 17.3% CAGR through 2031 as federal lease auctions unleash 30 GW of targeted builds. Vineyard Wind proved bankability, and Empire Wind’s 340 km HVDC spec confirms long-haul trends. Canada’s 5 GW Atlantic target adds fresh load, with green-hydrogen export ambitions tying into cable demand. Supply-chain localization requirements push European OEMs to establish U.S. production, creating a twin-shore manufacturing footprint.
Asia-Pacific seized 28% revenue in 2025 with China’s 4.2 GW additions and Japan’s floating-wind zones demanding dynamic, fiber-optic-equipped lines. Taiwan’s Formosa 3 will push 525 kV HVDC 180 km in typhoon-prone waters, validating design robustness for extreme weather. South Korea’s aluminum-conductor preference underscores regional cost focus, while a proposed Korea-Japan HVDC link could usher in the area’s first multi-gigawatt interconnector.

Competitive Landscape
Submarine power cable market competition centers on five qualified 525 kV XLPE suppliers. Prysmian’s full control of the Leonardo da Vinci vessel locks in end-to-end execution, matching manufacturing with logistics capacity. Nexans counters with a Halden-plant expansion and patented distributed acoustic sensing, creating service-based revenue on top of cable sales. NKT leverages Victoria’s DP-3 capability for deep-water installs in the U.S. Outer Continental Shelf, bundling EPC scope to win Hornsea 4. Asian challengers, Sumitomo Electric, LS Cable, and Hengtong, deploy price discounts and local vessel builds to penetrate regional tenders, particularly in China and Taiwan.
Technology differentiation now lies in digital-monitoring integration and alloy innovation rather than pure voltage rating, a sign of maturing HVDC specifications. Smaller players like JDR and TFKable exploit tidal-array and island projects where agility trumps scale, carving defensible niches. Supply-chain stress persists around XLPE resin, armor wire, and copper rod, with leading firms securing long-term offtake contracts to buffer volatility and protect market share.
Submarine Power Cables Industry Leaders
Prysmian Group
NKT A/S
Nexans SA
Sumitomo Electric Industries Limited
- *Disclaimer: Major Players sorted in no particular order

Recent Industry Developments
- December 2025: ABB acquired Ekona Power’s monitoring tech for USD 85 million, deploying on Revolution Wind.
- July 2025: Prysmian won a EUR 1.2 billion deal to supply 525 kV HVDC cables for TenneT’s 2 GW LanWin1 grid link, cutting build time by 25% via its Leonardo da Vinci vessel.
- July 2024: Sumitomo Electric committed JPY 50 billion to a Yokohama plant targeting 275 kV supply for floating-wind projects.
- June 2024: Nexans completed a EUR 300 million Halden expansion, adding 600 km of 525 kV capacity aimed at Empire Wind 2.


Global Submarine Power Cables Market Report Scope
The global submarine cable market encompasses the design, manufacturing, installation, maintenance, and upgrading of seabed-laid cables. These cables transmit telecommunications signals and electric power across countries, islands, offshore facilities, and continents.
The submarine power cable market is segmented into type of current, voltage class, conductor material, core type, end-user, and geography. By type of current, the market is segmented into HVDC and HVAC. By voltage class, the market is divided into up to 66 kV, 66 to 220 kV, and above 220 kV. By conductor material, the market is segmented into copper and aluminum. By core type, the market is divided into single-core and multi-core. By end-user, the market is divided into offshore wind power generation and others. The report also covers the market size and forecasts for the market across major regions. For each segment, the market sizing and forecasts have been done based on revenue (USD Billion) for all the above segments.
By Type of Current
| HVDC |
| HVAC |
By Voltage Class
| Up to 66 kV |
| 66 to 220 kV |
| Above 220 kV |
By Conductor Material
| Copper |
| Aluminum |
By Core Type
| Single-core |
| Multi-core |
By End-User
| Offshore Wind Power Generation |
| Inter-country and Island Connection |
| Offshore Oil and Gas Platforms |
| Others (Marine Renewables including Wave, Tidal) |
Geography
| North America | United States |
| Canada | |
| Mexico | |
| Europe | Germany |
| United Kingdom | |
| France | |
| Sweden | |
| Norway | |
| Denmark | |
| Netherlands | |
| Rest of Europe | |
| Asia-Pacific | China |
| India | |
| Japan | |
| South Korea | |
| ASEAN Countries | |
| Australia and New Zealand | |
| Rest of Asia-Pacific | |
| South America | Brazil |
| Argentina | |
| Colombia | |
| Rest of South America | |
| Middle East and Africa | Saudi Arabia |
| United Arab Emirates | |
| South Africa | |
| Egypt | |
| Rest of Middle East and Africa |
| By Type of Current | HVDC | |
| HVAC | ||
| By Voltage Class | Up to 66 kV | |
| 66 to 220 kV | ||
| Above 220 kV | ||
| By Conductor Material | Copper | |
| Aluminum | ||
| By Core Type | Single-core | |
| Multi-core | ||
| By End-User | Offshore Wind Power Generation | |
| Inter-country and Island Connection | ||
| Offshore Oil and Gas Platforms | ||
| Others (Marine Renewables including Wave, Tidal) | ||
| Geography | North America | United States |
| Canada | ||
| Mexico | ||
| Europe | Germany | |
| United Kingdom | ||
| France | ||
| Sweden | ||
| Norway | ||
| Denmark | ||
| Netherlands | ||
| Rest of Europe | ||
| Asia-Pacific | China | |
| India | ||
| Japan | ||
| South Korea | ||
| ASEAN Countries | ||
| Australia and New Zealand | ||
| Rest of Asia-Pacific | ||
| South America | Brazil | |
| Argentina | ||
| Colombia | ||
| Rest of South America | ||
| Middle East and Africa | Saudi Arabia | |
| United Arab Emirates | ||
| South Africa | ||
| Egypt | ||
| Rest of Middle East and Africa | ||


Key Questions Answered in the Report
What is the current value of the submarine power cable market?
The market was valued at USD 9.07 billion in 2026 and is on course for USD 17.97 billion by 2031, reflecting a 14.66% CAGR.
Which technology leads growth in submarine cables?
HVDC systems dominate, capturing 70.8% of 2025 revenue and advancing at a 15.1% CAGR thanks to efficiency over long distances.
Why are 525 kV XLPE cables important?
They cut transmission losses by 35%, move 2 GW per bipole, and reduce the number of seabed corridors, lowering project CapEx.
How is copper price volatility affecting projects?
Fluctuating copper prices added up to 12% to some 2025 contracts, accelerating the shift toward aluminum conductor alternatives.
What region is growing fastest for new submarine cables?
North America is projected to post a 17.3% CAGR through 2031, driven by aggressive U.S. offshore-wind lease auctions.
Which companies control most capacity?
Prysmian, Nexans, and NKT together hold about 60% of manufacturing capacity, illustrating moderate concentration at the top.
Page last updated on:


