
Chemicals & Materials
7th MayStrategic Expansion of Floor Coatings in the MEIA Region
4 Min Read
The Zirconium Market Report is Segmented by Occurrence Type (Zircon, Zirconia, and Other Types), Application (Zircon Flour/Milled Sand, Zircon Opacifier, Refractories, Zircon Chemicals, and Zircon Metal and Alloys), and Geography (Production Analysis: Australia, Brazil, China, India, Indonesia, and More; Consumption Analysis: China, United States, Japan, and More). The Market Forecasts are Provided in Terms of Volume (Tons).
Market Overview
| Study Period | 2021 - 2031 |
|---|---|
| Market Volume (2026) | 1.32 Million tons |
| Market Volume (2031) | 1.62 Million tons |
| CAGR | 4.11 % |
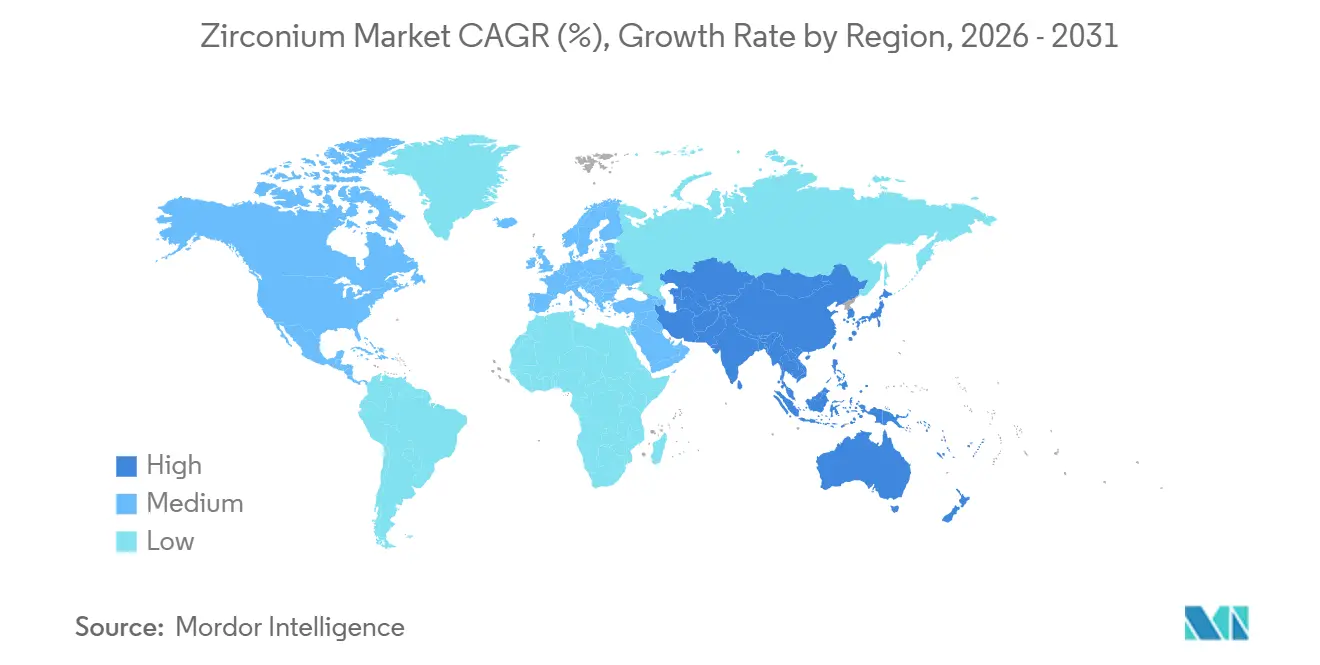
| Fastest Growing Market | Asia Pacific |
| Largest Market | Asia Pacific |
| Market Concentration | High |
Major Players *Disclaimer: Major Players sorted in no particular order. Image © Mordor Intelligence. Reuse requires attribution under CC BY 4.0. |
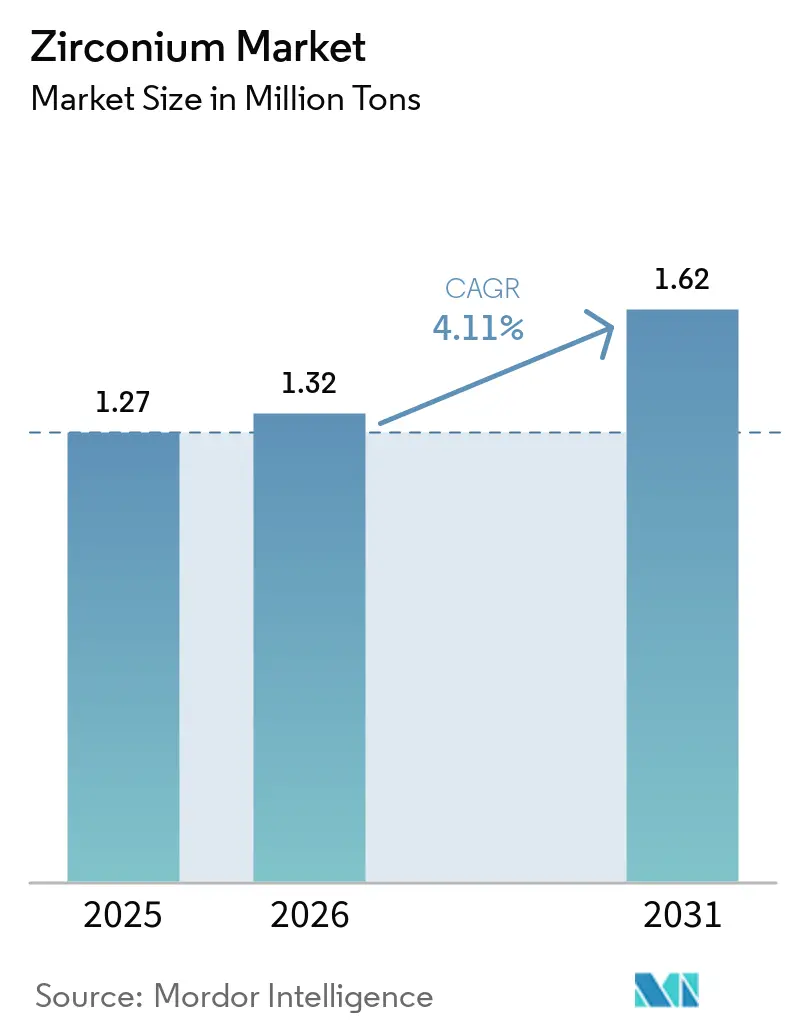
The Zirconium Market size is projected to expand from 1.27 million tons in 2025 and 1.32 million tons in 2026 to 1.62 million tons by 2031, registering a CAGR of 4.11% between 2026 to 2031. In 2025, China dominated global consumption. However, during 2024-2025, U.S. tariffs and Europe's friend-shoring mandates reshaped trade routes, steering buyers toward allied suppliers. While the foundry and refractory sectors retained their volume leadership, zirconia's rapid adoption in solid-state batteries and aerospace thermal-barrier coatings redefined value chains, surpassing tonnage growth forecasts. On the supply side, leading mineral-sands miners commanded a significant share of the concentrate supply. However, a substantial majority of zirconium oxychloride production remained concentrated in China, exposing Western buyers to price and supply vulnerabilities. Furthermore, regulatory crackdowns on naturally occurring radioactivity in Australia, Indonesia, and Brazil tightened the issuance of new mining licenses and increased rehabilitation costs.
Key Report Takeaways
Note: Market size and forecast figures in this report are generated using Mordor Intelligence's proprietary estimation framework, updated with the latest available data and insights as of January 2026.
Drivers Impact Analysis
| Driver | (~) % Impact on CAGR Forecast | Geographic Relevance | Impact Timeline | |||
|---|---|---|---|---|---|---|
Sustained demand from foundry and refractory industries
Sustained demand from foundry and refractory industries
| +1.20% | Global, with concentration in China, India, EU | Long term (≥ 4 years) |
(~) % Impact on CAGR Forecast
:
+1.20%
|
Geographic Relevance
:
Global, with concentration in China, India, EU
|
Impact Timeline
:
Long term (≥ 4 years)
|
Rising use of zircon-based opacifiers in advanced ceramics
and coatings
Rising use of zircon-based opacifiers in advanced ceramics
and coatings
| +0.90% | APAC core, spill-over to Middle-East and Africa | Medium term (2-4 years) | |||
Commercialization of zirconia solid electrolytes for
next-gen batteries
Commercialization of zirconia solid electrolytes for
next-gen batteries
| +0.70% | North America, EU, China, South Korea | Medium term (2-4 years) | |||
Friend-shoring and EU Critical Raw Materials Act spurring
new refining capacity
Friend-shoring and EU Critical Raw Materials Act spurring
new refining capacity
| +0.50% | EU, North America, Australia | Long term (≥ 4 years) | |||
High-purity zirconia for aerospace thermal-barrier
coatings
High-purity zirconia for aerospace thermal-barrier
coatings
| +0.40% | North America, EU | Long term (≥ 4 years) | |||
| Source: Mordor Intelligence | ||||||
Sustained Demand from Foundry and Refractory Industries
In 2025, global foundries, emphasizing zircon's prized qualities such as low thermal expansion and chemical inertness, heavily relied on zircon sand for precision cores and molds. Although cost-sensitive applications began favoring chromite and olivine over zircon, a sand recycling patent from Noram Technology played a pivotal role in preserving zircon's value in Europe. Refractory formulators, by blending zirconia with magnesia and alumina, extended furnace life, driving up zirconia demand despite its substitution hurdles. Meanwhile, Europe's stringent radioactive waste disposal regulations championed closed-loop foundry operations, ensuring the retention of zircon fractions.
Rising Use of Zircon-Based Opacifiers in Advanced Ceramics
In 2025, ceramics claimed a substantial portion of zircon sand usage, with digitally printed tiles enhancing zircon loading per square meter. As the primary producers of the world's tiles, China and India amplified their demand for opacifiers, leading to a need for ultra-low-iron powders. The appetite for finer grades in additive manufacturing surged annually, carving premium niches in electronics and renewable energy devices. Capitalizing on this trend, Iluka Resources boosted its milling capacity to capitalize on these profitable sales.
Commercialization of Zirconia Solid Electrolytes for Next-Gen Batteries
In 2025, zirconia-based NASICON and LLZO chemistries, moving from laboratories to pilot scales, achieved ionic conductivities that promise safer sodium-ion and lithium-metal cells[1]Peer-reviewed study, “Enhanced Conductivity in NASICON-Type Solid Electrolytes,” peer-reviewed-journal.org . Pilot projects in China, South Korea, and the United States set their sights on an annual production of high-purity zirconia by 2031, with prices outpacing commodity grades. In a strategic move, Energy Fuels, teaming up with Australian Strategic Materials, crafted a mine-to-metal chain, deftly avoiding Chinese middlemen.
Friend-Shoring and EU Critical Raw Materials Act
By mandating domestic processing of critical minerals by 2030, the Act took a direct aim at curbing China's stronghold on zirconium oxychloride capacity[2]European Commission, “Critical Raw Materials Act,” europa.eu . In 2025, Australian Strategic Materials' pilot facility in Korea successfully churned out dehafniated zirconium metal. Concurrently, Energy Fuels, in a strategic alliance with Chemours, localized refining processes in Utah. This strategic pivot led buyers to willingly pay a premium for materials from these partnered sources, strengthening capacities beyond China's borders.
Restraints Impact Analysis
| Restraint | (~) % Impact on CAGR Forecast | Geographic Relevance | Impact Timeline | |||
|---|---|---|---|---|---|---|
Substitution by chromite/olivine in foundry and
refractories
Substitution by chromite/olivine in foundry and
refractories
| -0.60% | Global, with concentration in EU, North America | Medium term (2-4 years) |
(~) % Impact on CAGR Forecast
:
-0.60%
|
Geographic Relevance
:
Global, with concentration in EU, North America
|
Impact Timeline
:
Medium term (2-4 years)
|
Tightening radioactivity and ESG rules on
heavy-mineral-sand mining
Tightening radioactivity and ESG rules on
heavy-mineral-sand mining
| -0.80% | Australia, Indonesia, Brazil, Sri Lanka | Short term (≤ 2 years) | |||
Chinese downstream dominance and US tariffs disrupting
supply chains
Chinese downstream dominance and US tariffs disrupting
supply chains
| -0.50% | North America, EU, China | Short term (≤ 2 years) | |||
| Source: Mordor Intelligence | ||||||
Substitution by Chromite/Olivine in Foundry and Refractories
Chromite, being more affordable, rivals its counterparts in refractoriness. At the same time, olivine's reduced silica content mitigates the risk of silicosis. As a result, foundries across Europe and North America are contemplating a gradual transition away from zircon. Noram Technology has secured a patent for a method that selectively extracts either chromite or zircon from recycled sand, thereby lessening the reliance on virgin materials. Refractory manufacturers are increasingly favoring magnesia-alumina blends, reserving zirconia for zones subjected to extreme heat.
Tightening Radioactivity and ESG Rules on Heavy-Mineral-Sand Mining
Australia’s ARPANSA has imposed limits on worker exposure and prohibits the European Union trade of concentrates with elevated uranium-thorium levels. In 2024, Indonesia, Sri Lanka, and Brazil witnessed delays in multiple license applications. Furthermore, in 2025, miners in Western Australia undertook dust-control upgrades, inflating their operational expenses. Zircon's classification as radioactive for transport, when surpassing specific activity thresholds, introduces additional logistical hurdles.
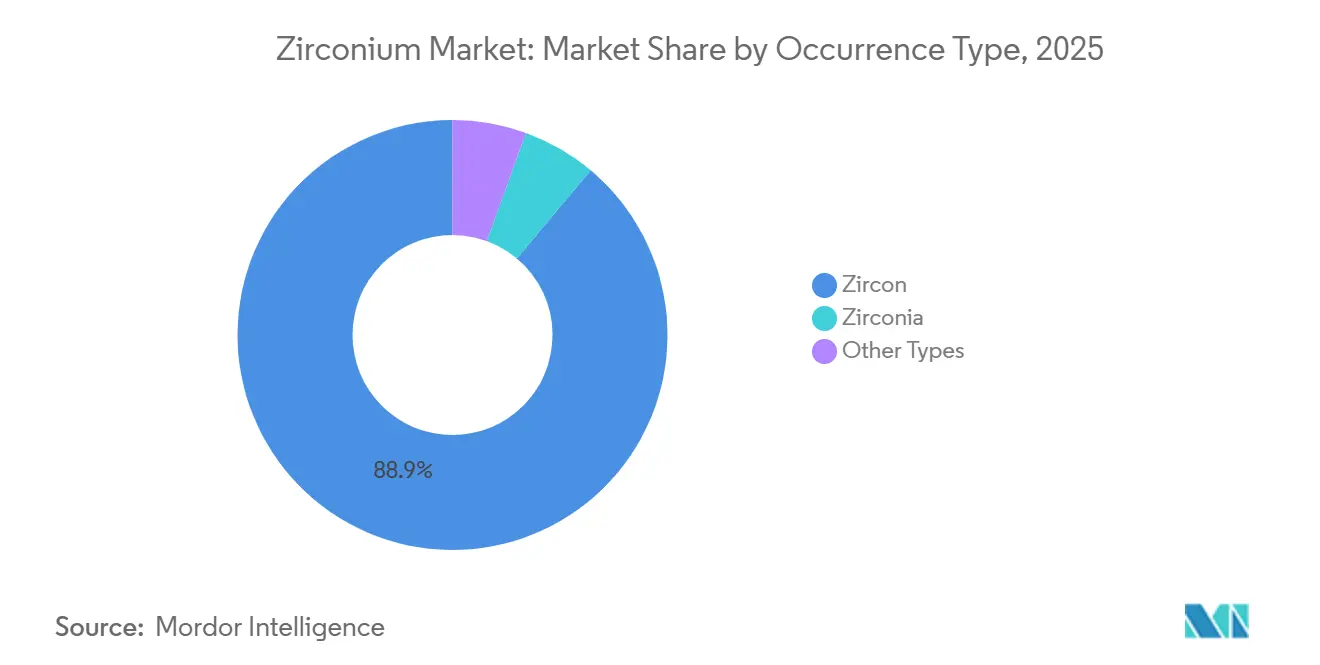
By Occurrence Type: Zircon Remains the Anchor, Zirconia Drives Margin
In 2025, zircon dominated the market, constituting a substantial 88.89% of the total volume. With both Australia and South Africa playing pivotal roles in the supply chain, established ceramics and foundry sectors enjoyed a steady influx of zircon. As mature mines transitioned to new orebodies, the market size for zircon in the zirconium sector not only reached a notable level in 2025 but was also set on a trajectory of steady growth. While zircon led in terms of volume, its pricing dynamics were intricately linked to construction cycles, exposing miners to the sector's fluctuations.
On the other hand, zirconia, despite its smaller tonnage, is projected to grow at a 5.27% CAGR during the 2026-2031 period. This anticipated growth is fueled by the surging demand for high-purity zirconia in applications such as solid-state batteries, bioceramics, and aerospace coatings. Producers adept at offering sub-micron powders enjoyed a significant price premium, enhancing their profitability. Energy Fuels’ strategic move to adopt ASM’s high-purity technology highlights the industry's ambition to seize margins that have historically benefited Chinese processors. In contrast, other variants such as baddeleyite remained in a niche position, hampered by reserves predominantly located in Russia and the geopolitical challenges that accompany them.
Note: Segment shares of all individual segments available upon report purchase
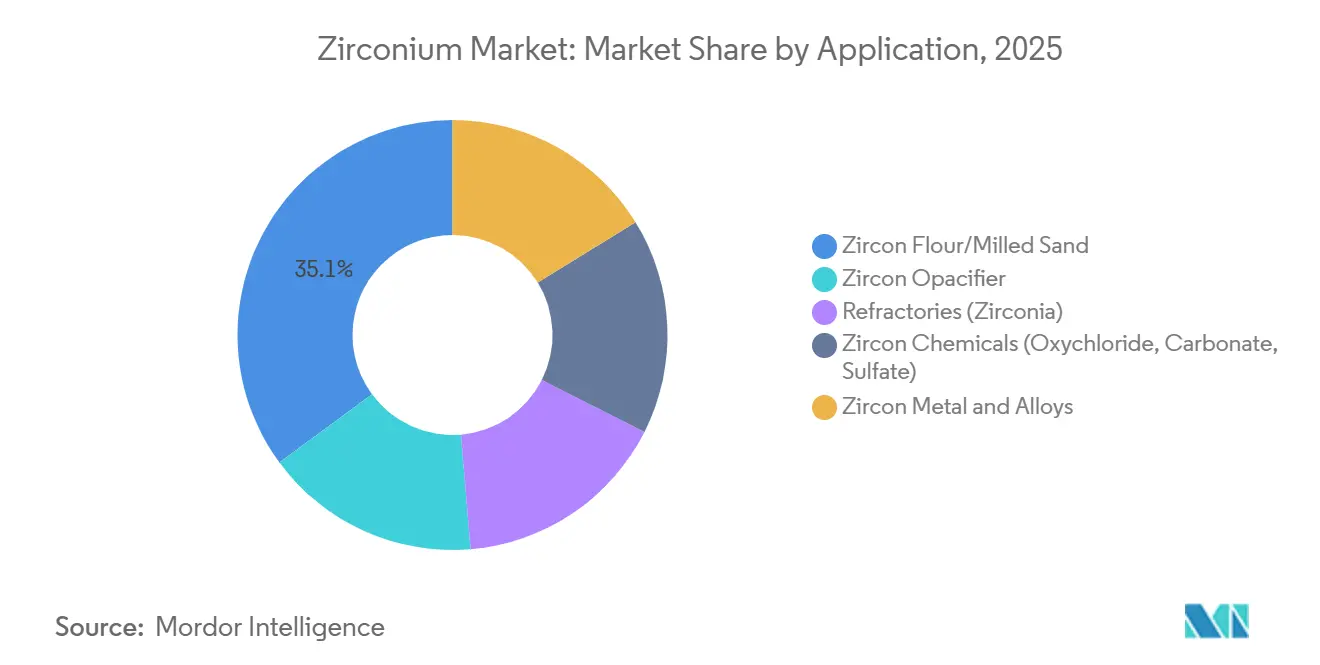
By Application: Flour Dominates, Alloys Accelerate
In 2025, zircon flour/milled sand together accounted for 35.11% of the total volume. While the segment experienced modest annual growth, premium sub-45-micron flours, especially those utilized in electronics, ensured sustained profitability. Zircon metal and alloys, despite representing the smallest tonnage, are set to witness a 6.21% CAGR during the 2026-2031 period. This anticipated surge is largely attributed to a global increase in reactor construction, subsequently driving up the demand for zircaloy fuel cladding. The market for nuclear alloys within the zirconium sector is projected to achieve significant milestones by 2031, largely due to the extended procurement cycles tied to new-build reactors.
Opacifiers, riding the wave of a ceramics boom in China and India, benefited in 2025 from enhanced zircon loading per tile, a result of advancements in digital printing. While refractories turned to zirconia-magnesia blends for prolonged furnace life, they encountered competition from chromite. It is worth noting that zircon chemicals, with a dominant focus on zirconium oxychloride, saw the bulk of their production concentrated in China. This centralization introduces vulnerabilities for downstream users, making them susceptible to geopolitical shifts. In light of these challenges, both Australian Strategic Materials and Energy Fuels are actively working to diversify the supply chain, emphasizing the localization of chemical production.
Note: Segment shares of all individual segments available upon report purchase
In 2025, China held a dominant 53.36% share of global consumption and is projected to grow at a CAGR of 4.78% through the forecast period of 2026-2031. China's extensive logistics network and leading role in zirconium chemicals enable it to maintain domestic prices below global averages. However, U.S. tariffs and EU friend-shoring regulations are prompting ceramic and alloy buyers to diversify, increasingly sourcing from Australia and Africa. By mid-2025, Chinese reactor constructions were major consumers of zirconium, and with new capacity approvals, this trend is anticipated to persist through 2031.
In 2023, North America, having utilized a significant amount of concentrates, began establishing new processing facilities in Utah and Georgia, with the goal of reclaiming value that was previously ceded to Chinese refiners. Although the zirconium market tied to U.S. solid-state battery initiatives is currently modest, it is swiftly gaining momentum as electric vehicle producers experiment with LLZO electrolytes. Europe, which accounted for a substantial share of 2025's demand, is prioritizing high-purity ceramics and aerospace coatings. The processing targets set by the Critical Raw Materials Act have spurred joint ventures in France and Germany, though the capital-intensive nature of these projects presents challenges.
In 2023, Australia and South Africa emerged as the primary sources for the majority of the world's mined zircon. Yet, with aging assets, there is an urgent call for brownfield restarts. In March 2026, Rio Tinto approved a restart at Zulti South in Mozambique, while Iluka's Balranald project ramped up its annual capacity in late 2025. Newer hubs in Mozambique, Madagascar, and Kenya are eyeing a potential annual supply by 2031, contingent on permitting and ESG compliance. India is carving out a larger share, driven by tile exports and investments in nuclear alloys. On the other hand, while Russia's emphasis on baddeleyite bolsters its internal security, it curtails its global outreach.
Market Concentration
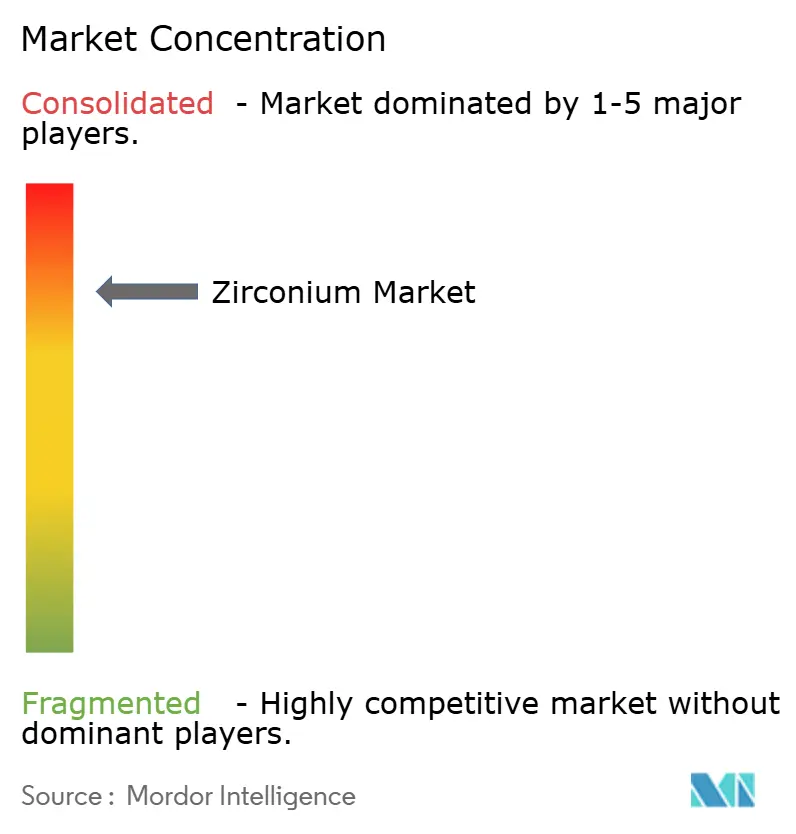
The Zirconium market is consolidated. In 2025, key upstream players such as Iluka Resources, Tronox Holdings, Rio Tinto, Kenmare Resources, and Base Resources collectively dominated the zircon concentrate output. Their operations, spanning Australia, Africa, and the United States, provide buyers with ample flexibility. However, in a strategic move to enhance prices, miners are selectively reducing outputs. For instance, Kenmare has adjusted its 2026 guidance, underscoring a philosophy of "value over volume." On the midstream front, leading producers of zirconium oxychloride in China command the domestic market, leaving Western ceramics and alloy manufacturers susceptible to policy changes.
The trend of vertical integration is on the rise. In February 2026, Energy Fuels made headlines by acquiring Australian Strategic Materials, gaining expertise in dehafniated zirconium metal. At the same time, Chemours cemented its position with a partnership aimed at bolstering domestic processing in Utah. Iluka made a significant investment in upgrading its Moma concentrator, securing a dominant feedstock position for the foreseeable future. Tronox is fine-tuning its operations by capitalizing on its in-house titanium dioxide capacity. Technological innovations are emerging as key differentiators: Noram's pioneering closed-loop sand recycling technique promises to curtail virgin demand. Meanwhile, Australian Strategic Materials' pilot plant has achieved a hafnium content of under one weight percent, meeting stringent aerospace and nuclear standards, distinguishing them from numerous non-Chinese rivals.
Procurement strategies are evolving: Western buyers are locking in multi-year contracts with miners in Australia, Mozambique, and Madagascar, often at a premium to Chinese spot prices, highlighting their emphasis on security. In parallel, Chinese refiners are advancing upstream, integrating into products such as battery-grade LLZO powders, further cementing their domestic value retention. The zirconium landscape is gearing up for heightened consolidation, with miners eyeing specialty refiners to enhance downstream margins and navigate tariff-induced market fluctuations.

*Disclaimer: Major Players sorted in no particular order
1. Introduction
2. Research Methodology
3. Executive Summary
4. Market Landscape
5. Market Size and Growth Forecasts (Volume)
6. Competitive Landscape
7. Market Opportunities and Future Outlook
Zirconium is a grayish-white metal with a wide range of industrial, commercial, and scientific applications. It is the 20th most abundant element in the Earth's crust. It commonly occurs as the mineral zircon (ZrSiO4) in a silicate form. It is less frequently available as the mineral baddeleyite (natural zirconia or ZrO2) in an oxide form.
The zirconium market is segmented by occurrence type, application, and geography. By occurrence type, the market is segmented into zircon, zirconia, and other occurrence types. By application, the market is segmented into zircon flour/milled sand, zircon opacifier, refractories (zirconia), zircon chemicals, and zircon metal and alloys. The report also covers the market size and forecasts for zirconium in 10 countries across major regions. For each segment, the market sizing and forecasts have been done on the basis of volume (tons).
Strategic Expansion of Floor Coatings in the MEIA Region
4 Min Read
Unlocking Supplier Partnerships in the Africa Lubricants Market
5 Min Read
Deep-Dive Analysis of Feed Probiotics Across Key Regions
5 Min Read
When decisions matter, industry leaders turn to our analysts. Let’s talk.