
Wireless Mesh Networking Market Size and Share
Market Overview
| Study Period | 2020 - 2031 |
|---|---|
| Market Size (2026) | USD 11.31 Billion |
| Market Size (2031) | USD 17.23 Billion |
| Growth Rate (2026 - 2031) | 8.78 % |
| Fastest Growing Market | Asia Pacific |
| Largest Market | North America |
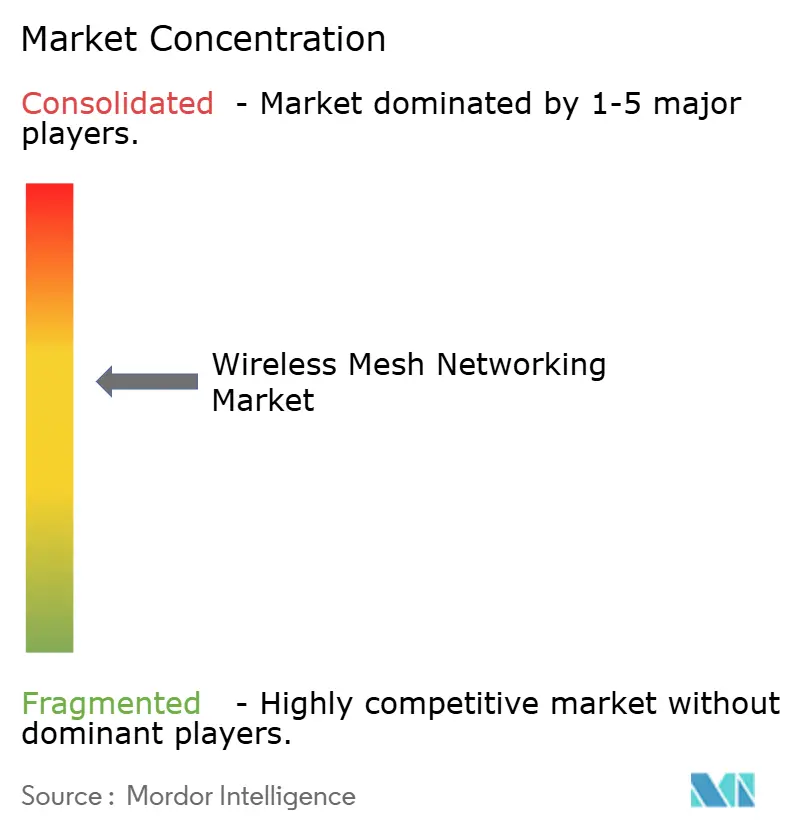
| Market Concentration | Medium |
Major Players *Disclaimer: Major Players sorted in no particular order Image © Mordor Intelligence. Reuse requires attribution under CC BY 4.0. | |
Wireless Mesh Networking Market Analysis by Mordor Intelligence
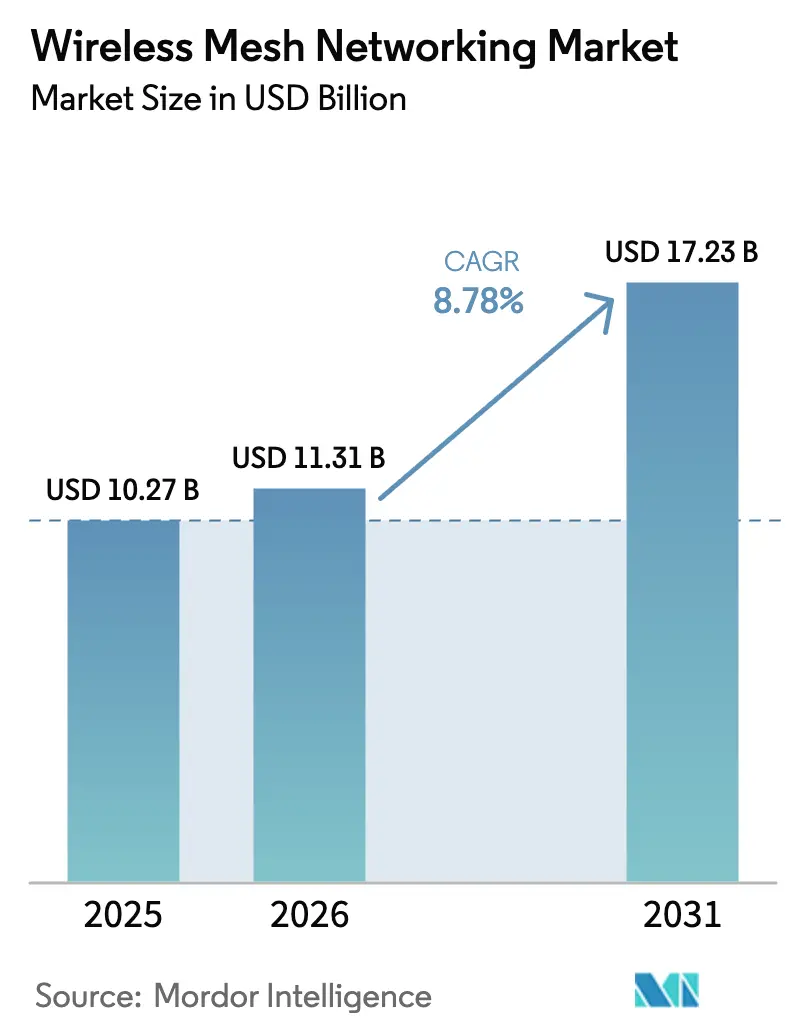
The wireless mesh networking market size was valued at USD 10.27 billion in 2025 and is estimated to grow from USD 11.31 billion in 2026 to reach USD 17.23 billion by 2031, at a CAGR of 8.78% during the forecast period (2026-2031). Digital equity programs, Industry 4.0 automation, and public safety modernization together underpin near-term growth. Municipal broadband grants in the United States, Canada, and Europe are funding mesh backhaul, while Wi-Fi 7 certification is doubling outdoor node capacity in the 6 GHz band, enabling more than 100 concurrent clients per hop. Industrial operators are shifting from wired fieldbus to 5 GHz and sub-1 GHz mesh to support autonomous mobile robots and asset tracking, and public-safety agencies are layering IP-based mesh over nationwide broadband networks to ensure resilient voice, video, and data links in disaster scenarios. Competitive differentiation now hinges on software-defined radios, open routing stacks, and hybrid cellular-mesh enclosures that reduce the total cost of ownership for municipalities, factories, and first responders.
Key Report Takeaways
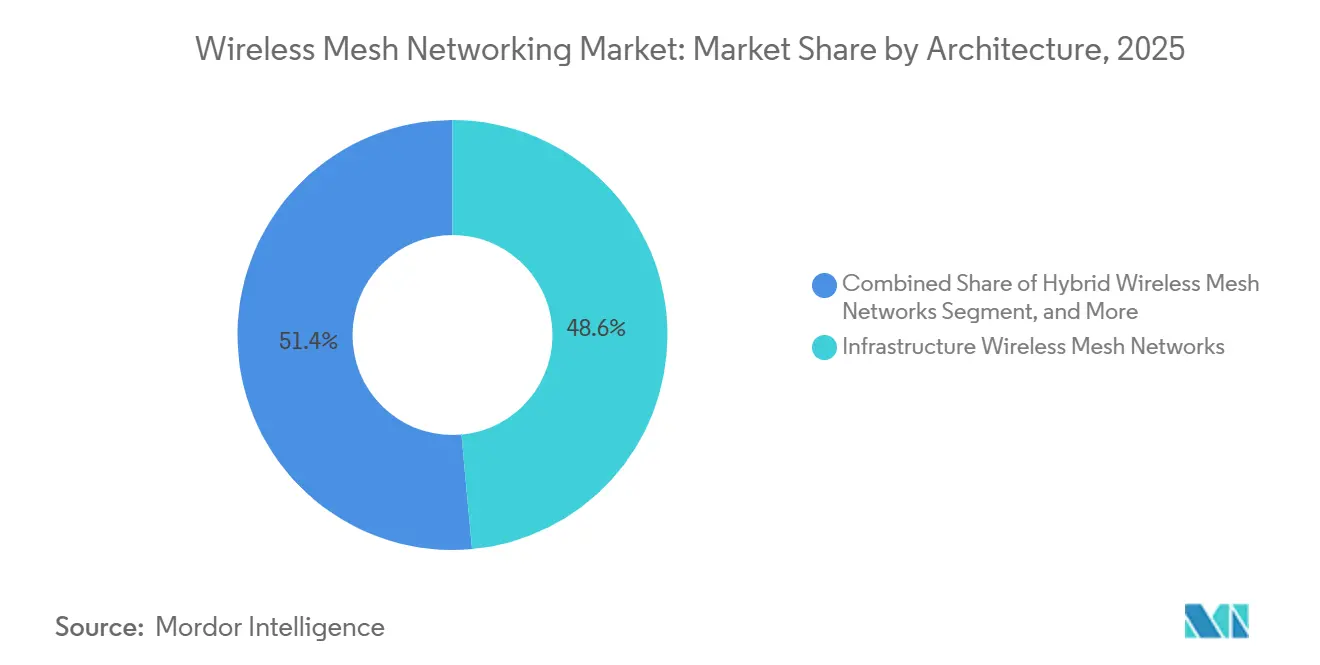
- By architecture, infrastructure-class topologies led with 48.56% Wireless Mesh Networking market share in 2025, while hybrid deployments are forecast to expand at a 9.34% CAGR between 2026 and 2031.
- By radio frequency, the 2.4 GHz band captured 42.38% of the Wireless Mesh Networking market size in 2025, and the 5 GHz band is pacing at a 9.56% CAGR through 2031.
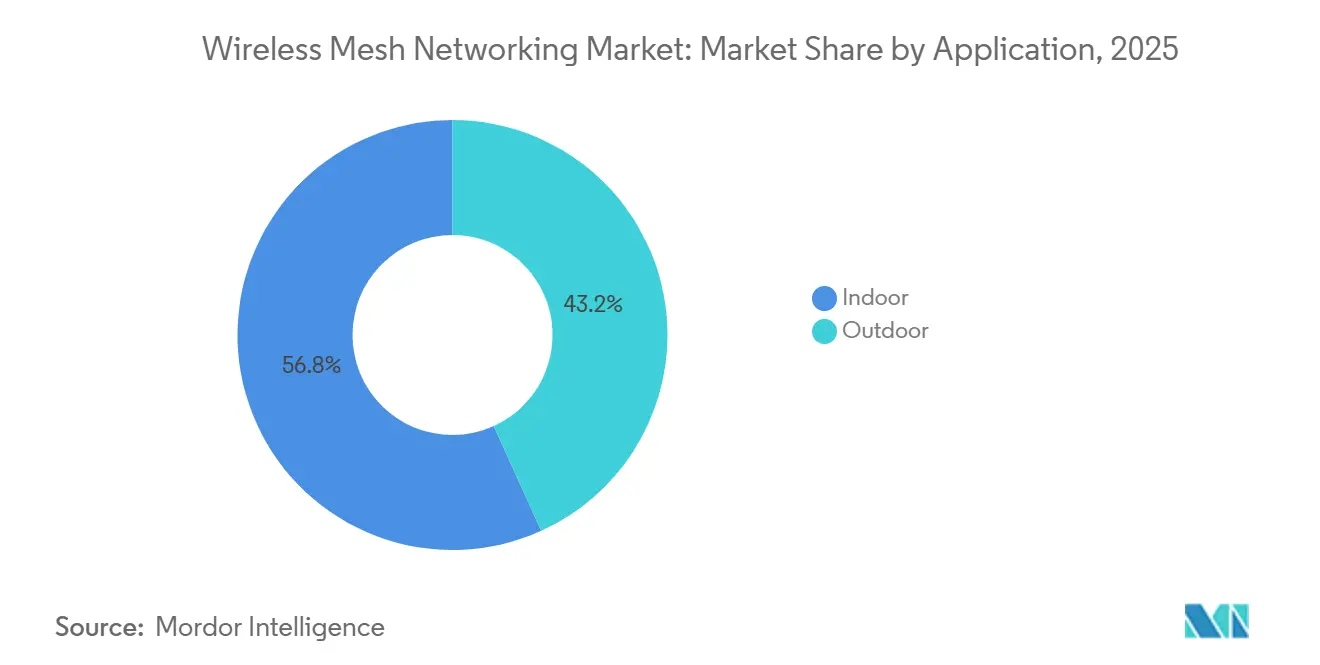
- By application, indoor installations accounted for 56.77% of the Wireless Mesh Networking market size in 2025, whereas outdoor nodes are advancing at an 8.91% CAGR through 2031.
- By end-user, government agencies commanded 24.83% of the Wireless Mesh Networking market share in 2025, while smart-city and smart-warehouse rollouts are poised for a 10.36% CAGR through 2031.
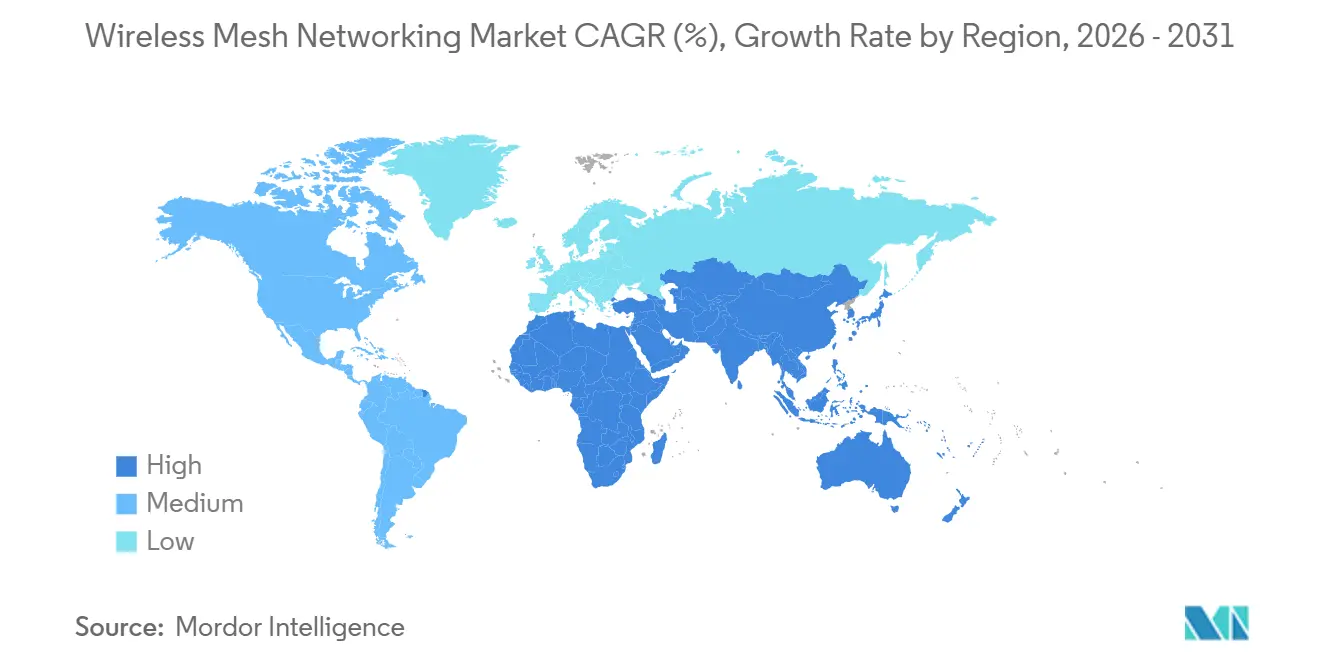
- By geography, North America held 36.92% of the Wireless Mesh Networking market share in 2025, and Asia-Pacific is projected to be the fastest-growing region at 9.82% through 2031.
Note: Market size and forecast figures in this report are generated using Mordor Intelligence’s proprietary estimation framework, updated with the latest available data and insights as of January 2026.
Market Trends and Insights
Drivers Impact Analysis of Wireless Mesh Networking Market*
| Driver | (~) % Impact on CAGR Forecast | Geographic Relevance | Impact Timeline |
|---|---|---|---|
| Increasing Adoption of Smart City Infrastructure | +1.8% | Global, with concentration in Asia-Pacific (China, India, South Korea) and North America secondary cities | Medium term (2-4 years) |
| Growth of Industrial IoT Deployments | +1.5% | North America and Europe manufacturing hubs, Asia-Pacific electronics and automotive clusters | Medium term (2-4 years) |
| Rising Demand for Reliable Public Safety Communications | +1.2% | North America (FirstNet expansion), Europe (TETRA evolution), Middle East | Long term (≥ 4 years) |
| Rapid Evolution of Wi-Fi 6 and Wi-Fi 7 Standards | +1.4% | Global, with early adoption in North America enterprise and Asia-Pacific consumer segments | Short term (≤ 2 years) |
| Emergence of Battery-Free, Energy-Harvesting Mesh Nodes | +0.9% | Europe industrial sites, Asia-Pacific smart agriculture, North America remote monitoring | Long term (≥ 4 years) |
| Municipal Broadband Stimulus Grants in Secondary Cities | +1.1% | United States (BEAD program), Canada (Universal Broadband Fund), select European Union member states | Medium term (2-4 years) |
| Source: Mordor Intelligence | |||
Increasing Adoption of Smart City Infrastructure
City planners now embed mesh radios in streetlights, traffic signals, and utility cabinets to backhaul surveillance cameras, air-quality sensors, and public Wi-Fi portals. Melbourne demonstrated payback within 18 months by lowering truck rolls and optimizing refuse collection routes.[1]City of Melbourne, “Smart City IoT Network Deployment,” MELBOURNE.VIC.GOV.AU Calgary extended gigabit connectivity to parks and transit shelters through Cisco Ultra-Reliable Wireless Backhaul, proving that mesh can complement rather than replace fiber. However, a National Institute of Standards and Technology survey of 42 pilots found that proprietary APIs hinder cross-vendor interoperability.
Growth of Industrial IoT Deployments
Manufacturers are swapping Ethernet drops for Wi-Fi 6 mesh to support mobile robots and location systems. A German automotive plant cut unplanned downtime by 30% after installing 200 access points with time-sensitive networking extensions.[2]Siemens, “Industrial Wireless Mesh Networks for Manufacturing,” SIEMENS.COM WirelessHART’s channel hopping secures 99.9% reliability in heavy-interference settings. Decentralized protocols such as Wirepas Mesh have enabled 50,000 pallet trackers to operate without line-of-sight infrastructure across European logistics hubs.
Rising Demand for Reliable Public Safety Communications
Despite nationwide LTE coverage, rural and in-building coverage gaps persist, prompting fire departments to overlay mesh networks for fail-safe data connectivity. Los Angeles first responders now stream helmet-cam video and building blueprints during fires, trimming response times by 90 seconds.[3]Motorola Solutions, “Public Safety Mesh Radio Systems,” MOTOROLASOLUTIONS.COM European agencies are actively trialing mesh overlays as part of their efforts to migrate from TETRA voice systems to broadband data services. This transition aims to enhance communication capabilities and support advanced data-driven applications.
Rapid Evolution of Wi-Fi 6 and Wi-Fi 7 Standards
Wi-Fi 7 certification in 2024 ushered in multi-link capability across 2.4, 5, and 6 GHz, tripling aggregate throughput and halving latency. Consumer systems hit 5.8 Gbps backhaul between nodes, while enterprise-class access points recorded 40% lower packet loss under congestion. By 2028, IEEE is set to introduce Wi-Fi 8, which will feature coordinated spatial reuse and advanced beamforming capabilities. These advancements aim to enhance network efficiency, improve data transmission rates, and optimize the use of available spectrum, addressing the growing demand for high-speed and reliable wireless connectivity.
Restraints Impact Analysis of Wireless Mesh Networking Market*
| Restraint | (~) % Impact on CAGR Forecast | Geographic Relevance | Impact Timeline |
|---|---|---|---|
| Security Vulnerabilities in Multi-Hop Topologies | -0.6% | Global, with heightened concern in government and healthcare verticals | Short term (≤ 2 years) |
| Lack of Interoperability Across Vendor Protocols | -0.5% | Global, particularly affecting Industrial IoT and smart city deployments | Medium term (2-4 years) |
| Tightening Municipal Aesthetic Regulations on Pole-Mounted Nodes | -0.3% | North America and Europe urban centers, historic districts | Long term (≥ 4 years) |
| Spectrum Re-Farming Pressures from 6 GHz Indoor-Only Policies | -0.4% | Global, with immediate impact in regions enforcing Automated Frequency Coordination | Short term (≤ 2 years) |
| Source: Mordor Intelligence | |||
Security Vulnerabilities in Multi-Hop Topologies
Each node doubles as a router, enlarging the attack surface. NIST warns that perimeter defenses are insufficient because an infiltrated relay can intercept or drop packets undetected. A Zyxel firmware flaw disclosed in 2024 affected 100,000 consumer mesh kits and allowed remote code execution. Academic researchers also showed that mixed WPA2 and WPA3 clients enable downgrade attacks, forcing nodes to weaker encryption. Buyers now demand FIPS 140-3-validated cryptographic modules, which are raising deployment costs.
Lack of Interoperability Across Vendor Protocols
Thread, Zigbee, and proprietary stacks coexist without a common application layer. As a result, integrators must deploy multiple gateways, which inflates the bill of materials. The Matter standard seeks to bridge this divide, yet early adoption is slow because legacy devices cannot be retrofitted. Industrial sites face similar fragmentation among WirelessHART, ISA100.11a, and vendor-specific solutions. Although IEEE 802.11s defines mesh peering for Wi-Fi, it remains confined to enterprise WLAN products.
*Our forecasts treat driver/restraint impacts as directional, not additive. The impact forecasts reflect baseline growth, mix effects, and variable interactions.
Wireless Mesh Networking Market Segment Analysis
By Architecture:
Infrastructure Dominates, Hybrid Gains ResilienceInfrastructure nodes captured 48.56% of the Wireless Mesh Networking market share in 2025, underscoring customer preference for centralized control, RADIUS authentication, and SNMP-based performance monitoring. This architecture shortens provisioning cycles through zero-touch configuration and artificial-intelligence radio optimization. Large municipalities gravitate toward controllers to enforce quality-of-service policies for video backhaul and public Wi-Fi, while defense agencies value deterministic latency for mission-critical traffic.
Hybrid topologies are growing at a 9.34% CAGR because they blend gateway and peer-to-peer routing, allowing field devices to detour around congested gateways during outages. Mining trucks equipped with Rajant Kinetic Mesh hand off sessions at vehicular speeds, and port operators maintain connectivity across cranes, carriers, and guided vehicles without line-of-sight infrastructure. The Wireless Mesh Networking market size for hybrid deployments is set to widen as factories retrofit older infrastructure with edge gateways that speak both Enterprise WLAN and peer-to-peer.



By Radio Frequency:
2.4 GHz Leads, 5 GHz AcceleratesThe 2.4 GHz band accounted for 42.38% of 2025 revenue, thanks to deep penetration, a legacy sensor base, and global license-exempt status. Utilities string 2.4 GHz nodes on power poles for distribution-automation telemetry, and agricultural cooperatives blanket orchards with 2.4 GHz sensors that punch through dense foliage. However, channel congestion remains acute because only three non-overlapping channels exist in most regions.
Wi-Fi 6E and Wi-Fi 7 upgrades are pushing the 5 GHz band toward a 9.56% CAGR. Warehouses adopt 80 MHz and 160 MHz channels for autonomous robots that need sub-10 millisecond latency. In contrast, sub-1 GHz LoRaWAN mesh connects meters and irrigation valves across 10-kilometer ranges with milliwatt power budgets. The Wireless Mesh Networking market in the 5 GHz band is expanding rapidly as outdoor access points adopt 10-gigabit Ethernet and GPS-timed synchronization for industrial automation.
By Application:
Indoor Installations Lead, Outdoor Use Cases SurgeIndoor installations accounted for 56.77% of deployments in 2025, supported by Power-over-Ethernet access points across offices, hospitals, and campuses. Healthcare facilities prize redundant indoor mesh networks to ensure telemetry for infusion pumps, telehealth carts, and nurse-call systems, achieving 5-nines uptime without the expense of wired expansion. Moreover, integrated Bluetooth radios allow asset tracking within surgical wards and supply closets.
Outdoor nodes are growing at an 8.91% CAGR as smart-city planners blanket parks, bus corridors, and underserved neighborhoods. Cambium IP67-rated radios span 10-kilometer backhaul distances, linking wind farms and remote oil wells where fiber is infeasible. The Federal Communications Commission’s 6 GHz indoor-only ruling pushes municipalities toward 5 GHz for short-term projects, yet Automated Frequency Coordination tools are lowering the compliance barrier for rural standard-power 6 GHz mesh.
By End-User:
Government Anchors, Smart Cities AccelerateGovernment entities accounted for 24.83% of 2025 revenue from public-safety upgrades, municipal broadband, and defense perimeter networks. The Department of Defense has equipped fifteen bases with mesh radios to enhance security and operational efficiency. This initiative secures perimeter sensors and surveillance cameras without requiring the installation of fiber through trenching. The use of mesh radios also enables rapid reconfiguration of the system during drills, ensuring adaptability and improved response capabilities in dynamic scenarios.
Smart-city and smart-warehouse deployments will rise at a 10.36% CAGR as logistics operators embrace mesh-enabled robots and planners embed radios in streetlight poles. Amazon Robotics runs Zebra mesh across 200,000 robots, turning fulfillment centers into adaptive, data-rich environments. The Wireless Mesh Networking market size for smart-city deployments benefits from lamppost retrofits that integrate traffic cameras, air-quality nodes, and public Wi-Fi on a shared backhaul.
Geography Analysis
North America Wireless Mesh Networking Market
North America accounted for 36.92% of revenue in 2025, buoyed by USD 42.45 billion in BEAD grants that fund mesh for unserved census blocks. Over 30 states now allow wireless mesh in their broadband RFPs, accelerating rollouts in rural plains and Appalachian foothills. Canada’s CAD 1.75 billion (USD 1.29 billion) Universal Broadband Fund similarly backs hybrid fiber-mesh builds to First Nations communities.
APAC Wireless Mesh Networking Market
Asia-Pacific is set for a 9.82% CAGR through 2031. China mandates mesh in new industrial parks, and Shenzhen’s citywide network integrates traffic cameras, air-quality probes, and public Wi-Fi across 6 GHz and 5 GHz spectrum. India’s Smart Cities Mission is financing 100 outdoor mesh networks for bus corridors, digital-literacy centers, and city parks. Japan’s Society 5.0 program and South Korea’s KRW 150 billion (USD 113 million) budget support smart factories and disaster-resilient communities, while Australia’s Regional Connectivity Program subsidizes rural mesh networks that connect agricultural co-ops to fiber backbones.
Europe, Middle East and South America Wireless Mesh Networking Market
Europe sustains its share through Industry 4.0 pilots in Germany and France, where manufacturers run time-sensitive Wi-Fi 6 mesh networks for robotic cells. The United Kingdom’s GBP 200 million (USD 254 million) Gigabit program taps mesh to bridge last-mile gaps in moors and fells. The Middle East deploys explosion-proof mesh in oilfields, and Saudi Arabia’s Vision 2030 earmarks smart-city spend in NEOM and Riyadh. South American miners in Chile and Brazil outfit underground tunnels with mesh to telemeter autonomous haul trucks, while Argentina auctions 5 GHz for fixed-wireless and mesh broadband.
Mordor Intelligence provides coverage of the wireless mesh networking market across other key regional markets, including South America, each with their regulatory frameworks and demand patterns.

Regulatory Landscape
Wireless mesh networking deployments are shaped by unlicensed spectrum access and equipment conformity requirements, particularly for 6 GHz operations. In the United States, the FCC adopted rules permitting very low power (VLP) devices in the 6 GHz band (U-NII-5 and U-NII-7) in 2024, with equipment authorization through Telecommunication Certification Bodies, a gate for Wi-Fi 6E/7 mesh nodes and backhaul radios.
In Europe, 6 GHz RLAN use is governed by Commission Implementing Decision (EU) 2021/1067, with technical compliance guided by ETSI EN 303 687, which sets requirements for both ad-hoc and infrastructure networking. At the international coordination layer, ITU-R updated Recommendation F.1763-2 in February 2026 to reflect current radio interface standards for broadband wireless access in the fixed service, a reference frame administrations and vendors use when aligning product roadmaps and compliance claims across regions.
Value Chain Analysis
The value chain starts with silicon and RF component suppliers providing Wi-Fi, sub-1 GHz, and specialized mesh-capable SoCs and front ends, and then moves to firmware and connectivity stacks that implement routing, security, and provisioning. This layer also includes protocol and software providers such as Wirepas, along with interoperability efforts shaped by industry bodies like the Wi-Fi Alliance (Wi-Fi CERTIFIED EasyMesh) and the Wi-SUN Alliance.
Device OEMs and ruggedized-equipment manufacturers then integrate radios, antennas, and enclosures for indoor enterprise and outdoor or industrial nodes, and distribute through distributors, system integrators, and managed service providers that design RF plans, install nodes, and operate cloud or controller-based management. Utility and industrial rollouts show how demand pulls through components and modules, with Silicon Labs and Wirepas reporting a 10 million SoC shipment milestone running Wirepas RF mesh software (June 2025), and India-specific AMI deployments citing millions of smart meters using Wirepas Mesh.
Competitive Landscape
The Wireless Mesh Networking market is moderately fragmented. Cisco and Hewlett-Packard Enterprise leverage extensive WLAN footprints to deploy mesh controllers that interoperate with legacy switches and policy engines, thereby lowering switching costs for customers. Motorola Solutions and Cambium Networks focus on ruggedized nodes that sustain vehicular handoff across mines, transit fleets, and incident-response vehicles.
Rajant’s InstaMesh eliminates single points of failure, appealing to defense and mining clients that need autonomous, infrastructure-less operation. Patent filings on predictive routing and dynamic spectrum allocation indicate continued investment in artificial intelligence. Chipset vendors, notably Qualcomm and Qorvo, now hard-code mesh routing into Wi-Fi 7 SoCs, shrinking bill-of-material costs and enabling white-box original equipment manufacturers to enter quickly.
Open-standard momentum is rising. The Wi-Fi Alliance expanded EasyMesh to outdoor nodes, enabling integrators to mix hardware from multiple suppliers. New entrants such as Wirepas and Digi International court Internet of Things buyers with decentralized meshes that sidestep gateway licensing. As procurement teams seek vendor-agnostic stacks, software-defined radios, and open routing protocols, these factors are becoming decisive in future bids.
Wireless Mesh Networking Industry Leaders
Cisco Systems, Inc
Hewlett Packard Enterprise
Motorola Solutions
ABB Ltd
Cambium Networks
- *Disclaimer: Major Players sorted in no particular order
Wireless Mesh Networking Market Companies Covered in this Report
- Cisco Systems, Inc
- Hewlett Packard Enterprise
- Motorola Solutions
- ABB Ltd
- Cambium Networks
- Rajant Corporation
- Ruckus Networks (CommScope)
- Synapse Wireless
- Strix Systems
- Firetide Inc.
- BelAir Networks
- Wirepas Oy
- Fluidmesh Networks
- Zebra Technologies
- Digi International
- Qorvo, Inc.
- Qualcomm Technologies
- Ubiquiti Inc.
- Unicom Systems
- General Dynamics Mission Systems
- SCAN RF Projects

Market Opportunities and Future Outlook
A key whitespace is the combination of utility-grade interoperability and deployment economics, where standardized field-area mesh reduces integration friction across meters, routers, and head-end systems. Standardization also drives procurement certainty, including the Wi-SUN Field Area Network (FAN) specification ratified as ISO/IEC/IEEE 32857:2026 (July 2026), and module shipments that tie back to smart grid rollouts, including Comminent shipping more than 500,000 Wi-SUN compliant communication modules powered by Silicon Labs (May 2026).
An additional opportunity centers on higher-throughput outdoor and campus backhaul that leverages the 6 GHz band as operating flexibility and compliance tooling expand. In the United States, the FCC made Geofenced Variable Power (GVP) rules effective on April 27, 2026, enabling higher-power 6 GHz operation within defined constraints, and it also progressed work on how Automated Frequency Coordination models can incorporate building entry loss (Third Further Notice of Proposed Rulemaking, February 2026). Together, these steps support packaging of AFC-ready outdoor mesh, hybrid fiber-mesh builds for municipal broadband programs, and Wi-Fi 7-era node upgrades that respond to congestion and aesthetic constraints through fewer, higher-capacity hops with tighter policy control.
Recent Industry Developments in Wireless Mesh Networking Market
- May 2026: Hewlett Packard Enterprise announced new self-driving network capabilities across HPE Mist and HPE Aruba Central that use an agentic mesh architecture to automate operations. The update targets AI-native management of distributed wireless networks, aligning enterprise and campus deployments with lower manual tuning burdens as mesh footprints grow.
- April 2026: Cisco updated configuration guidance for Catalyst 9800 Series Wireless Controllers covering mesh access point deployments and Radio Resource Management behavior across access point generations. The documentation refresh supports more consistent controller-driven mesh design and troubleshooting, which is central to infrastructure-class rollouts in municipalities and large enterprises.
- March 2025: Cisco highlighted the Catalyst IR8100 Heavy Duty Series Industrial Router as among the first products certified for the Wi-SUN FAN 1.1 standard. The certification anchors interoperable, secure mesh for utility and industrial field networks, reinforcing Wi-SUN based pathways for smart grid and remote operations use cases.


Wireless Mesh Networking Market Report Scope and Research Methodology
Market Definition and Coverage
For this methodology, the wireless mesh networking market is defined as revenues earned from wireless mesh nodes and controllers, plus the related software and services used to build self-forming and self-healing networks across indoor and outdoor sites.
Scope exclusions: This sizing excludes wired-only mesh deployments, pure cellular RAN spending, and general IT services that are not directly tied to mesh network design, supply, or ongoing operations.
Segments Covered in This Report
- By Architecture
- Infrastructure Wireless Mesh Networks
- Hybrid Wireless Mesh Networks
- Client Wireless Mesh Networks
- By Radio Frequency
- Sub-1 GHz Band
- 2.4 GHz Band
- 4.9 GHz Band
- 5 GHz Band
- By Application
- Indoor
- Outdoor
- By End-User
- Government
- Smart Cities and Smart Warehouses
- Healthcare
- Transportation and Logistics
- Oil and Gas
- Mining
- Education
- Hospitality
- By Geography
- North America
- United States
- Canada
- Mexico
- Europe
- Germany
- United Kingdom
- France
- Russia
- Rest of Europe
- Asia-Pacific
- China
- Japan
- India
- South Korea
- Australia
- Rest of Asia-Pacific
- Middle East and Africa
- Middle East
- Saudi Arabia
- United Arab Emirates
- Rest of Middle East
- Africa
- South Africa
- Egypt
- Rest of Africa
- Middle East
- South America
- Brazil
- Argentina
- Rest of South America
- North America
Data Sources, Market Sizing, and Validation
Desk Research
Desk research was used to set the boundaries of what counts as wireless mesh networking, and to anchor the model with repeatable signals that can be checked every year. We relied on public sources such as FCC spectrum and rulemaking materials, NIST cybersecurity guidance, ITU and IEEE Wi-Fi standards documentation, and OECD or World Bank digital infrastructure indicators.
To translate this into market inputs, we also reviewed company filings, investor presentations, earnings call transcripts, trade association publications, and reputable press coverage on smart city connectivity and industrial wireless rollouts. Where needed, a paid subscription for company financials and news was used to normalize revenue lines and remove one-time items, and patent databases were referenced to sense technology shift timing. The sources listed above are illustrative only, and additional public and paid references were used to collect, validate, and clarify assumptions.
Primary Interviews and Surveys
Primary work focused on validating what gets purchased in real deployments, how pricing is negotiated, and which use cases are scaling. We also checked how teams distinguish hardware purchases from software or services tied to managed mesh platforms. We spoke with a mix of solution providers, system integrators, and end-user teams across government, smart city, logistics, and industrial environments, and then used follow-up questions to close gaps around average selling price, node density, and refresh behavior by region.
Distribution of primary research fieldwork respondents
| Company type | Respondent position | Region |
|---|---|---|
| Top tier: 34% | CXOs: 13% | APAC: 44% |
| Mid tier: 50% | Functional/Unit leaders: 29% | EMEA: 34% |
| Smaller Players: 16% | Managers: 58% | Americas: 22% |
Market-Sizing & Forecasting
Market sizing started with a top-down build that reconstructs the addressable demand pool from wireless infrastructure rollouts and mesh-friendly use cases, and then applies adoption and pricing assumptions to arrive at value. The totals were then corroborated with selective bottom-up checks, including sampled product ASP times estimated shipment volumes for key node types, plus channel feedback on typical project sizes, which were used to adjust outliers.
Inputs used in the model included indicators such as smart city and public safety network expansion, industrial site connectivity upgrades tied to automation, outdoor versus indoor deployment mix, radio band preferences by use case, and typical node density per site, especially for campuses and warehouses. Pricing logic was handled through a practical ASP progression, where hardware ASPs are adjusted for feature shifts like Wi-Fi 6 and Wi-Fi 7 readiness and for the growing software share in managed mesh platforms.
For forecasting, scenario analysis was used so the base case reflects expected procurement cycles, funding availability for municipal programs, and industrial capital spending sensitivity. When bottom-up visibility was weak for smaller projects, gaps were filled using region-level deployment counts and conservative assumptions on node count per project, followed by expert validation to keep the result realistic.
Data Validation & Update Cycle
Outputs were cross-checked against independent signals such as regional wireless infrastructure spend direction, public sector tender activity, and observed pricing ranges reported by implementers. When large variances appeared, we reviewed the assumptions behind adoption, node density, and ASP progression again, and we ran clarification interviews for the specific end-user group or geography.
Before sign-off, the model goes through multi-step analyst review so arithmetic, currency treatment, and scope boundaries are consistent across years. Reports are refreshed annually, with interim updates when material events occur, such as major standards transitions or sudden policy changes. Right before delivery, a final freshness check is completed so clients receive the latest updated view.
Mordor Intelligence's Wireless Mesh Networking Market Size Compared With Other Published Estimates
Published market sizes for wireless mesh networking can differ even when the topic name looks identical, because the counted scope and the timing assumptions are rarely aligned. Differences usually come from what is included as mesh networking, for example hardware only versus hardware plus software and services, and from how quickly pricing and deployment mix are allowed to change in the forecast.
A refresh-led gap is also common, since currency conversion timing, ASP updates for Wi-Fi generation shifts, and late-year project wins can move the current-year value meaningfully when the model is re-run. By keeping currency timing consistent, re-checking ASP movement through primary quotes, and re-validating the indoor versus outdoor mix during updates, Mordor Intelligence reduces drift that can build up when older price points and untested penetration assumptions are carried forward.
Benchmark comparison
| Source | Market Size | Gaps in Research Methodology |
|---|---|---|
| Mordor Intelligence | USD 11.31 B (2026) | |
| Global Research Publisher A | USD 11.25 B (2026) | Often uses a broad revenue definition that can pull in adjacent connectivity components and related services differently, and the update timing for currency and late-year contracts may not be clearly stated. |
| Global Consultancy B | USD 7.19 B (2025) | Uses an earlier base year and a different starting point, which can understate the impact of recent smart city and industrial rollouts, and may apply a more conservative ASP progression into the base year. |
The comparison shows that the spread is mainly explained by base-year selection, what gets counted inside the market boundary, and how quickly pricing and mix assumptions are refreshed. Our approach stays traceable because the total is tied back to clear demand signals, practical adoption steps, and ASP checks that can be repeated during each annual refresh.


Key Questions Answered in the Report
How large is the Wireless Mesh Networking market today?
The Wireless Mesh Networking market size reached USD 11.31 billion in 2026 and is expected to climb to USD 17.23 billion by 2031.
What CAGR is projected for global revenues through 2031?
Global revenues are forecast to expand at an 8.78% CAGR during 2026-2031.
Which architecture currently dominates deployments?
Infrastructure-class mesh accounts for 48.56% of Wireless Mesh Networking market share in 2025, favored for centralized control and deterministic latency.
Which frequency band is growing the fastest?
The 5 GHz band is advancing at a 9.56% CAGR as Wi-Fi 6E and Wi-Fi 7 access points multiply in warehouses and healthcare campuses.
Which region offers the highest growth prospects?
Asia-Pacific is set to grow at 9.82% through 2031, driven by industrial mandates in China and smart-city funding in India.
What is the main security concern with multi-hop meshes?
Compromised intermediate nodes can intercept or alter traffic, prompting agencies to mandate FIPS 140-3 encryption and zero-trust designs.
Page last updated on:





