Wind Turbine Tower Market Size and Share
Market Overview
| Study Period | 2021 - 2031 |
|---|---|
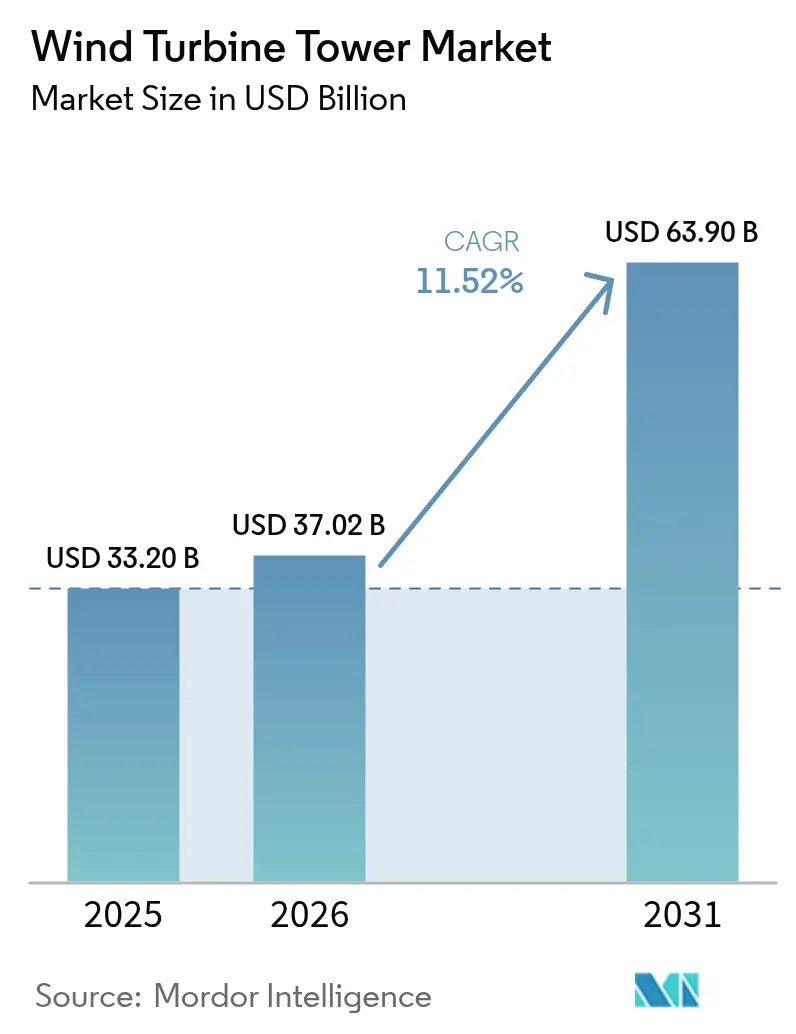
| Market Size (2026) | USD 37.02 Billion |
| Market Size (2031) | USD 63.9 Billion |
| Growth Rate (2026 - 2031) | 11.52% CAGR |
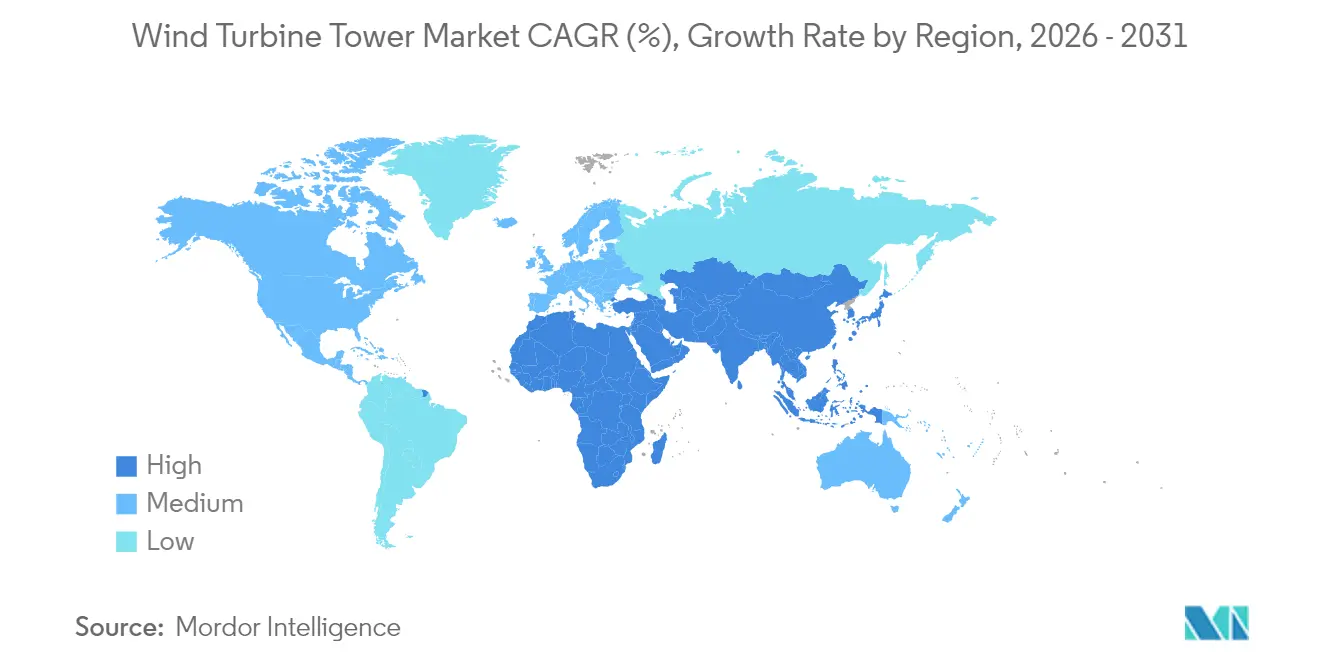
| Fastest Growing Market | Middle East and Africa |
| Largest Market | Asia Pacific |
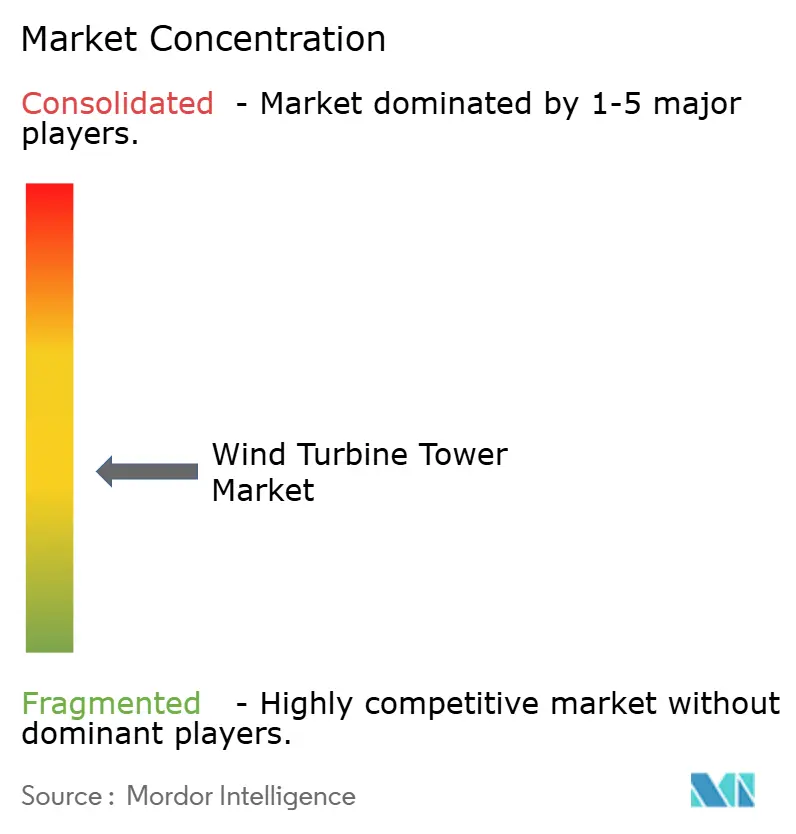
| Market Concentration | Medium |
Major Players *Disclaimer: Major Players sorted in no particular order Image © Mordor Intelligence. Reuse requires attribution under CC BY 4.0. | |
Wind Turbine Tower Market Analysis by Mordor Intelligence
The Wind Turbine Tower market size is expected to grow from USD 33.20 billion in 2025 to USD 37.02 billion in 2026 and is forecast to reach USD 63.9 billion by 2031 at 11.52% CAGR over 2026-2031.
Rapid adoption of towers taller than 160 m, growing hybrid steel-concrete architectures that cut logistics and material costs, and on-site 3D-printed concrete solutions that bypass transport limits are reshaping the competitive field. Localization policies under the United States’ Inflation Reduction Act (IRA) and the European Union’s Carbon Border Adjustment Mechanism redirect global supply chains toward domestic content and low-emission steel. Asia-Pacific retains cost leadership through vertically integrated manufacturing, while the Middle East and Africa record the fastest capacity build-out as sovereign wealth funds bankroll first-wave wind programs. Technology convergence—exemplified by OEMs integrating tower fabrication to secure supply and by heavy-lift logistics innovators targeting 105 m blades—continues to redefine market boundaries.
Key Report Takeaways
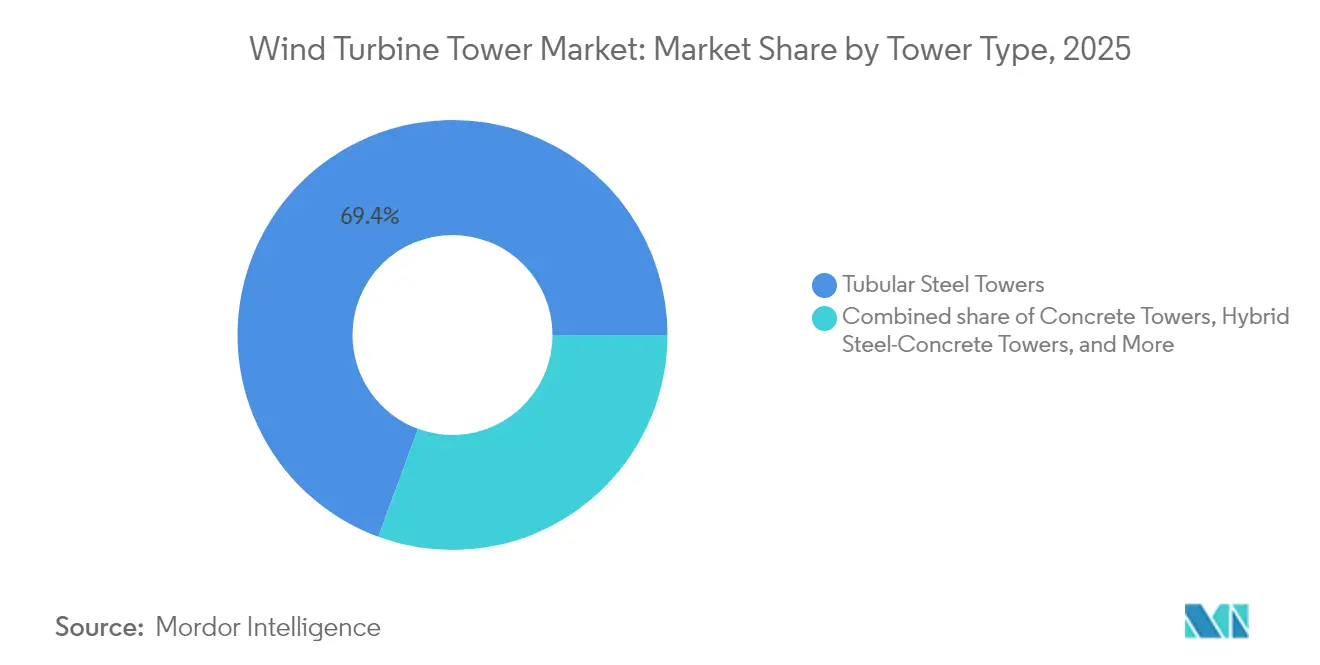
- By tower type, tubular steel led with 69.40% of the wind turbine tower market share in 2025, whereas hybrid steel-concrete towers are forecast to grow at a 12.68% CAGR through 2031.
- By deployment, onshore held 79.30% of the wind turbine tower market size in 2025, while offshore floating platforms are advancing at a 27.35% CAGR to 2031.
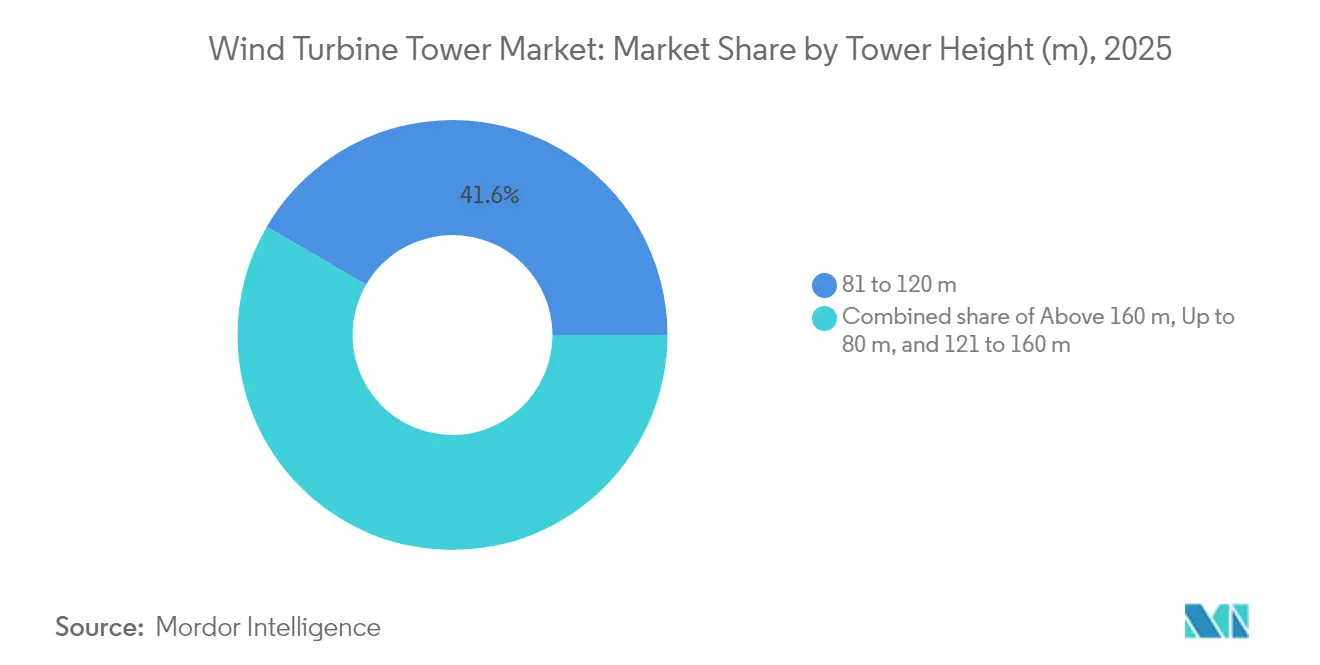
- By height, the 81–120 m segment accounted for a 41.60% share of the wind turbine tower market size in 2025; towers above 160 m deliver the highest growth at 12.88% CAGR.
- By geography, Asia-Pacific commanded 42.70% of 2025 revenue, and the Middle East and Africa wind turbine tower market is expanding at 22.90% CAGR through 2031.
Note: Market size and forecast figures in this report are generated using Mordor Intelligence’s proprietary estimation framework, updated with the latest available data and insights as of 2026.
Global Wind Turbine Tower Market Trends and Insights
Drivers Impact Analysis*
| Driver | (~) % Impact on CAGR Forecast | Geographic Relevance | Impact Timeline |
|---|---|---|---|
| IRA-Driven Localization of >100 m Steel Tower Manufacturing Capacity in the United States | 1.70% | North America, with spillover to Canada and Mexico | Medium term (2-4 years) |
| Permitting Reforms Enabling >160 m Towers in Germany & the Nordics | 1.30% | Europe, primarily Germany, Denmark, Sweden, Norway | Short term (≤ 2 years) |
| Hybrid Steel-Concrete Towers Cutting LCoE for Low-Wind Inland Sites in India & China | 2.00% | Asia-Pacific core, with adoption spreading to Southeast Asia | Medium term (2-4 years) |
| EU Carbon Border Adjustment Accelerating Adoption of Green-Steel Towers | 0.90% | Global, with primary impact in Europe and import-dependent regions | Long term (≥ 4 years) |
| Surging South-Korean & Japanese Offshore Targets for >150 m Corrosion-Resistant Towers | 1.60% | Asia-Pacific, with technology transfer to other offshore markets | Medium term (2-4 years) |
| On-site 3D-Printed Concrete Towers Slashing Logistics Costs in California & Spain Pilots | 1.10% | North America & Europe initially, global scaling potential | Long term (≥ 4 years) |
| Source: Mordor Intelligence | |||
IRA-driven localization of Over 100 m steel tower capacity in the United States
Domestic-content rules embedded in the IRA have triggered USD 2 billion of tower factory announcements across the Midwest, drawing global leaders such as CS Wind and Arcosa into dual-shore production strategies that balance U.S. demand with Asian cost bases.[1]CS Wind Corporation, “Investor Presentation 2025,” cswind.comNew plants are engineered for >120 m sections, eliminating historical import dependence and raising regional competence for ultra-tall designs. Order inflows at Broadwind surged 85% in Q4 2024, demonstrating that localized supply now achieves competitive scale.
Permitting reforms enabling >160 m towers in Germany & the Nordics
Berlin’s 2024 “Onshore Wind Law” cut approval timelines by 40%, unleashing a queue of extreme-height projects, including the 364 m Lusatia installation now operational. Coordinated Nordic height caps allow developers to tap steadier high-altitude winds, compelling OEMs to refine load-management software and noise envelopes on next-generation turbines.[2]PNE Group, “Projects & Pipeline,” pne-ag.com
Hybrid steel-concrete towers cutting LCoE for low-wind inland sites in India & China
Hybrid architecture substitutes a concrete base for 40% of steel, enabling >160 m heights without oversize road freight, thus unlocking marginal inland wind resources. Suzlon’s record 5.1 GW order book—including a 1,166 MW contract from NTPC Green Energy—validates the economics of this design shift. Nordex’s 179 m hybrid model similarly targets Southeast Asian sites where wind speeds average <6 m/s.
EU carbon border adjustment accelerating adoption of green-steel towers
The upcoming levy prices embedded emissions, prompting OEMs and steelmakers to co-develop low-carbon plate. Vestas and ArcelorMittal delivered 66% emissions cuts on Baltic Power prototypes, while Ørsted and Dillinger secured ≥55% reductions for 2027 foundations.
Restraints Impact Analysis*
| Restraint | (~) % Impact on CAGR Forecast | Geographic Relevance | Impact Timeline |
|---|---|---|---|
| Seaborne Logistics Bottlenecks for >15 m-Diameter Tower Sections on U.S. East Coast | -0.90% | North America, particularly US East Coast ports | Short term (≤ 2 years) |
| Volatility in Heavy-Plate Steel Prices Distorting Cost Models | -1.30% | Global, with acute impact in steel-import dependent regions | Medium term (2-4 years) |
| Delayed Type-Certification for Hybrid Towers in Emerging Markets | -0.70% | Emerging markets in Asia-Pacific, Latin America, and Africa | Medium term (2-4 years) |
| Local-Content Quotas Constraining Import of Low-Cost Asian Towers | -1.00% | Global, with varying intensity by country | Long term (≥ 4 years) |
| Source: Mordor Intelligence | |||
Seaborne logistics bottlenecks for >15 m-diameter tower sections on the U.S. East Coast
Jones Act rules limit foreign vessels, creating a scarcity of heavy-lift ships needed for XXL-diameter sections. Port staging yards and crane upgrades lag demand, forcing modular at-sea assembly or floating foundation workarounds that add cost and time.
Volatility in heavy-plate steel prices distorting cost models
Spot plate prices whipsawed ±40% between 2023-2025, eroding the reliability of fixed-price EPC bids. Valmont flagged steel tariffs as a top risk in its 2025 outlook, compelling developers to use index-linked contracts and layered hedges.[3]Valmont Industries, “Q1 2025 Results,” valmont.com
*Our forecasts treat driver/restraint impacts as directional, not additive. The impact forecasts reflect baseline growth, mix effects, and variable interactions.
Segment Analysis
By Tower Type: Hybrid innovation challenges steel dominance
Hybrid steel-concrete towers captured 18.20% of 2025 installations and are forecast to grow 12.68% annually to 2031 as transportation-friendly modules allow >160 m hub heights without escorted road convoys. Concrete savings of up to 40% improve economics, especially in India and China, where local content mandates reward cement sourcing. Nordex’s in-house hybrid line underpins the firm’s largest-ever 179 m tower deployment, while Vestas-backed Modvion’s laminated timber prototype signals a second material revolution beyond steel and concrete. The wind turbine tower market continues to lean on tubular steel for mass production, yet hybrid options are closing the cost gap as raw-plate volatility persists.
OEMs racing toward vertical integration highlight strategic value capture. GE Vernova’s Missouri plant retrofit now outputs flange-ready hybrid sections, shrinking supplier lists and tightening quality control. Independent fabricators respond by upgrading circumferential welding robots and shifting toward corrosion-resistant coatings to defend their share in the wind turbine tower market.


By Deployment: Floating offshore drives next growth wave
Onshore still represented 79.30% of 2025 builds, but floating foundations post a 27.35% CAGR as Japan targets 45 GW by 2040 and South Korea advances a 14-company consortium. Deeper water unlocks class-leading 11–15 m/s wind regimes, translating to higher capacity factors and longer revenue streams. Fixed-bottom offshore projects remain critical near-term, funneling experience and supply chains that derisk floating roll-outs. Saipem7’s EUR 43 billion backlog illustrates how marine EPC consolidation aligns with escalating project scale.
Logistics innovators are redefining deployment segmentation: Radia’s WindRunner aircraft plans to deliver 105-m blades directly to inland plateaus, potentially rebalancing the cost equation between coastal floating farms and high-resource onshore zones. Such advances broaden the addressable opportunity for the wind turbine tower market.
By Tower Height: Ultra-Tall Installations Reshape Economics
The 81–120 m band retained 41.60% of the wind turbine tower market share in 2025, balancing manufacturability and power output, while the above-160 m category recorded 12.88% growth as permitting reform in Europe unlocked extreme-height projects. Germany’s new 364 m prototype confirmed that towers once deemed uneconomic can now operate reliably, signaling a shift in developer risk appetite for taller structures. Installations shorter than 80 m remain confined to repowering or space-restricted sites, and the 121–160 m zone has become the tipping point where hybrid steel-concrete solutions outcompete all-steel designs on cost. Tower height is now tightly linked to wind resource quality because inland, low-wind locations need taller hubs to reach profitable capacity factors.
Regional differences mirror wind profiles and policy frameworks. Europe leads ultra-tall adoption thanks to streamlined approvals and deep supply chains, while Asia-Pacific scales mid-height hybrids for rapid inland rollout. GE Vernova’s 2.7 GW capacity expansion is geared to fabricate longer sections for projects exceeding 160 m, illustrating OEM commitment to the emerging size class. Growth above 160 m still hinges on upgraded roads, rail, and port cranes; limited infrastructure drives demand for modular segments and on-site assembly that lowers transport hurdles. The feedback loop between rising tower height and logistics innovation suggests continued polarization of design strategies at both the sub-80 m and ultra-tall ends of the spectrum, reinforcing diversification within the wind turbine tower market size and technology mix.
Geography Analysis
Asia-Pacific’s 42.70% share in 2025 flowed from China’s giga-scale steel plate mills and India’s rapid hybrid adoption. Yet the spotlight shifts to higher-margin offshore and tall-tower segments as land constraints tighten. Japan’s Round 3 auction launches 1.8 GW of 15 MW class turbines, mandating corrosion-resistant towers that elevate regional average selling prices. Simultaneously, South Korea allocates CAPEX to a 6 GW floating pilot cluster off Ulsan, accelerating demand for 160 m monopiles and 200 m hybrid towers.
Europe leverages regulatory foresight to punch above its weight. Streamlined German permitting shaved 18 months from project cycles, rewarding early movers PNE and RWE. EU carbon-border charges shift procurement towards green steel, letting Vestas lock in low-carbon plate at Baltic Power and Nordlicht. Such sustainability premiums buttress European export competitiveness as the wind turbine tower market globalizes.
The Middle East & Africa grows 22.90% annually from a low base as sovereign funds in Saudi Arabia and the UAE bankroll 1–3 GW clusters integrated with green hydrogen hubs. North America’s IRA-fuelled factory buildout is shrinking import dependence; CS Wind’s Texas ramp-up feeds both U.S. and Latin American demand. South America eyes grid upgrades—Brazil’s northeast state-run transmission plan alone frees 9 GW of interconnection—re-energizing the regional project pipeline.

Competitive Landscape
The wind turbine tower market displays moderate fragmentation: the top five firms held roughly 45% revenue in 2024 as OEMs moved upstream. CS Wind and Titan Wind Energy excel at high-volume steel fabrication, while Vestas and Nordex pursue in-house hybrid lines to de-risk supply. GE Vernova’s 3D-printing alliance with COBOD and LafargeHolcim exemplifies technology-led differentiation that compresses logistics costs for 200 m units.
Strategic partnerships focus on material transitions. Vestas–ArcelorMittal and Ørsted–Dillinger embed low-carbon plate into flagship projects, creating brand equity around emissions intensity. Meanwhile, independent fabricator Windar leverages modular offshore tower kits to circumvent U.S. port constraints, signaling niche opportunities for flexible engineering. Market entry barriers remain moderate: capital outlays for automated rolling and welding lines run USD 120 million, yet software, certification, and logistics expertise increasingly define competitive advantage across the wind turbine tower market.
Wind Turbine Tower Industry Leaders
CS Wind Corporation
Titan Wind Energy
Vestas
Arcosa Wind Towers Inc.
Valmont Industries Inc.
- *Disclaimer: Major Players sorted in no particular order

Recent Industry Developments
- July 2025: ORLEN installed its first Baltic Power turbine, marking Poland’s large-scale wind debut.
- June 2025: ACCIONA Energía commissioned a 280 MW U.S. wind farm, its largest North American asset.
- March 2025: Vestas secured 1,020 MW for Nordlicht 1 in Germany using towers with 16% lower carbon plate.
- February 2025: Saipem and Subsea7 agreed to merge, forming Saipem7 to dominate offshore EPC services.


Global Wind Turbine Tower Market Report Scope
The scope of the wind turbine tower market report includes:
| Tubular Steel Towers |
| Concrete Towers |
| Hybrid Steel-Concrete Towers |
| Lattice Towers |
| Guyed Pole Towers |
| Modular/Stacked Composite Towers |
| Onshore |
| Offshore (Fixed-Bottom) |
| Offshore (Floating) |
| Up to 80 m |
| 81 to 120 m |
| 121 to 160 m |
| Above 160 m |
| North America | United States |
| Canada | |
| Mexico | |
| Europe | Germany |
| United Kingdom | |
| France | |
| Spain | |
| Italy | |
| Russia | |
| Denmark | |
| Sweden | |
| Norway | |
| Rest of Europe | |
| Asia Pacific | China |
| India | |
| Japan | |
| South Korea | |
| ASEAN Countries | |
| Australia | |
| Rest of Asia Pacific | |
| South America | Brazil |
| Argentina | |
| Rest of South America | |
| Middle East and Africa | United Arab Emirates |
| Saudi Arabia | |
| South Africa | |
| Egypt | |
| Rest of Middle East and Africa |
| By Tower Type | Tubular Steel Towers | |
| Concrete Towers | ||
| Hybrid Steel-Concrete Towers | ||
| Lattice Towers | ||
| Guyed Pole Towers | ||
| Modular/Stacked Composite Towers | ||
| By Deployment | Onshore | |
| Offshore (Fixed-Bottom) | ||
| Offshore (Floating) | ||
| By Tower Height (m) | Up to 80 m | |
| 81 to 120 m | ||
| 121 to 160 m | ||
| Above 160 m | ||
| By Geography | North America | United States |
| Canada | ||
| Mexico | ||
| Europe | Germany | |
| United Kingdom | ||
| France | ||
| Spain | ||
| Italy | ||
| Russia | ||
| Denmark | ||
| Sweden | ||
| Norway | ||
| Rest of Europe | ||
| Asia Pacific | China | |
| India | ||
| Japan | ||
| South Korea | ||
| ASEAN Countries | ||
| Australia | ||
| Rest of Asia Pacific | ||
| South America | Brazil | |
| Argentina | ||
| Rest of South America | ||
| Middle East and Africa | United Arab Emirates | |
| Saudi Arabia | ||
| South Africa | ||
| Egypt | ||
| Rest of Middle East and Africa | ||


Key Questions Answered in the Report
What is the projected size of the wind turbine tower market by 2031?
The wind turbine tower market size is forecast to reach USD 63.9 billion by 2031.
Which region is growing fastest for tower installations?
The Middle East and Africa is the fastest, posting a 22.90% CAGR through 2031.
Why are hybrid steel-concrete towers gaining traction?
They enable Above 160 m hub heights while reducing steel use by up to 40%, improving economics on low-wind inland sites.
How is the IRA influencing U.S. tower manufacturing?
Domestic-content incentives have spurred USD 2 billion in new Midwestern factories designed for >120 m sections.
What technology trend could disrupt traditional fabrication?
On-site 3D-printed concrete towers are moving toward commercial deployment for 200 m structures, cutting logistics costs.
How are green steel initiatives affecting procurement?
EU carbon-border rules create a price differential that encourages OEMs to integrate low-emission plate into tower supply chains, reducing life-cycle emissions by more than 60%.
Page last updated on:


