Weather Forecasting Services Market Size and Share
Market Overview
| Study Period | 2020 - 2031 |
|---|---|
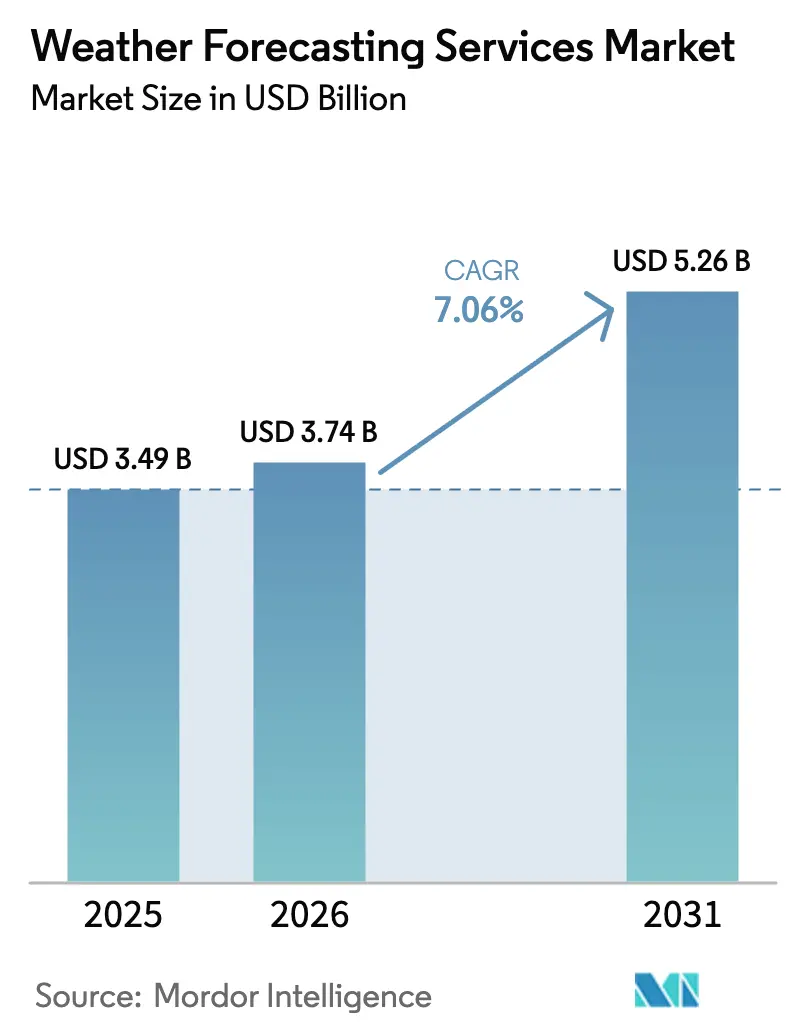
| Market Size (2026) | USD 3.74 Billion |
| Market Size (2031) | USD 5.26 Billion |
| Growth Rate (2026 - 2031) | 7.06% CAGR |
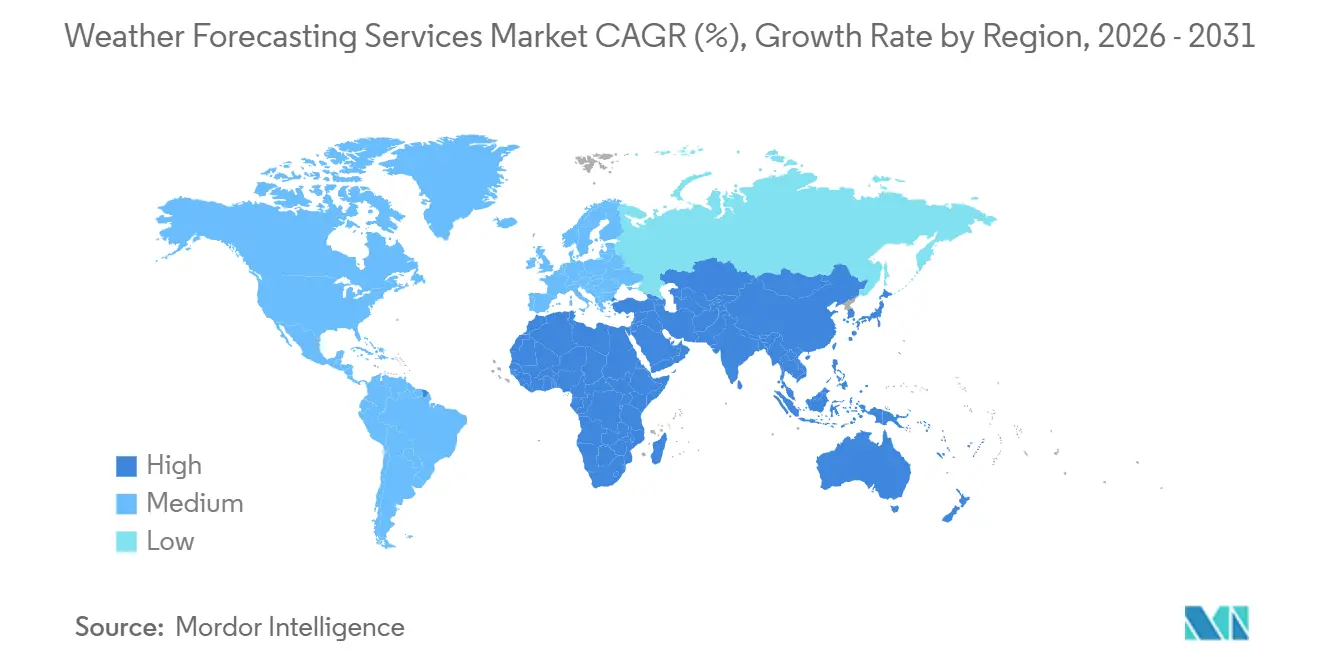
| Fastest Growing Market | Asia Pacific |
| Largest Market | North America |
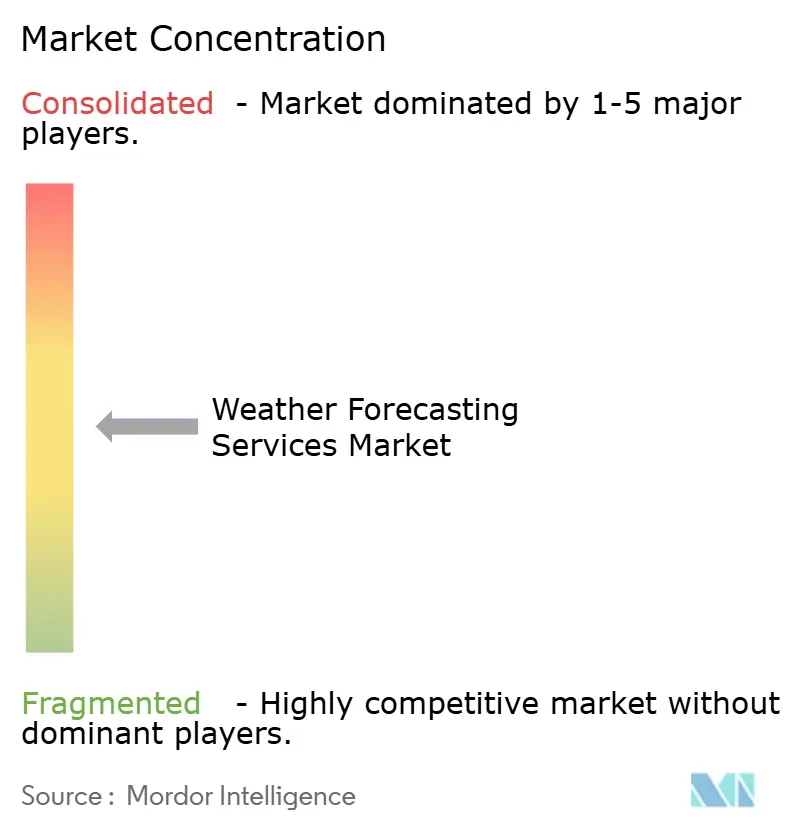
| Market Concentration | Medium |
Major Players *Disclaimer: Major Players sorted in no particular order Image © Mordor Intelligence. Reuse requires attribution under CC BY 4.0. | |
Weather Forecasting Services Market Analysis by Mordor Intelligence
The weather forecasting services market size was valued at USD 3.49 billion in 2025 and estimated to grow from USD 3.74 billion in 2026 to reach USD 5.26 billion by 2031, at a CAGR of 7.06% during the forecast period (2026-2031). Structural demand is shifting from occasional forecast look-ups to continuous weather intelligence streams embedded in enterprise software, propelled by artificial intelligence breakthroughs, expanding commercial satellite constellations, and rising use of parametric risk instruments across energy, insurance, and logistics sectors. The February 2025 go-live of the European Centre for Medium-Range Weather Forecasts (ECMWF) Artificial Intelligence Forecasting System signaled that data-driven prediction has moved from research into critical infrastructure. Enterprises are also gravitating toward machine-readable API feeds that connect directly to trading algorithms, autonomous-vehicle routing engines, and automated insurance-claim triggers, accelerating migration away from human-readable portals. Governments have begun procuring commercial satellite observations to close data gaps, with NOAA awarding Spire Global USD 11.19 million for radio-occultation services in September 2025.
Key Report Takeaways
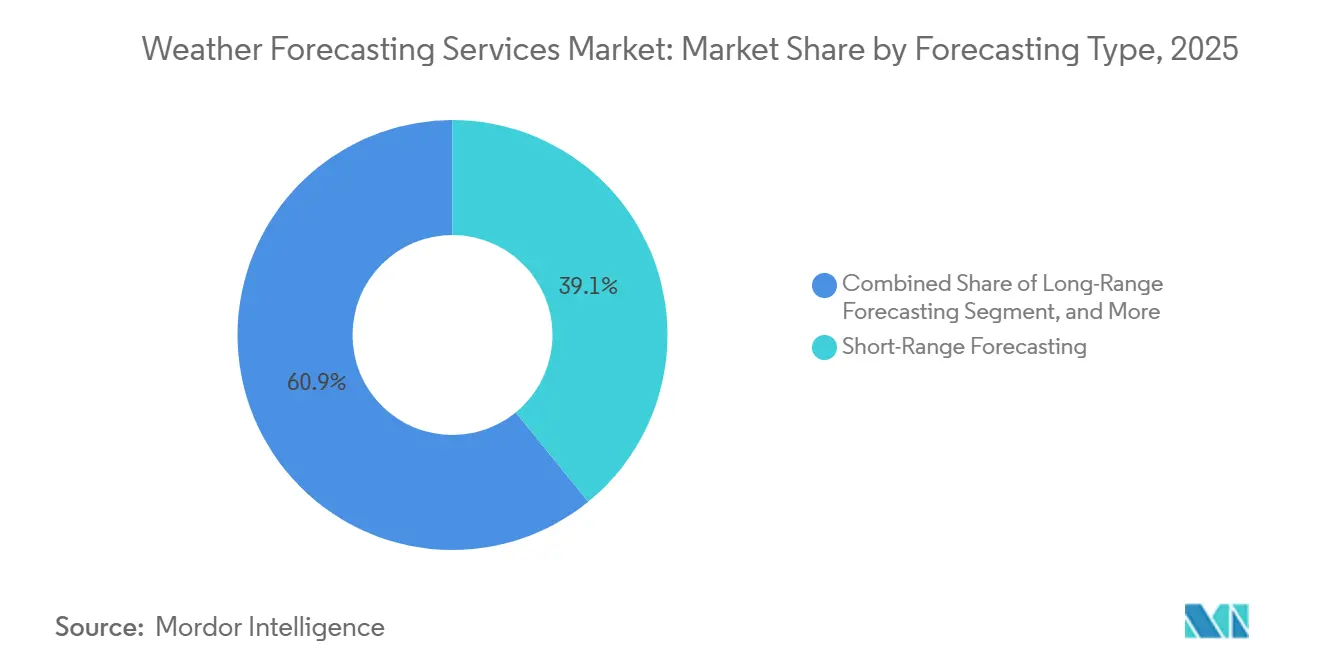
- By forecasting type, short-range held 39.12% of revenue in 2025, while long-range is projected to expand at a 7.62% CAGR through 2031.
- By end user, aviation commanded 23.46% share in 2025; the energy, utilities, and mining segment is forecast to post the fastest growth at 8.91% CAGR to 2031.
- By delivery platform, API and data-feed services captured 43.26% revenue in 2025 and are expected to advance at a 7.88% CAGR through 2031.
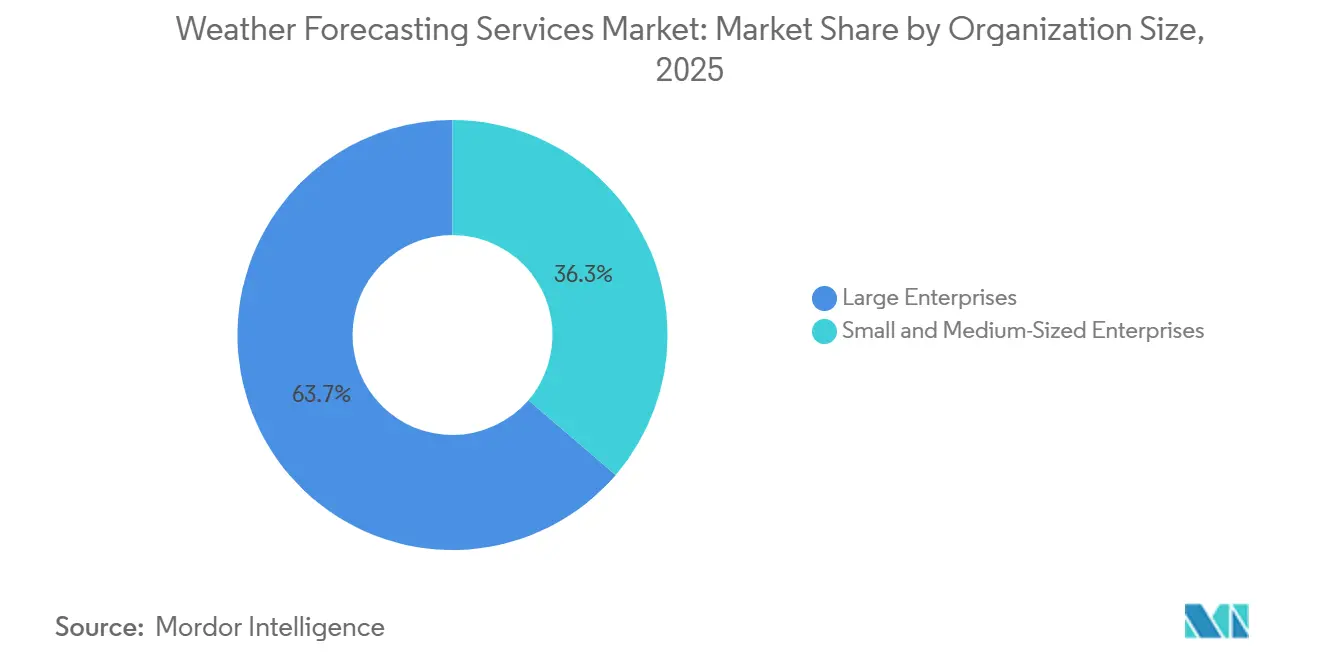
- By organization size, large enterprises accounted for 63.71% of spending in 2025, while small and medium-sized enterprises are set to grow at 7.24% CAGR to 2031.
- By purpose, safety and security accounted for 35.67% of 2025 spending but operational efficiency solutions are advancing at 7.83% CAGR through 2031.
- By geography, North America generated 38.14% of revenue in 2025, Asia Pacific is advancing at an 8.13% CAGR through 2031.
Note: Market size and forecast figures in this report are generated using Mordor Intelligence’s proprietary estimation framework, updated with the latest available data and insights as of 2026.
Global Weather Forecasting Services Market Trends and Insights
Drivers Impact Analysis*
| Driver | (~) % Impact on CAGR Forecast | Geographic Relevance | Impact Timeline |
|---|---|---|---|
| Intensifying Climate Change Driven Extreme Weather Events | +1.2% | Global, with acute exposure in North America, Europe, and Asia Pacific coastal zones | Medium term (2-4 years) |
| Rapid AI and ML Adoption Boosting Forecast Accuracy and Speed | +1.5% | Global, led by North America and Europe; accelerating in Asia Pacific | Short term (≤ 2 years) |
| Grid-Scale Renewable Energy Integration Needs Ultra-Short-Term Forecasts | +1.0% | Europe, North America, China, India; emerging in Middle East solar corridors | Medium term (2-4 years) |
| Aviation and Maritime Safety Mandates for Route Optimization | +0.9% | Global, with regulatory leadership in North America (FAA), Europe (EASA), and Asia Pacific (ICAO member states) | Long term (≥ 4 years) |
| Parametric Micro-Insurance Products Demanding Hyper-Local Data | +0.8% | Asia Pacific (India, Southeast Asia), Africa (Kenya, Nigeria), Latin America (Brazil) | Medium term (2-4 years) |
| Autonomous Vehicles and Drones Requiring Minute-Scale Now-Casting | +0.7% | North America, Europe, China, Japan; pilot deployments in Middle East smart cities | Long term (≥ 4 years) |
| Source: Mordor Intelligence | |||
Intensifying Climate Change Driven Extreme Weather Events
The number and economic toll of billion-dollar disasters continue to rise, driving enterprises to embed predictive weather analytics into capital-allocation and risk-mitigation workflows rather than relying on post-event assessments. U.S. regulators tallied 27 billion-dollar weather events in 2024 that caused USD 182.7 billion in losses.[1]Vaisala, “AI models can now reason with live weather data,” vaisala.com Utilities now overlay minute-scale nowcasts on crew-dispatch software to shorten outage durations, while insurers automate precipitation-indexed payouts to reduce claims-handling expense. Governments are filling oceanic data gaps with commercial radio-occultation and ocean-wind measurements, illustrated by NOAA’s USD 13.69 million contracts to Spire Global in 2025. Aviation and maritime operators extend forecast horizons to optimize fuel hedging amid more volatile jet streams and storm tracks. The escalating climate volatility is repositioning the weather forecasting services market as a strategic lever for earnings stability.
Rapid AI and ML Adoption Boosting Forecast Accuracy and Speed
Artificial intelligence weather models moved into operational environments in 2025. ECMWF’s AI Forecasting System reduced computational energy by roughly 1,000-fold yet improved tropical-cyclone track skill by up to 20%. Google Cloud’s WeatherNext commercial launch in March 2025 offers enterprises 15-day probabilistic outlooks delivered through BigQuery and Earth Engine.[2]Google Cloud, “Google Cloud brings WeatherNext AI-powered predictions to enterprises,” googlecloudpresscorner.com Meteomatics integrated NVIDIA-and DeepMind-developed models in September 2025, cutting forecast generation to seconds and enabling 90-meter down-scaling. Faster runtimes let traders and autonomous-vehicle fleets act on weather changes minutes earlier, turning latency into a competitive differentiator. Cloud delivery further democratizes access by eliminating on-premise supercomputer costs.
Grid-Scale Renewable Energy Integration Needs Ultra-Short-Term Forecasts
Variable renewables now comprise meaningful capacity shares, but their intermittency introduces costly forecast errors. Sub-hourly irradiance and wind-speed predictions allow grid operators to optimize battery dispatch and demand-response participation, trimming reliance on fossil-fuel reserves. Google Cloud partnered with Carrier in March 2025 to embed its WeatherNext output into home-energy management systems, dynamically matching HVAC load with renewable availability. Spire Global’s March 2025 satellite launch added optical inter-satellite links, cutting data latency below 15 minutes, which enhances renewables forecasting accuracy.[3]Spire Global, “Spire Global awarded USD 11.1 million NOAA contract,” ir.spire.com Forecast error avoidance translates directly into wholesale-price stability and improved project returns, ensuring sustained demand for high-refresh-rate services.
Aviation and Maritime Safety Mandates for Route Optimization
International regulators enforce weather-data integration for flight and voyage planning, creating a stable revenue core. Airlines layer turbulence-avoidance nowcasts onto real-time route optimizers to cut fuel burn and maintenance exposure, while maritime operators adjust courses to meet International Maritime Organization carbon-intensity rules. StormGeo’s full acquisition of Brazil-based Climatempo in March 2025 expanded Latin American maritime coverage. Fugro’s January 2025 NOAA hydrographic contract intertwined metocean monitoring with navigational safety obligations. Regulatory momentum ensures recurring subscription renewals and drives incremental demand for higher-resolution datasets.
Restraints Impact Analysis*
| Restraint | (~) % Impact on CAGR Forecast | Geographic Relevance | Impact Timeline |
|---|---|---|---|
| High-Performance Computing and Data-License Costs | -0.6% | Global, with acute pressure on smaller providers and emerging-market meteorological agencies | Short term (≤ 2 years) |
| Model Complexity and Shortage of Expert Meteorologists | -0.5% | Global, particularly acute in Asia Pacific and Africa where university meteorology programs lag demand | Medium term (2-4 years) |
| Uneven Telecom or Sensor Infrastructure in Developing Regions | -0.4% | Sub-Saharan Africa, South Asia, Latin America (excluding Brazil and Argentina), Southeast Asia (excluding Singapore) | Long term (≥ 4 years) |
| Looming Satellite Data Gaps as Aging Constellations Retire | -0.4% | Global, with highest impact on polar-orbiter-dependent forecasts for medium-range and climate applications | Medium term (2-4 years) |
| Source: Mordor Intelligence | |||
High-Performance Computing and Data-License Costs
Running high-resolution numerical models or training large AI architectures demands GPU clusters, decades of reanalysis data, and real-time satellite feeds, which together erect formidable capital barriers for new entrants. Although AI models slash per-run energy use, the upfront investment in development and validation remains steep. Premium satellite datasets, such as hyperspectral infrared or synthetic aperture radar, incur licensing fees that squeeze margins. ECMWF mitigates this hurdle by offering its AI system openly with 24-hour support, but commercial vendors must still amortize infrastructure costs over a broad customer base. Smaller agencies in low-income regions lack budget flexibility, perpetuating a digital divide in forecast quality.
Model Complexity and of Expert Meteorologists
Probabilistic ensembles and AI-generated outputs require meteorological expertise to calibrate bias corrections and communicate uncertainty. University programs lag market demand, especially in Asia Pacific and Africa, limiting the talent pool. Vaisala’s October 2025 natural-language interface allows non-experts to query data but critical safety applications still need human oversight. The shortage encourages consolidation, as larger firms acquire smaller rivals primarily for their meteorologists, and sparks academic partnerships to expand training pipelines.
*Our forecasts treat driver/restraint impacts as directional, not additive. The impact forecasts reflect baseline growth, mix effects, and variable interactions.
Segment Analysis
By Forecasting Type: Long-Range Outlooks Gain Traction
Long-range products are expanding at a 7.62% CAGR, reflecting enterprise demand for visibility into climate variability that informs capital allocation and hedging, while short-range solutions retained 39.12% of 2025 revenue. Renewable developers leverage 10-day to 15-day guidance to schedule maintenance, and agricultural cooperatives plan seasonal crop mixes using multi-week temperature and rainfall scenarios. The weather forecasting services market share for short-range offerings remains large but growth is flattening as free government feeds commoditize basic 72-hour outlooks. Medium-range forecasts bridge operational and strategic planning horizons, benefiting from ECMWF’s February 2025 AI system that improved 15-day skill.
Demand for seamless continuity from real-time nowcasting to seasonal projections is driving providers to combine multiple horizons within a single API or dashboard. As AI models ingest longer reanalysis records, subseasonal skill is improving, blurring distinctions among categories. Enterprises pay premiums for long-range accuracy because misjudging a two-week cold spell can swing fuel-hedging costs or crop-yield outcomes materially. Consequently, the weather forecasting services market size allocated to extended-range products is set to rise steadily through 2031.


By End User: Renewable-Heavy Energy Sector Accelerates
Aviation remained the largest customer group in 2025, holding 23.46% revenue, yet energy, utilities, and mining constitute the fastest-growing vertical at an 8.91% CAGR as grids decarbonize. Ultra-short-term wind and solar forecasts help operators minimize curtailment penalties and optimize battery dispatch, directly linking accuracy to wholesale-price volatility. Financial institutions embed weather data in commodity trading and parametric insurance underwriting, expanding nontraditional demand pools. Government and defense agencies procure satellite data for disaster response, illustrated by NOAA’s multi-year commitments to Spire Global.
Retailers, logistics networks, and construction firms are integrating forecast-driven automation into inventory, routing, and site-safety systems, facilitated by low-code connectors that simplify API usage. Aviation growth remains moderate yet margins stay high because certified turbulence and icing products carry regulatory mandates. Collectively, diversified vertical uptake reinforces the resilience of the weather forecasting services market.
By Delivery Platform: API Feeds Lead the Consumption Shift
API and data-feed channels commanded 43.26% of 2025 revenue and are projected to climb at a 7.88% CAGR as machine-to-machine ingestion becomes the norm. Web portals and mobile apps still serve consumers and small firms lacking developer resources, but free ad-supported competitors pressure pricing power. Consulting engagements address complex offshore or aviation projects where clients value domain expertise over raw data.
Latency and refresh frequency are emerging as key differentiators. Meteomatics cut global 7-day forecast generation to under 2 seconds in September 2025, enabling near real-time algorithmic trading reactions. Standardization around REST and JSON lowers switching costs, intensifying price competition yet broadening overall adoption. Accordingly, the weather forecasting services market size attributed to API delivery will widen its lead over legacy interfaces throughout the decade.
By Organization Size: Cloud Pricing Fuels SME Uptake
Large enterprises represented 63.71% demand in 2025, purchasing enterprise-grade SLAs and bulk data packages, but SMEs are achieving a 7.24% CAGR through 2031 thanks to pay-as-you-go cloud models. Vertical SaaS vendors embed forecast APIs into agriculture, construction, and retail platforms, abstracting meteorological complexity away from end users. Google Cloud’s WeatherNext datasets available in BigQuery allow developers to experiment with small queries for pennies, lowering entry barriers.
Larger corporations will remain the bedrock of recurring revenue because mission-critical applications such as aviation route optimization and grid dispatch carry high switching costs. Still, SME penetration expands the total addressable weather forecasting services market and diversifies provider portfolios against sector-specific downturns.
By Purpose: Operational Efficiency Surpasses Safety Priority
Safety and security accounted for 35.67% of 2025 spending but operational efficiency solutions are advancing at 7.83% CAGR as enterprises quantify weather’s impact on variable costs. Algorithms that align delivery schedules with precipitation windows or modulate HVAC loads ahead of heatwaves turn forecasts into direct cash-flow levers. Parametric insurance popularizes risk-management use cases by automating payouts when predefined thresholds are breached, while disaster management remains a government-funded public good.
With Vaisala's AI-ready data streams, businesses are transitioning from reactive, alert-based responses to proactive, real-time optimization strategies. This advancement empowers organizations to make data-driven decisions, minimize operational disruptions, and maximize resource efficiency. Consequently, by 2031, operational efficiency is expected to secure a significantly larger share of the weather forecasting services market, reflecting its growing importance in driving business outcomes.
Geography Analysis
North America generated 38.14% of revenue in 2025, benefiting from dense observation networks, mature aviation mandates, and deep penetration of weather derivatives in commodity markets. NOAA’s ongoing Commercial Weather Data Pilot encourages private satellite procurement, exemplified by Spire Global’s USD 13.69 million awards. Cloud providers based in the United States accelerate AI-forecast commercialization, and autonomous-vehicle pilots across California, Texas, and Michigan embed minute-scale nowcasts into routing engines. While market saturation tempers growth, renewable integration and parametric insurance continue to unlock fresh demand.
Asia Pacific is advancing at an 8.13% CAGR, driven by infrastructure modernization and regulatory focus on disaster preparedness in typhoon- and monsoon-prone economies. China and India are investing in domestic satellite constellations and AI modeling capacity to boost self-reliance, while Japan and South Korea require ultra-short-term forecasts to manage offshore wind farms. Hyper-local data underpins micro-insurance schemes for smallholder farmers across India, Indonesia, and the Philippines. Mobile network expansion and low-cost IoT sensors are gradually closing validation gaps, accelerating adoption even in rural regions.
Europe leverages ECMWF’s leadership in numerical prediction and aggressive decarbonization targets to sustain robust demand. Offshore wind construction in the North Sea and Baltic Sea necessitates precision metocean intelligence, and the European Union’s adaptation policies drive uptake across transportation, agriculture, and insurance. ECMWF’s open AI forecasting system fosters innovation among commercial vendors and national agencies alike.
South America, the Middle East, and Africa contribute smaller absolute volumes but post double-digit expansion. Brazil’s agriculture sector relies on seasonal outlooks, while Saudi Arabia and the United Arab Emirates demand irradiance forecasts for gigawatt-scale solar parks. Africa’s mobile-money ecosystem enables rapid distribution of parametric micro-insurance, catalyzing weather-data uptake even in bandwidth-constrained environments. Satellite-first providers bridge terrestrial sensor gaps, broadening the geographic reach of the weather forecasting services market.

Competitive Landscape
The market remains moderately fragmented. IBM Weather Company, AccuWeather, and DTN retain entrenched enterprise and media positions, yet satellite-native challengers such as Spire Global, Climavision, and Tomorrow.io are eroding share by offering sub-hourly refresh rates and hyper-local resolution. Spire Global’s January 2026 launch of nine satellites carrying a Hyperspectral Microwave Sounder prototype underscores vertical integration designed to control both observation and modeling stacks. Google Cloud commercialized DeepMind-built models under its WeatherNext brand, leveraging hyperscale compute and enterprise distribution channels to disrupt traditional forecast vendors.
Meteomatics differentiates via proprietary Meteodrone data and 90-meter down-scaling, targeting construction-site safety and precision agriculture niches. Vaisala lowers technical barriers by enabling natural-language access to live weather databases, appealing to non-meteorologist decision makers. Fugro acquired satellite-analytics firm EOMAP in February 2025 to enhance geospatial offerings, while StormGeo secured full ownership of Climatempo to deepen South American penetration.
Technology investment is a critical driver of competitiveness in the market. Providers are actively working to reduce latency, improve spatial resolution, and deliver seamless API integration with widely adopted cloud and data-science platforms. This continuous cycle of technological advancements is significantly contributing to the growth and expansion of the weather forecasting services market. However, this growth is accompanied by increasing price competition, which adds further complexity to the competitive landscape.
Weather Forecasting Services Industry Leaders
The Weather Company, LLC
AccuWeather, Inc.
StormGeo AS
Vaisala Oyj
Pelmorex Corp.
- *Disclaimer: Major Players sorted in no particular order

Recent Industry Developments
- January 2026: Spire Global launched nine satellites on SpaceX’s Twilight mission, including a Hyperspectral Microwave Sounder demonstrator to capture real-time atmospheric profiles, enhancing global forecasting accuracy.
- November 2025: Spire Global shipped nine satellites to Vandenberg Space Force Base, featuring next-generation hyperspectral microwave capability for atmospheric sounding.
- October 2025: Vaisala Xweather integrated the Model Context Protocol, connecting live weather data to AI models for real-time reasoning in logistics, insurance, energy, and automotive applications.
- September 2025: Spire Global won two NOAA contracts totaling USD 13.69 million for radio-occultation and ocean-wind data under the Commercial Weather Data Pilot.


Global Weather Forecasting Services Market Report Scope
The Weather Forecasting Services Market Report is Segmented by Forecasting Type (Short-Range, Medium-Range, Long-Range), End User (Aviation, Transportation and Logistics, Energy/Utilities/Mining, Government/Defense, BFSI, Agriculture/Forestry, Media/Entertainment, Retail/E-Commerce, Construction/Mining), Purpose (Operational Efficiency, Safety/Security, Risk Management, Disaster Management), Delivery Platform (Web Portals, Mobile Apps, API/Data-Feed, Consulting), Organization Size (Large, SME), and Geography (North America, South America, Europe, Asia Pacific, Middle East, Africa). The Market Forecasts are Provided in Terms of Value (USD).
| Short-range Forecasting |
| Medium-range Forecasting |
| Long-range Forecasting |
| Aviation |
| Transportation and Logistics |
| Energy, Utilities and Mining |
| Government and Defense |
| Banking, Financial Services and Insurance |
| Agriculture and Forestry |
| Media and Entertainment |
| Retail and E-commerce |
| Construction and Mining |
| Operational Efficiency |
| Safety and Security |
| Risk Management and Claims Optimization |
| Disaster Management and Emergency Response |
| Web-based Portals |
| Mobile Applications |
| API / Data-feed Services |
| Consulting and Managed Services |
| Large Enterprises |
| Small and Medium-sized Enterprises |
| North America | United States |
| Canada | |
| Mexico | |
| South America | Brazil |
| Argentina | |
| Rest of South America | |
| Europe | United Kingdom |
| Germany | |
| France | |
| Italy | |
| Spain | |
| Russia | |
| Rest of Europe | |
| Asia-Pacific | China |
| Japan | |
| India | |
| South Korea | |
| Australia and New Zealand | |
| Southeast Asia | |
| Rest of Asia-Pacific | |
| Middle East | Saudi Arabia |
| United Arab Emirates | |
| Turkey | |
| Rest of Middle East | |
| Africa | South Africa |
| Nigeria | |
| Kenya | |
| Rest of Africa |
| By Forecasting Type | Short-range Forecasting | |
| Medium-range Forecasting | ||
| Long-range Forecasting | ||
| By End User | Aviation | |
| Transportation and Logistics | ||
| Energy, Utilities and Mining | ||
| Government and Defense | ||
| Banking, Financial Services and Insurance | ||
| Agriculture and Forestry | ||
| Media and Entertainment | ||
| Retail and E-commerce | ||
| Construction and Mining | ||
| By Purpose | Operational Efficiency | |
| Safety and Security | ||
| Risk Management and Claims Optimization | ||
| Disaster Management and Emergency Response | ||
| By Delivery Platform | Web-based Portals | |
| Mobile Applications | ||
| API / Data-feed Services | ||
| Consulting and Managed Services | ||
| By Organization Size | Large Enterprises | |
| Small and Medium-sized Enterprises | ||
| By Geography | North America | United States |
| Canada | ||
| Mexico | ||
| South America | Brazil | |
| Argentina | ||
| Rest of South America | ||
| Europe | United Kingdom | |
| Germany | ||
| France | ||
| Italy | ||
| Spain | ||
| Russia | ||
| Rest of Europe | ||
| Asia-Pacific | China | |
| Japan | ||
| India | ||
| South Korea | ||
| Australia and New Zealand | ||
| Southeast Asia | ||
| Rest of Asia-Pacific | ||
| Middle East | Saudi Arabia | |
| United Arab Emirates | ||
| Turkey | ||
| Rest of Middle East | ||
| Africa | South Africa | |
| Nigeria | ||
| Kenya | ||
| Rest of Africa | ||


Key Questions Answered in the Report
How large is the global weather forecasting services market in 2026?
The weather forecasting services market size is expected to reach USD 3.74 billion in 2026, on track for a CAGR of 7.06% through 2031.
Which segment is growing fastest by end user?
Energy, utilities, and mining applications are forecast to expand at 8.91% CAGR as grids integrate variable renewables and require ultra-short-term forecasts.
Why are API delivery platforms gaining share?
API and data-feed services allow machine-to-machine ingestion, supporting algorithmic trading, autonomous mobility, and parametric insurance, and are projected to grow at 7.88% CAGR.
Which region is set for the highest growth?
Asia Pacific is projected to advance at an 8.13% CAGR, driven by infrastructure modernization and disaster-response mandates across China, India, and Southeast Asia.
How is artificial intelligence changing weather forecasting?
AI models, such as ECMWF’s operational system and Google Cloud’s WeatherNext, deliver forecasts faster and with up to 20% higher skill while slashing computational energy, enabling new latency-sensitive applications.
What restrains smaller providers from scaling?
High up-front computing costs, satellite data license fees, and the scarcity of expert meteorologists pose structural barriers for new entrants.
Page last updated on:


