
Aerospace & Defense
8th MayFeasibility Analysis for FBO Services in East Africa
3 Min Read
The Weapon Mounts Market Report is Segmented by Mount Type (Static and Non-Static), Mode of Operation (Manual and Remotely Operated), Platform (Land, Air, and Sea), Weapon Caliber (Small Arms, Heavy Machine Guns, Automatic Cannons, and Large Caliber), End-User (Defense Forces and Law Enforcement), and Geography (North America, Europe, Asia-Pacific, and More). The Market Forecasts are Provided in Terms of Value (USD).
Market Overview
| Study Period | 2020 - 2031 |
|---|---|
| Market Size (2026) | USD 1.96 Billion |
| Market Size (2031) | USD 2.61 Billion |
| Growth Rate (2026 - 2031) | 5.92 % CAGR |
| Fastest Growing Market | Asia Pacific |
| Largest Market | North America |
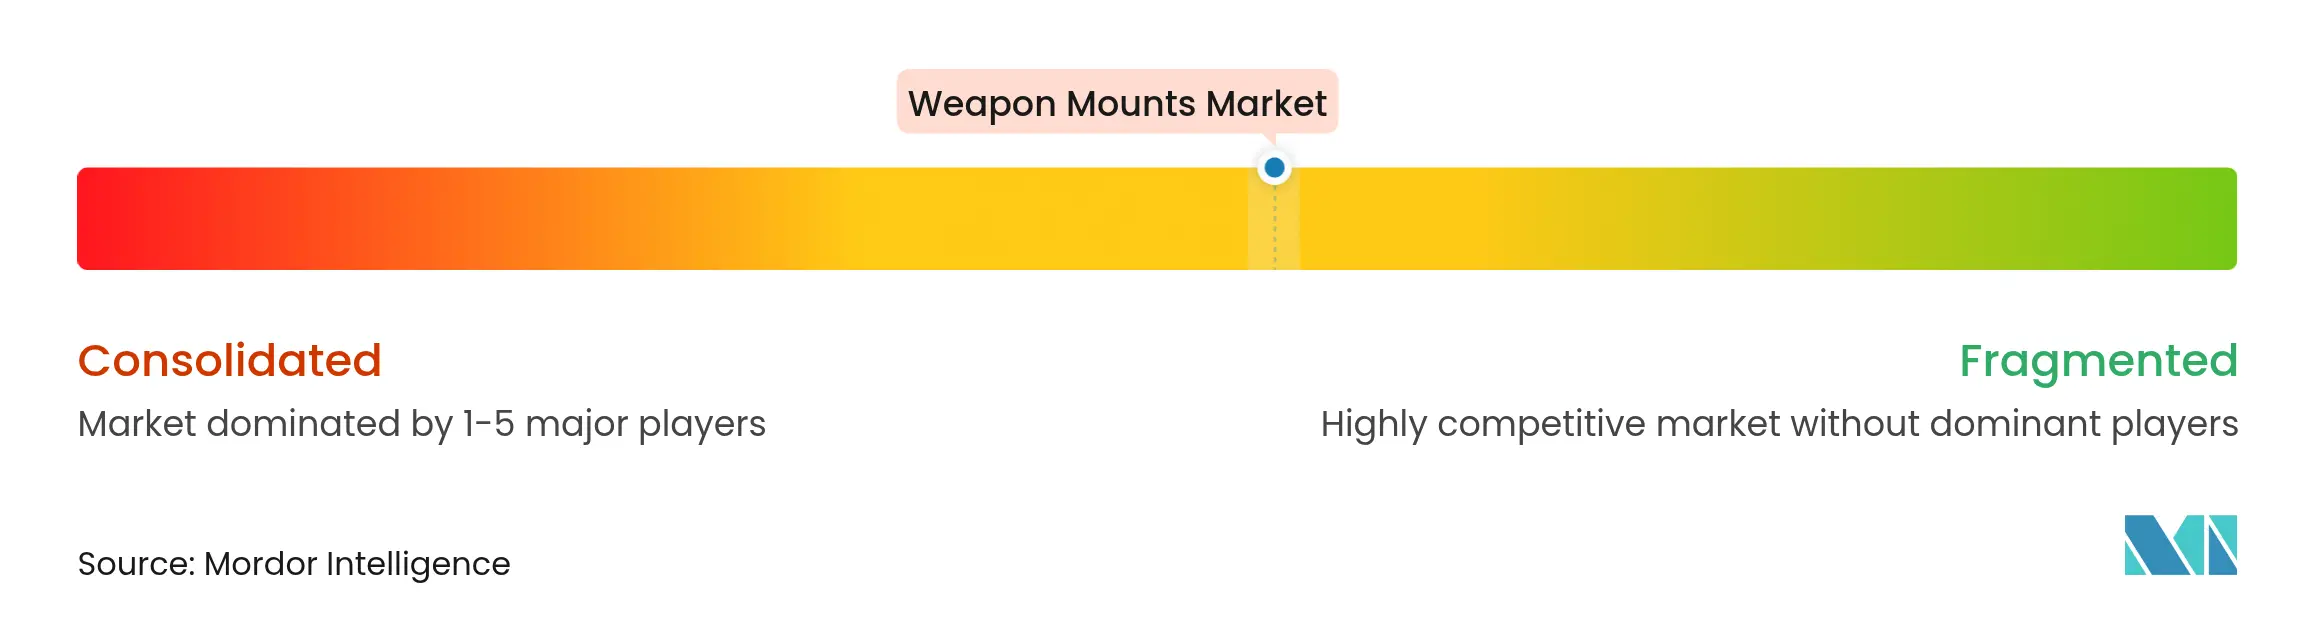
| Market Concentration | Medium |
Major Players *Disclaimer: Major Players sorted in no particular order. Image © Mordor Intelligence. Reuse requires attribution under CC BY 4.0. |
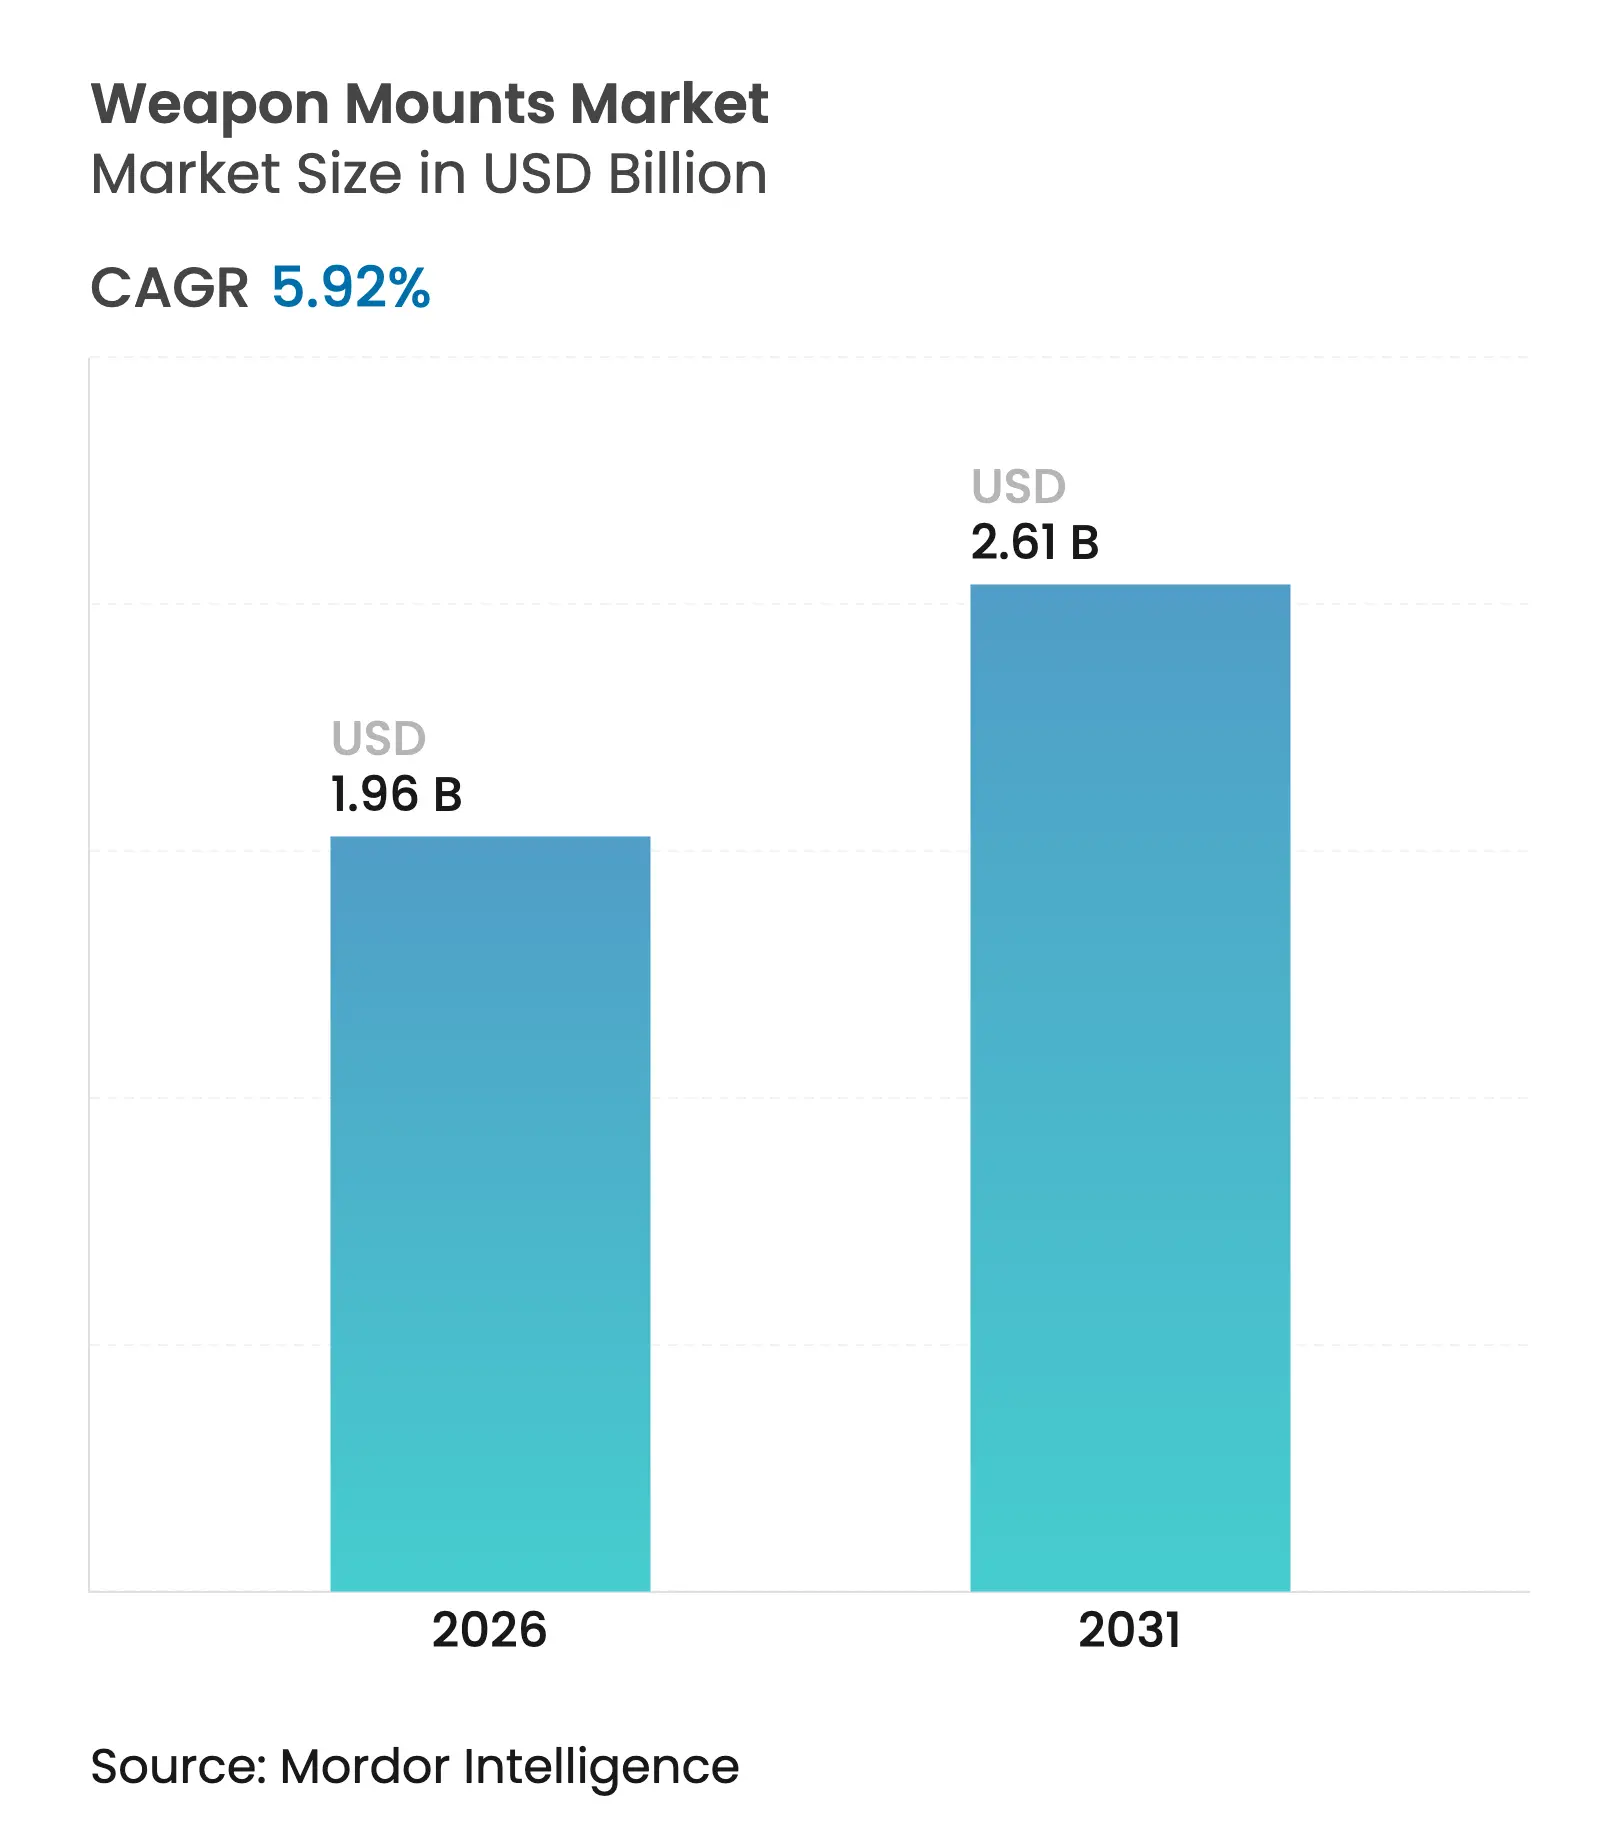
The weapon mounts market size is expected to grow from USD 1.85 billion in 2025 to USD 1.96 billion in 2026 and is forecast to reach USD 2.61 billion by 2031 at 5.92% CAGR over 2026-2031. Growth is anchored in a shift toward crew-protection doctrines that favor remote and stabilized systems, alongside rising demand for mounts optimized for unmanned platforms and multi-caliber flexibility. Rapid integration of artificial intelligence, high-definition sensors, and active stabilization turns the mount from a mechanical fixture into a networked fire-control sub-system, raising its average selling price. Regional modernization programs, especially in Asia-Pacific, are accelerating replacement cycles for legacy land, naval, and airborne fleets, while open-architecture mandates are broadening the supplier base and fueling modular design competition. North America retains market leadership through large procurement budgets and technology leadership, whereas Asia-Pacific delivers the fastest growth on the back of naval expansion and border-security imperatives.
Key Report Takeaways
Note: Market size and forecast figures in this report are generated using Mordor Intelligence's proprietary estimation framework, updated with the latest available data and insights as of 2026.
Drivers Impact Analysis
| Driver | (~) % Impact on CAGR Forecast | Geographic Relevance | Impact Timeline | |||
|---|---|---|---|---|---|---|
Crew survivability via remote and stabilized mounts Crew survivability via remote and stabilized mounts | +1.8% | Global; strong in North America, Europe, advanced Asia-Pacific forces | Medium term (2-4 years) | (~) % Impact on CAGR Forecast:+1.8% | Geographic Relevance:Global; strong in North America, Europe, advanced Asia-Pacific forces | Impact Timeline:Medium term (2-4 years) |
Retrofit of aging land, naval and airborne fleets Retrofit of aging land, naval and airborne fleets | +1.5% | North America, Europe, Middle East | Medium term (2-4 years) | |||
Proliferation of UGVs, USVs and armed UAVs Proliferation of UGVs, USVs and armed UAVs | +2.1% | Global; early adoption in North America, Israel, advanced Asian economies | Long term (≥ 4 years) | |||
AI, HD sensors, and active stabilization raise subsystem value AI, HD sensors, and active stabilization raise subsystem value | +0.9% | North America, Europe, advanced Asia-Pacific economies | Short term (≤ 2 years) | |||
Rapid weapon interchange for joint-force operations Rapid weapon interchange for joint-force operations | +0.6% | Global; emphasized by NATO and allied forces | Medium term (2-4 years) | |||
Open-interface, plug-and-play multi-caliber designs Open-interface, plug-and-play multi-caliber designs | +0.7% | Global; led by NATO countries | Medium term (2-4 years) | |||
| Source: Mordor Intelligence | ||||||
Crew Survivability Drives Remote Weapon Station Adoption
Remote weapon stations let soldiers engage from protected positions, sharply reducing exposure in contested environments. Budgets confirm the trend; the US FY 2025 procurement request allocates USD 167.5 billion to force-protection capabilities, including next-generation mounts. AI-enabled optics now automate target classification, and dual-axis stabilization ensures first-round accuracy during vehicle movement. Militaries view these mounts as strategic force multipliers that preserve personnel and improve mission lethality across ground vehicles, patrol craft, and light tanks.
Ongoing Fleet Retrofits Sustain Demand
Dozens of armored vehicle and naval frigate programs launched since 2024 are replacing legacy pintle mounts with lighter, networked systems that support plug-and-play weapon swaps. Open-architecture electrical interfaces let crews shift from 7.62 mm machine guns to 40 mm grenade launchers within minutes, compressing logistics footprints and increasing platform flexibility. Retrofit projects in the US, France, and Saudi Arabia illustrate steady aftermarket revenue for suppliers able to certify mounts to NATO standards without structural rework of host vehicles.
Unmanned Platforms Expand the Total Addressable Market
Weapon mount adoption is accelerating on unmanned ground robots, surface vessels, and armed drones tasked with perimeter security or counter-UAS missions. The US Army’s Robotics and Autonomous Systems strategy underscores lethality requirements for future autonomous combat formations. Lightweight, low-recoil mounts fitted with electro-optics and fire-control computers now equip medium UGVs, enabling accurate engagement while minimizing collateral damage. As volumes rise, suppliers that master composite structures and smart-actuator control gain a first-mover advantage.
AI and Sensor Integration Elevate Mount Value
Systems such as the Indian Army’s Ten AI Weapon System demonstrate how AI-driven detection pipelines, thermal imagers, and laser rangefinders transform mounts into full fire-control nodes. These capabilities boost hit probability, reduce ammunition expenditure, and enable 24-hour operations. The resulting jump in performance justifies higher unit prices and shifts procurement evaluation toward software update paths and data-link interoperability, reinforcing a premium tier in the weapon mounts market.
Restraints Impact Analysis
| Restraint | (~) % Impact on CAGR Forecast | Geographic Relevance | Impact Timeline | |||
|---|---|---|---|---|---|---|
Stringent export and compliance regimes Stringent export and compliance regimes | -0.9% | Global | Long term (≥ 4 years) | (~) % Impact on CAGR Forecast:-0.9% | Geographic Relevance:Global | Impact Timeline:Long term (≥ 4 years) |
Procurement-cycle volatility Procurement-cycle volatility | -1.1% | Global; acute where political transitions are frequent | Medium term (2-4 years) | |||
High R&D cost for high-caliber recoil mitigation High R&D cost for high-caliber recoil mitigation | -0.6% | Global | Medium term (2-4 years) | |||
Payload/power limits for advanced electronics Payload/power limits for advanced electronics | -0.8% | Global | Short term (≤ 2 years) | |||
| Source: Mordor Intelligence | ||||||
Export Restrictions Constrain Market Accessibility
Regimes such as ITAR and the Wassenaar Arrangement lengthen deal cycles, force downgraded export variants, and restrict some advanced stabilization technologies. Although a 2025 executive order seeks to streamline US review processes, suppliers still devote substantial legal resources to compliance, limiting participation by smaller firms and fragmenting regional demand. Local manufacturers in Asia-Pacific and South America are capitalizing by developing indigenous alternatives tailored to their defense ministries’ requirements.
Defense Procurement Cycles Create Revenue Volatility
Weapon-system programs often span five-plus years and face budget revisions, delaying production ramps. A 2024 US Government Accountability Office assessment found multiple prime contracts running over cost and behind schedule, underscoring planning risks for tier-two suppliers. Mount manufacturers counter volatility through flexible machining cells, multi-service frame agreements, and a balanced mix of short-cycle upgrade kits and longer-cycle new-build contracts.
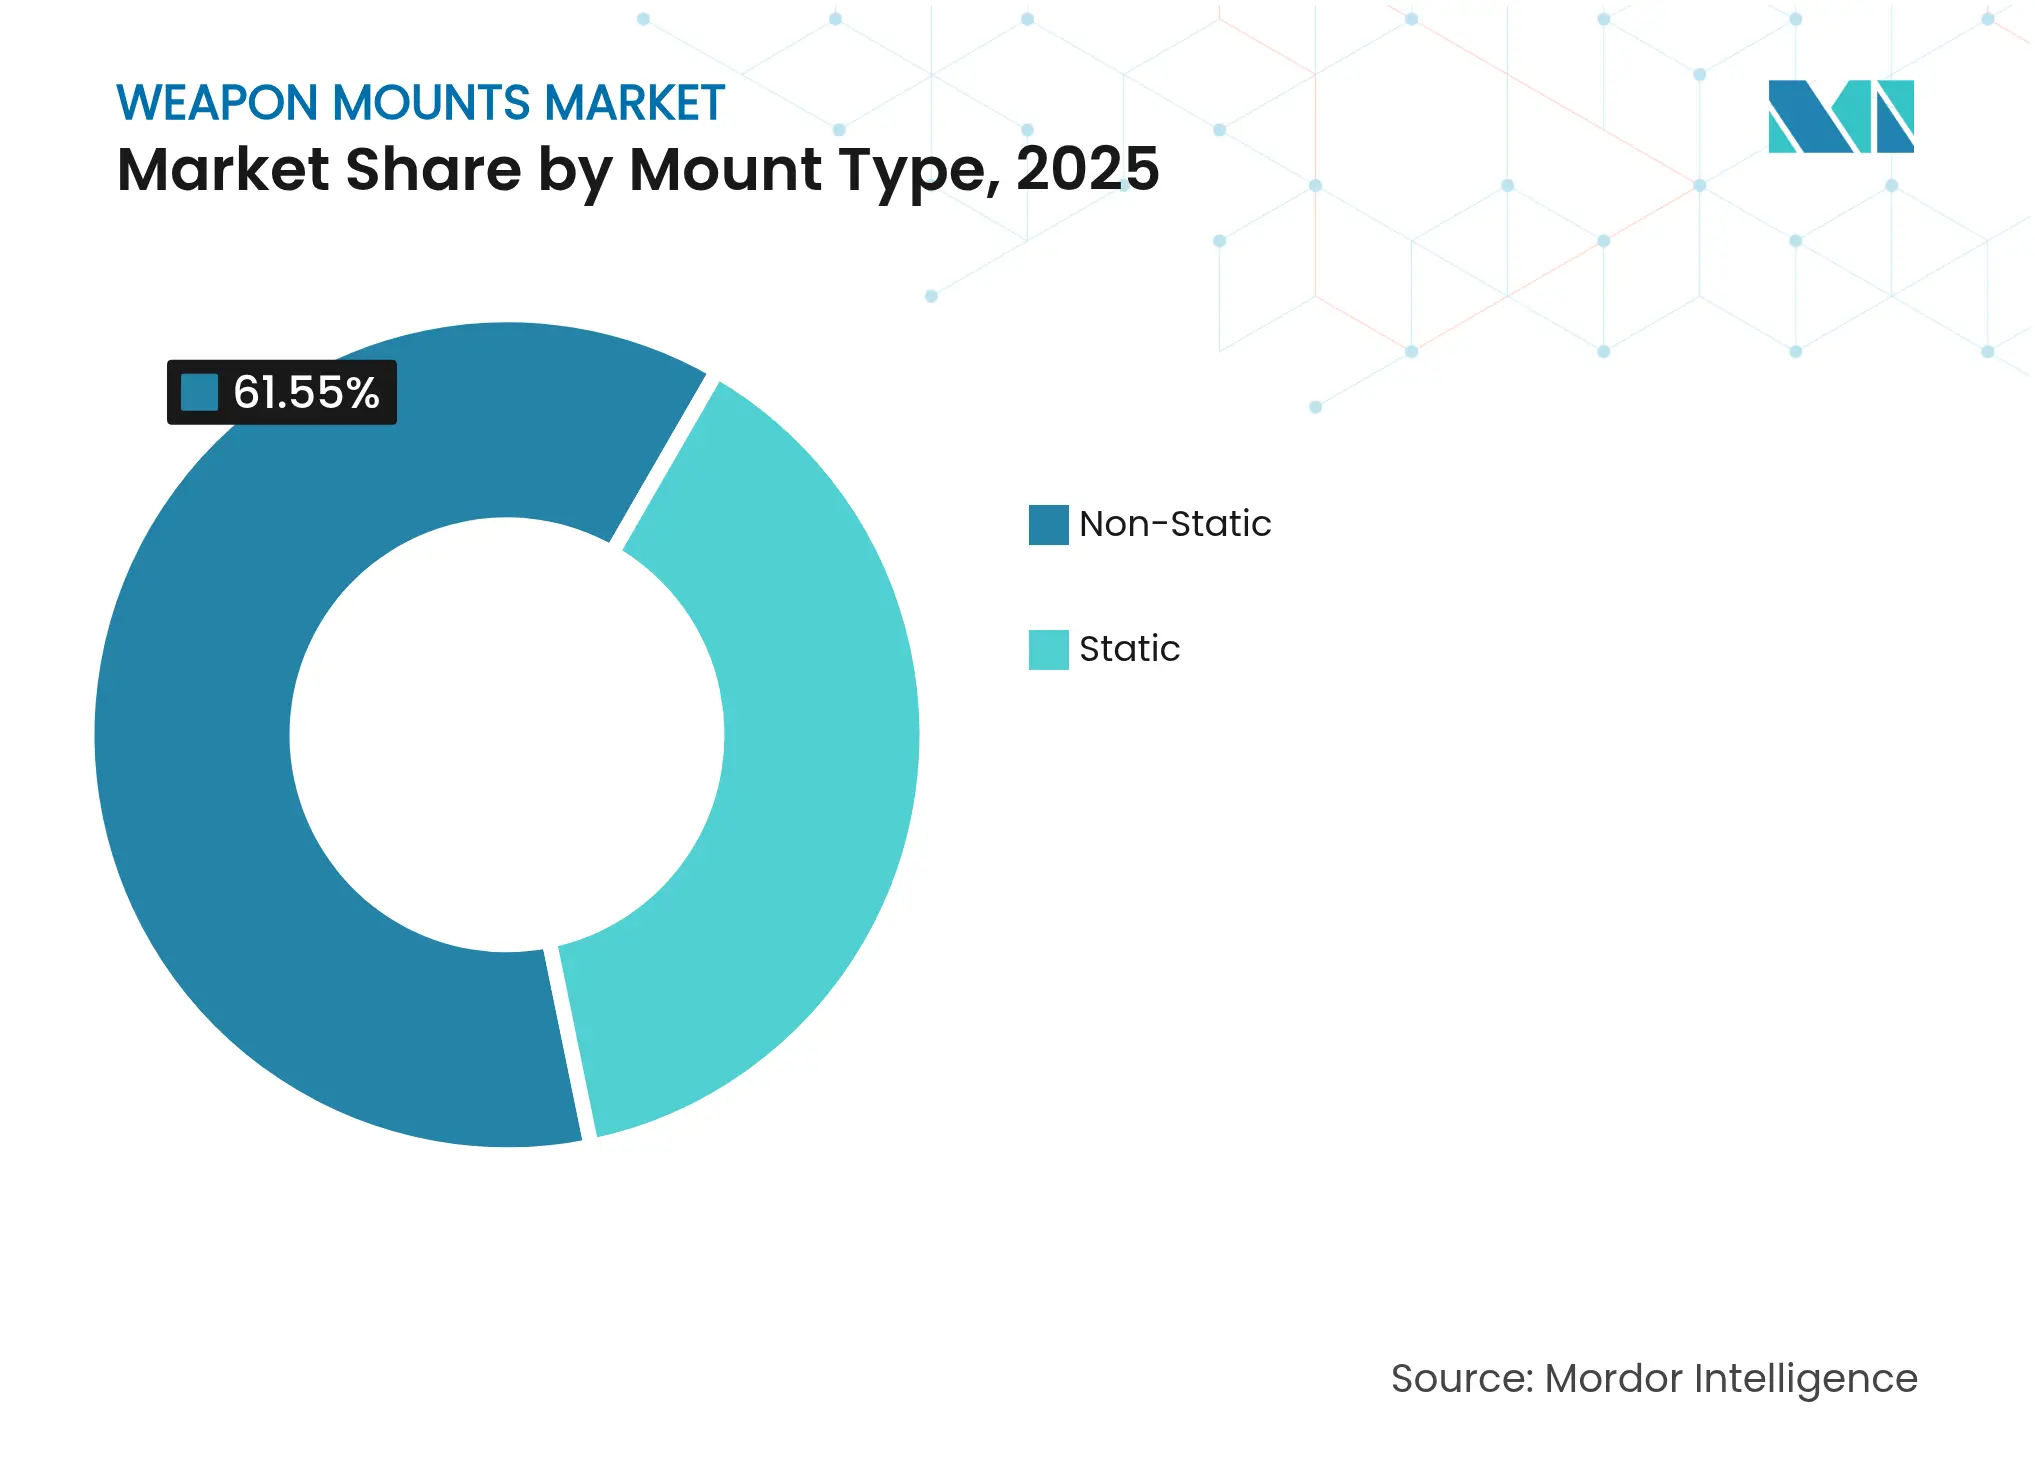
By Mount Type: Remote Systems Redefine Battlefield Engagement
In 2025, non-static designs held 61.55% of the weapon mounts market share, underscoring the battlefield's need for flexibility. Remote weapon stations now post an 8.12% CAGR, propelled by systems such as the EOS R500, which fuse 30 mm firepower with AI-assisted optics. This sub-segment benefits from modular housings that accommodate cannons, grenade launchers, or anti-tank missiles without hull re-engineering.
Tripod and pedestal variants regain relevance for special-forces and naval counters-UAS roles, where low profile and rapid deployment trump armored protection. Static mounts remain essential for perimeter defense but face severe erosion as doctrine favors mobile fires. Composite barrels, additive-manufactured brackets, and smart-actuator kits continue to cut weight, a requisite for unmanned vehicles and light tanks. These innovations support a broader weapon mounts market size extending across conventional and robotic platforms.
Note: Segment shares of all individual segments available upon report purchase
By Mode of Operation: Automation Reshapes Operational Paradigms
Manual systems still commanded 53.65% of 2025 revenue thanks to simplicity and field repairability, yet remotely operated solutions will outpace them at an 7.82% CAGR through 2031. Integrated gyros and servo drives allow on-the-move accuracy, as illustrated by Elbit’s RCWS family, which maintains target lock during vehicle traverse.Remote control also reduces training hours and widens use-cases for law enforcement forces that lack heavy-armor fleets. Future capabilities include predictive maintenance via embedded sensors and AI-driven shot-effect estimation. As automation spreads, the weapon mounts industry confronts cyber-hardening requirements to shield control networks from jamming and spoofing threats.
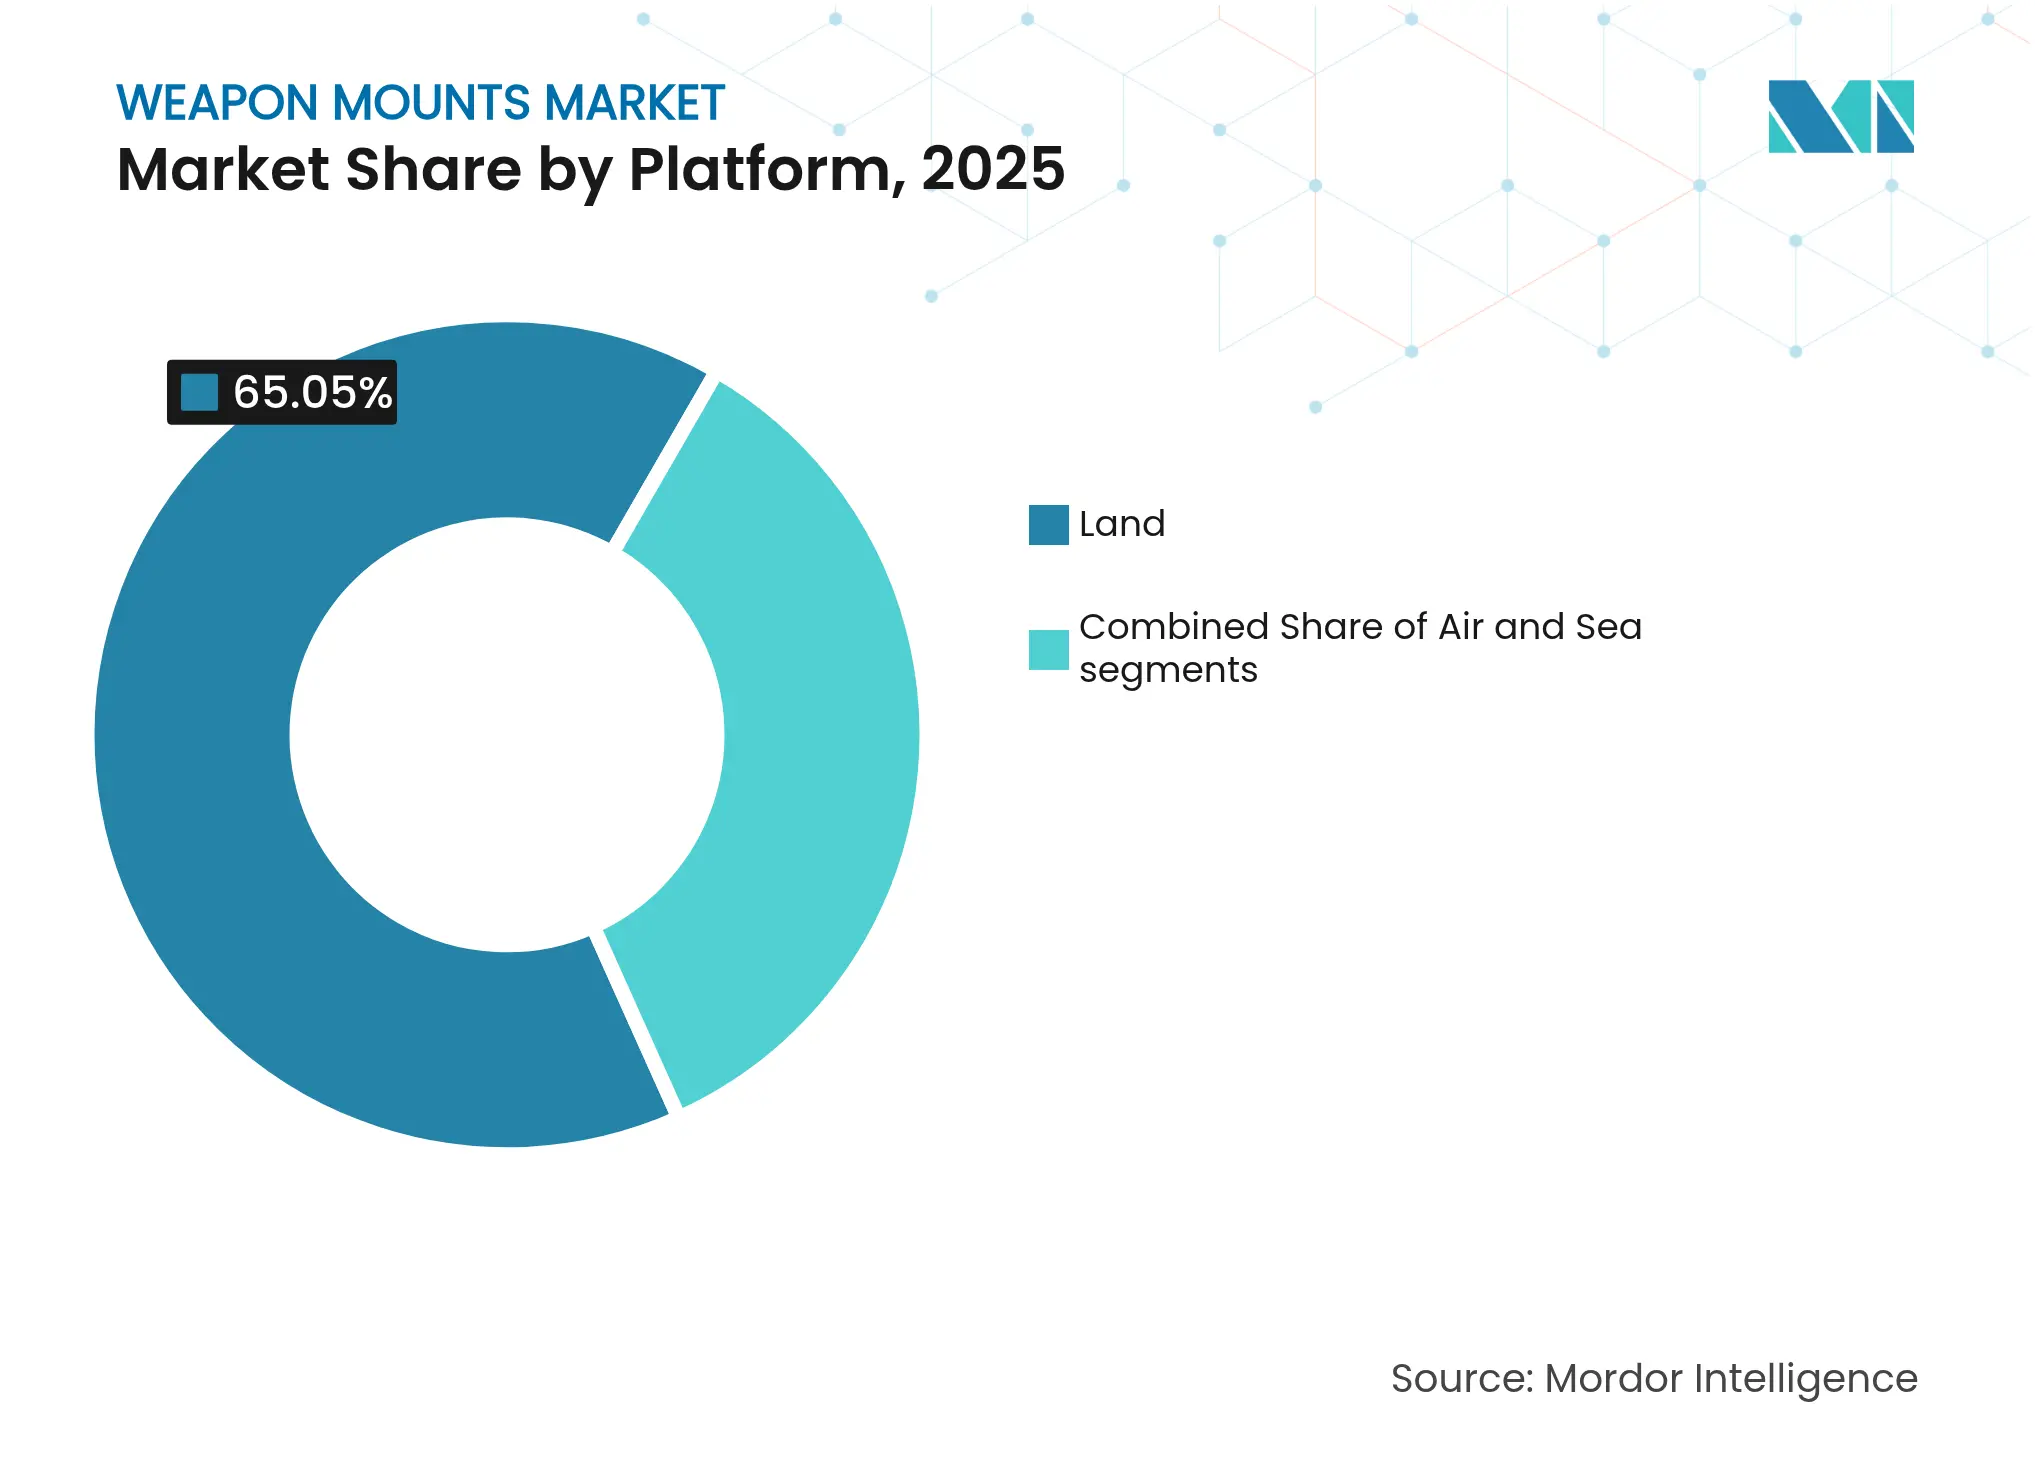
By Platform: Land Dominance Meets Naval Innovation
Land vehicles contributed 65.05% of the weapon mounts market size in 2025 due to continuous armored-fleet upgrades. The US Army alone budgeted USD 3.7 billion for tracked combat vehicles in FY 2025. However, naval programs now show the sharpest upturn, with patrol craft and offshore patrol vessels integrating stabilized 30 mm mounts that counter fast-attack boats and drones in congested littorals.
The quest for ultra-lightweight frames on airborne platforms spurs titanium-alloy cradles and recoil-attenuating buffers. Helicopter door-gun mounts increasingly feature quick-detach rails, allowing aircrews to switch between 7.62 mm and 12.7 mm within minutes. The combined land-sea-air demand profile reinforces the cross-platform synergies offered by open-architecture mounts.
Note: Segment shares of all individual segments available upon report purchase
By Weapon Caliber: Automatic Cannons Lead Technological Evolution
Heavy machine guns held 43.10% of total revenue in 2025 due to their versatility against lightly armored vehicles and drones. Yet, automatic cannons in the 20-40 mm class will grow fastest at an 8.28% CAGR as airburst munitions and programmable fuzes defeat defilade positions and Group 1-3 UAVs.The weapon mounts market size for automatic cannons reflects a trend toward dual-feed systems that let crews toggle between armor-piercing and high-explosive rounds. Small-arms mounts stay relevant for light vehicles and coastal craft, while large-caliber cradles remain niche for main battle tanks and naval guns, but set high engineering bars for recoil mitigation.
By End-User: Defense Dominance Meets Law Enforcement Growth
Defense customers represented 86.20% of 2025 demand, driven by modular vehicle upgrades and new-build frigates. Ground forces remain the largest adopters, yet naval and marine units allocate rising budgets to stabilized mounts that safeguard deck crews during interception missions.
Law enforcement agencies, though smaller, post an 8.21% CAGR through 2031 as border surveillance towers and counter-drone trucks procure lightweight, radar-cuing mounts. The weapon mounts market share for civil-agency buyers is further enlarged by funding lines tied to critical infrastructure protection and urban-event security. Suppliers now tailor simplified user interfaces and less-than-lethal payload compatibility to win these contracts, diversifying revenue beyond traditional defense cycles.
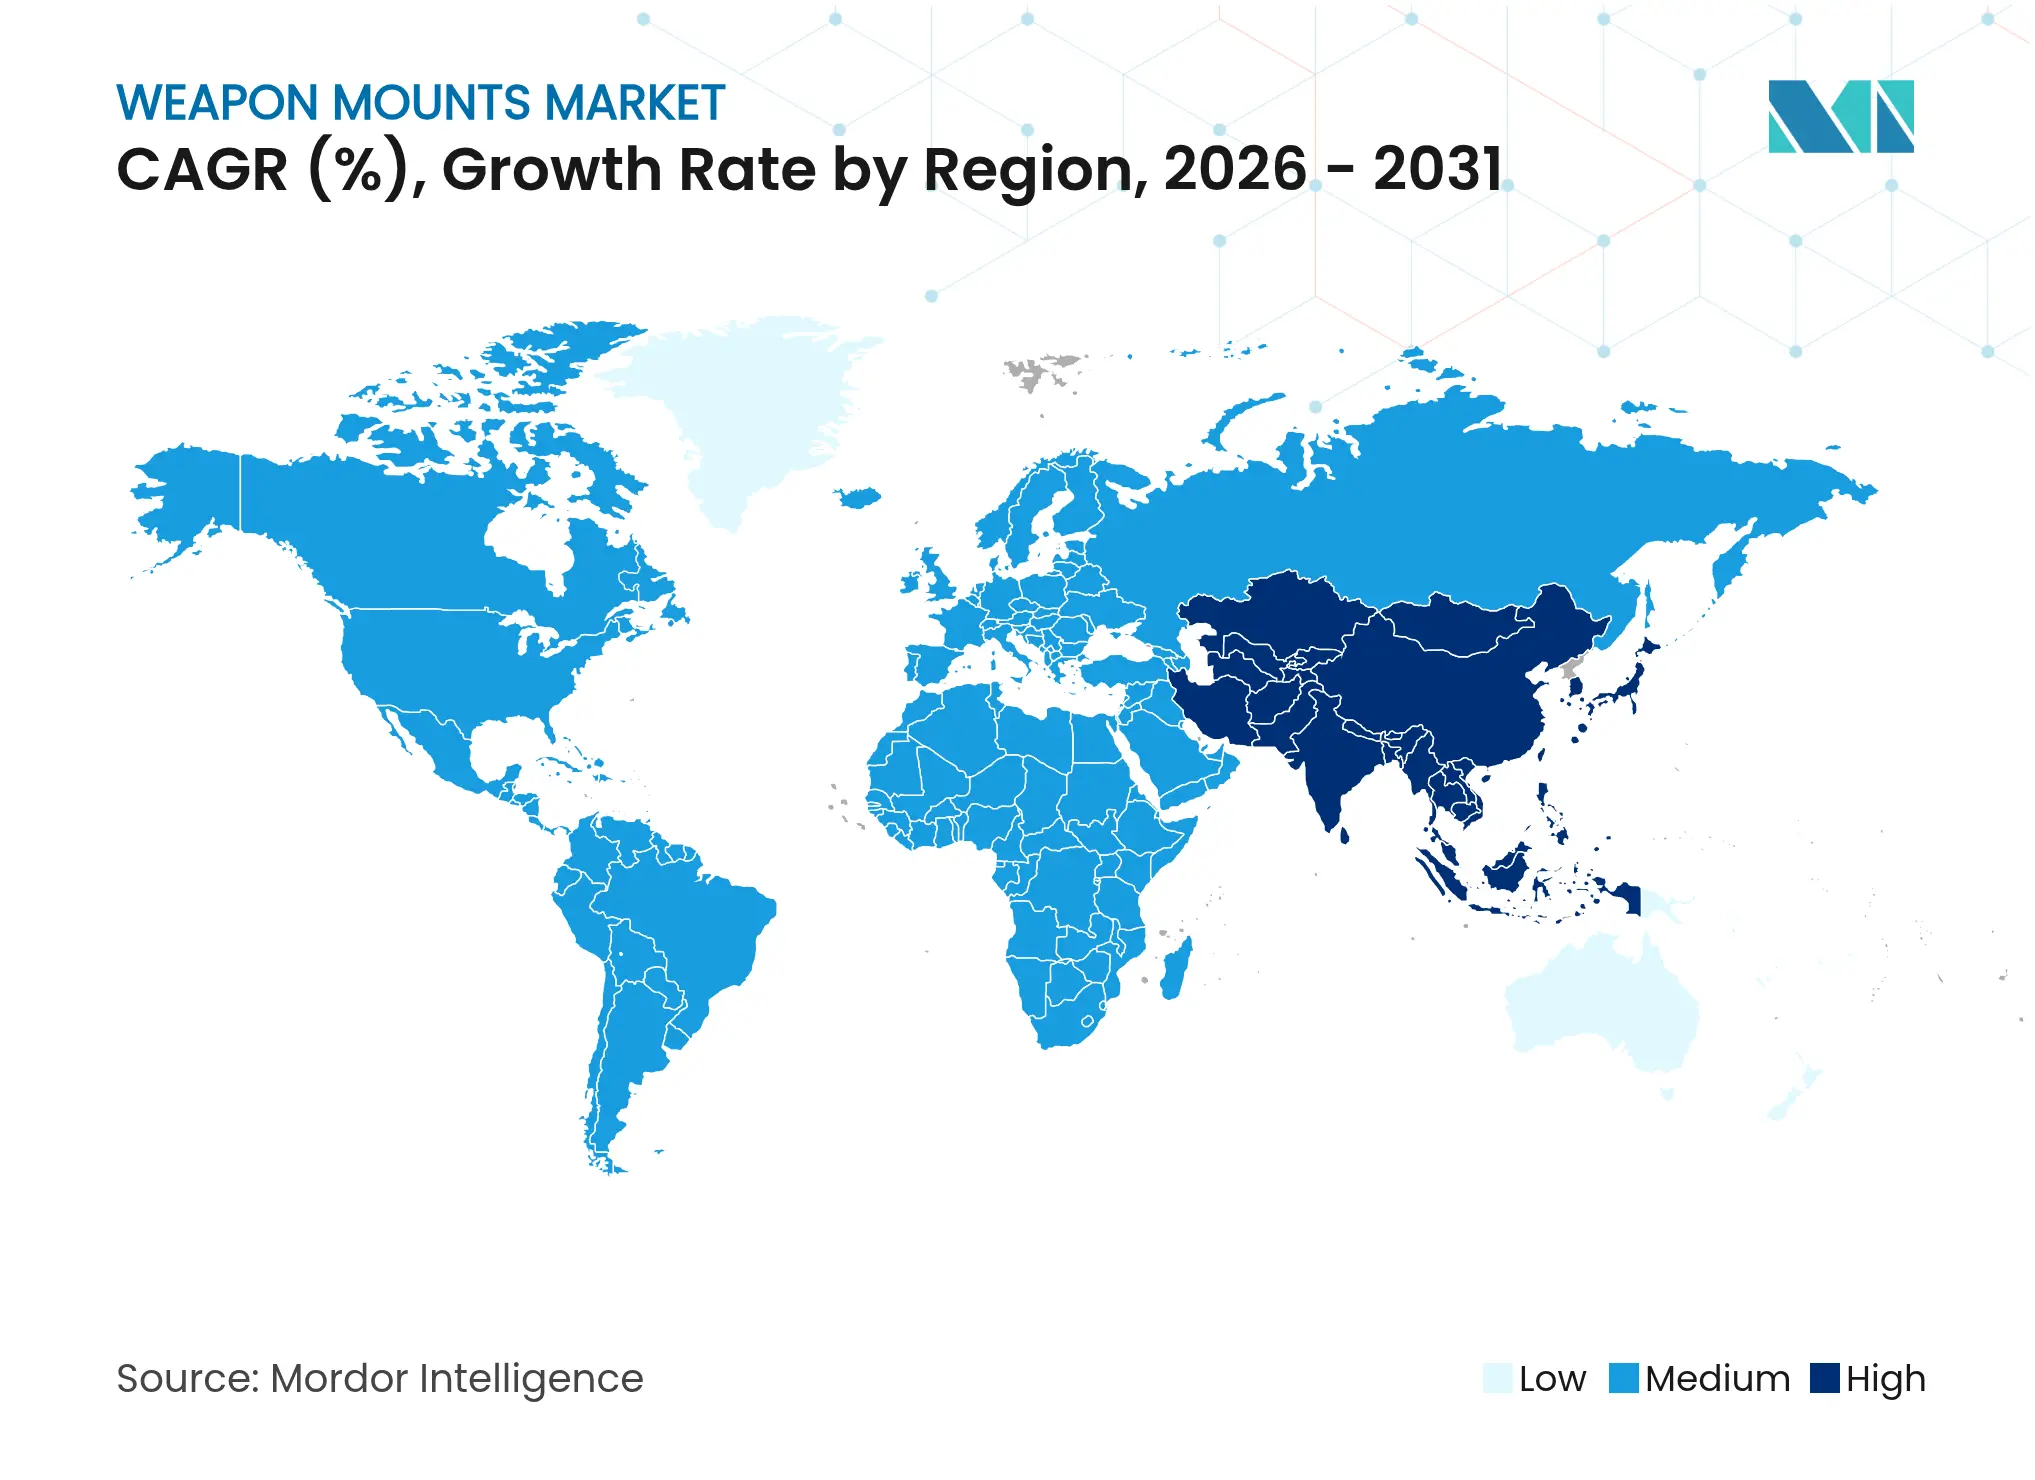
North America commanded 30.10% of the weapon mounts market in 2025, sustained by the US's USD 167.5 billion FY 2025 procurement docket that funds remote stations, turret upgrades, and autonomous combat vehicles. Programs such as the Marine Corps’ Advanced Reconnaissance Vehicle and Canada’s Arctic patrol initiatives demand mounts rated for extreme cold and salt-spray conditions, keeping regional suppliers at the forefront of material science and AI-sensor fusion.
Europe ranks second as NATO members accelerate rearmament. Germany, Poland, and the Nordic states commit multi-year budgets for infantry-fighting-vehicle retrofits, each specifying open-interface mounts compatible with 12.7 mm to 40 mm ordnance. The European Defence Fund encourages joint R&D on gyro-stabilized cradles, and field trials show accuracy gains when firing on the move. Consequently, European producers emphasize plug-and-play electronics and cyber-secure architectures that align with alliance tactical-network standards.
The Asia-Pacific weapon mounts market registers the fastest expansion at a 6.41% CAGR, propelled by maritime disputes and autonomous-system adoption. China’s fleet will reach nearly 395 ships by 2025, creating sustained demand for deck-mounted 30 mm cannons. India pursues self-reliance through the indigenous 12.7 mm remote station on its ‘Zorawar’ light tank, demonstrating home-grown production capacity. Japan and South Korea invest in AI-enabled naval mounts with compact AESA radars to counter swarming drones. These parallel initiatives broaden regional supplier ecosystems and heighten technology-transfer negotiations.
Market Concentration
The weapon mounts industry shows moderate concentration, led by Kongsberg Gruppen ASA, BAE Systems plc, Rheinmetall AG, and Elbit Systems Ltd.—firms that leverage scale for R&D spending and global service footprints. American Rheinmetall Systems (Rheinmetall AG) illustrates the shift toward intelligent mounts incorporating machine-learning algorithms and multispectral sensors that shrink the sensor-to-shooter loop.
Strategic alliances, licensing agreements, and offset production deals proliferate as vendors pursue growth in Asia-Pacific and the Middle East, where local content rules apply. Examples include joint ventures for turret integration on Indigenous armored vehicles and technology transfers enabling regional assembly of servo-actuator modules. Smaller specialists exploit open-architecture standards to supply drop-in sub-assemblies—optical pods, recoil-attenuation packs, or composite cradles—creating a tiered supplier landscape.
Innovation pipelines prioritize weight reduction via magnesium alloys, advanced stabilization for accuracy on high-speed craft, and embedded prognostic-health software that alerts crews to impending motor or gyro faults. Companies also position mounts as key nodes in short-range air-defense kill chains, integrating cueing from radar and electro-optical sensors to launch interceptors or high-powered microwave payloads. This convergence blurs traditional product categories and intensifies competition between gun-system integrators and directed-energy developers

*Disclaimer: Major Players sorted in no particular order
1. INTRODUCTION
2. RESEARCH METHODOLOGY
3. EXECUTIVE SUMMARY
4. MARKET LANDSCAPE
5. MARKET SIZE AND GROWTH FORECASTS (VALUE)
6. COMPETITIVE LANDSCAPE
7. MARKET OPPORTUNITIES AND FUTURE OUTLOOK
Market Definitions and Key Coverage
Segmentation Overview
Detailed Research Methodology and Data Validation
Primary Research
Desk Research
Market-Sizing & Forecasting
Data Validation & Update Cycle
Why Mordor's Weapon Mounts Baseline Commands Confidence
Benchmark comparison
| Market Size | Anonymized source | Primary gap driver | ||
|---|---|---|---|---|
USD 1.64 B (2024) | Mordor Intelligence | - | Anonymized source:Mordor Intelligence | Primary gap driver:- |
USD 1.92 B (2024) | Regional Consultancy A | Excludes retrofit kits on legacy fleets, inflating OEM share | ||
USD 6.42 B (2024) | Global Consultancy B | Counts remote stations, sensors, and stabilization electronics together, widening scope | ||
USD 1.30 B (2020) | Trade Journal C | Uses older base year and shipment-only approach without ASP adjustment |
Feasibility Analysis for FBO Services in East Africa
3 Min Read
Unlocking Opportunities in Singapore's Chemical Logistics Market
5 Min Read
When decisions matter, industry leaders turn to our analysts. Let’s talk.