
Market Overview
| Study Period | 2020 - 2031 |
|---|---|
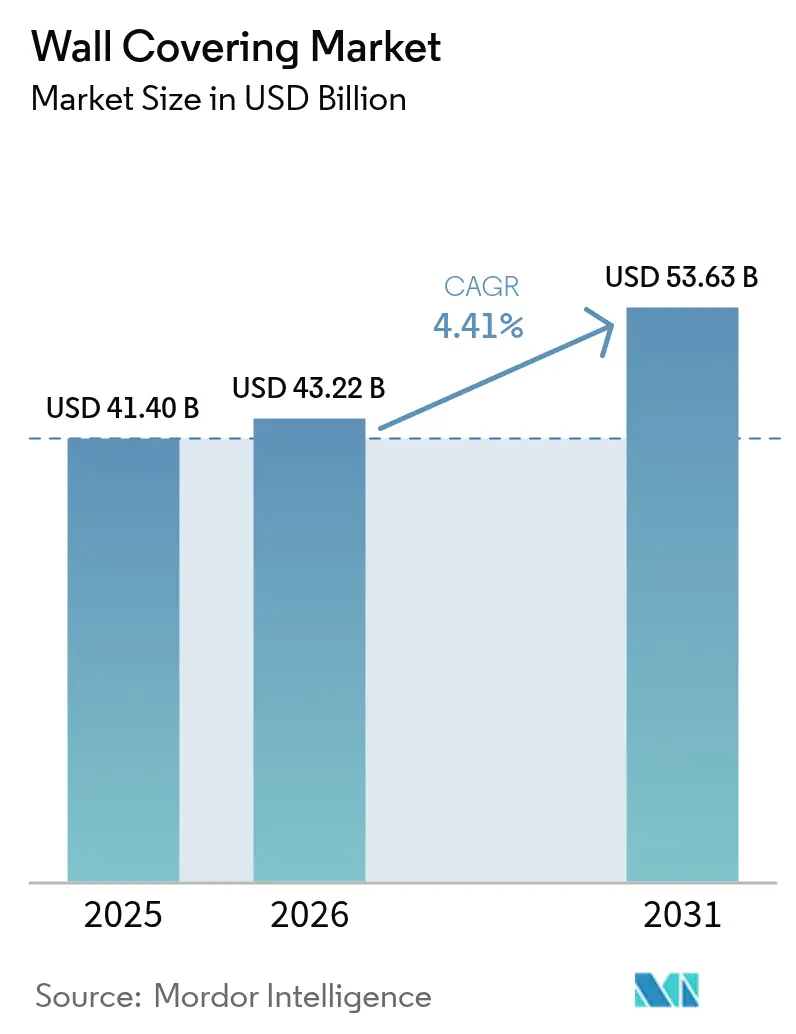
| Market Size (2026) | USD 43.22 Billion |
| Market Size (2031) | USD 53.63 Billion |
| Growth Rate (2026 - 2031) | 4.41 % |
| Fastest Growing Market | Asia Pacific |
| Largest Market | North America |
| Market Concentration | Medium |
Major Players *Disclaimer: Major Players sorted in no particular order Image © Mordor Intelligence. Reuse requires attribution under CC BY 4.0. | |
Wall Covering Market Analysis by Mordor Intelligence
The wall covering market size was valued at USD 41.40 billion in 2025 and estimated to grow from USD 43.22 billion in 2026 to reach USD 53.63 billion by 2031, at a CAGR of 4.41% during the forecast period (2026-2031). Current growth relies on brisk commercial refurbishment cycles, demand for modular acoustics, and tightening sustainability mandates that elevate bio-based substrates. Vinyl remains a revenue anchor because of durability and cost efficiency, yet wood and other plant-derived options are steadily eroding its dominance as owners target LEED credits and lower embodied carbon. North America commands the largest regional footprint, backed by green building codes and strong office and hospitality renovation outlays, while Asia-Pacific records the fastest advance as urbanization, middle-class incomes, and commercial construction converge. Competitive tactics concentrate on vertical integration, digital printing, and low-carbon innovation, with Armstrong World Industries, Saint-Gobain, and Shaw Industries standing out for multi-year acquisition and new-product pipelines. Volatile PVC prices and mounting demolition-waste fees represent near-term drags, yet material circularity programs and bio-based breakthroughs cushion the wall covering market against sharper slowdowns.
Key Report Takeaways
- By material, vinyl led with 37.78% wall covering market share in 2025, while wood-based substrates are projected to post a 6.17% CAGR through 2031.
- By product type, wallpaper accounted for 38.95% of the wall covering market size in 2025, and wall panels are set to expand at a 5.28% CAGR over the outlook window.
- By end-use, hospitality captured 27.84% of demand in 2025, whereas domestic housing is advancing at a 6.52% CAGR on the back of DIY and peel-and-stick adoption.
- By distribution channel, specialty stores held 30.74% revenue in 2025, although franchise outlets show the strongest momentum with a 5.08% CAGR as vendors deepen direct-to-consumer engagement.
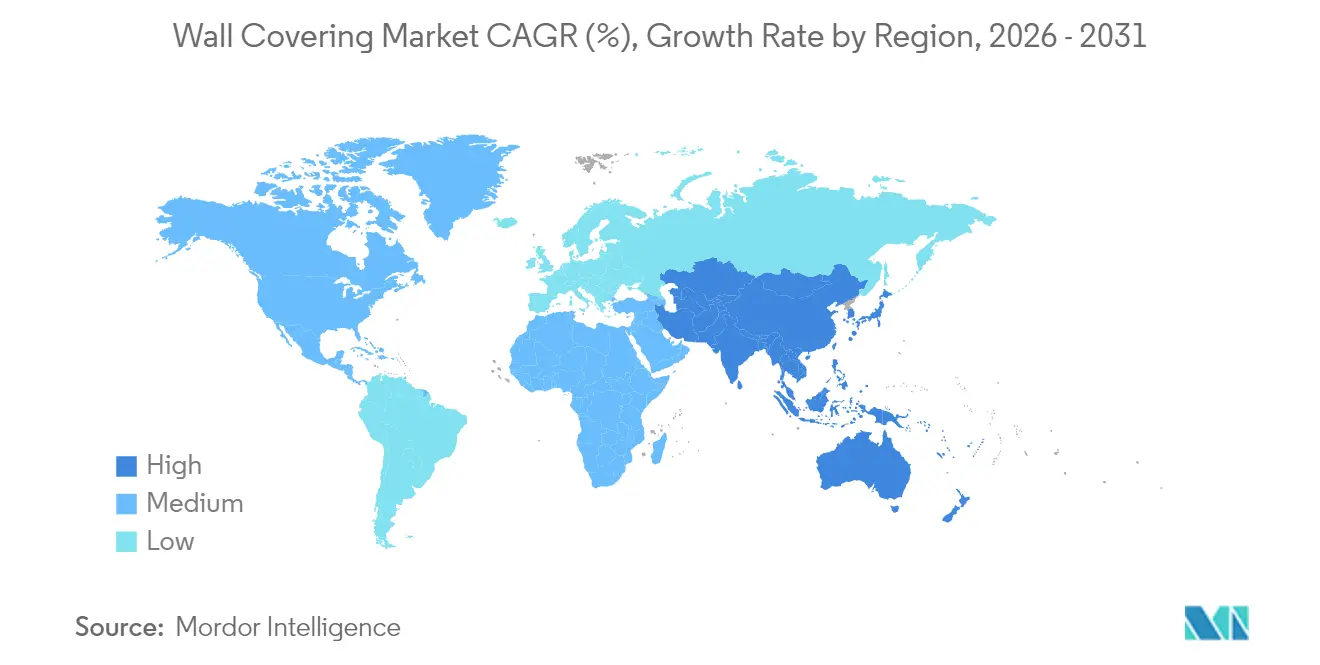
- By geography, North America dominated with 39.12% share in 2025; Asia-Pacific exhibits the strongest 7.86% CAGR outlook through 2031.
Note: Market size and forecast figures in this report are generated using Mordor Intelligence’s proprietary estimation framework, updated with the latest available data and insights as of 2026.
Market Trends and Insights
Drivers Impact Analysis of Wall Covering Market*
| Driver | (~) % Impact on CAGR Forecast | Geographic Relevance | Impact Timeline |
|---|---|---|---|
| Rapid urban refurbishment cycles | +0.8% | Global concentration in North America and Europe | Medium term (2-4 years) |
| Rise of vinyl-backed peel-and-stick solutions | +0.6% | North America and Asia-Pacific | Short term (≤ 2 years) |
| Commercial demand for modular acoustic wall panels | +0.7% | Global with early office uptake | Medium term (2-4 years) |
| Growth of DIY décor influencers on social media | +0.5% | North America and Europe | Short term (≤ 2 years) |
| Green-certified bio-based substrates | +0.9% | North America and EU | Long term (≥ 4 years) |
| Post-pandemic commercial interior upgrades | +0.6% | Global with hospitality and healthcare pivot | Medium term (2-4 years) |
| Source: Mordor Intelligence | |||
Rapid Urban Refurbishment Cycles Drive Commercial Demand
Office landlords and hotel operators are front-loading interior upgrades to shorten vacancy periods and conform to evolving workspace standards. Modular wall systems that minimize downtime while boosting acoustics have become preferred specifications. Shaw Industries’ pact with PPG for integrated flooring demonstrates supplier moves to own more of the renovation scope. Tarkett’s 35,000 m² vinyl installation at Joan Kirner Women’s and Children’s Hospital signals scale benefits in fast-track healthcare projects. [1]Tarkett, “Joan Kirner Women’s and Children’s Hospital Project,” tarkett.com These dynamics reinforce a premium on rapid installation, phased build-outs, and one-stop material sourcing, all of which propel the wall covering market.
Rise of Vinyl-Backed Peel-and-Stick Solutions Transforms Residential Market
Vinyl-backed peel-and-stick products trim install time to minutes and eliminate adhesives, turning renters into viable purchasers. Brands such as Tempaper, RoomMates, and Astek promoted influencer-ready collections that remove perceived complexity. Drytac’s 2024 PVC-free Paper Fleece Smooth iteration keeps pace with sustainability rhetoric without compromising consumer ease. Viral “before-and-after” clips deliver outsized marketing returns, cementing peel-and-stick as a strategic foothold in the wall covering market.
Commercial Demand for Modular Acoustic Wall Panels Accelerates
Hybrid work formats elevate acoustic privacy, nudging architects toward modular panels that meet noise criteria and allow speedy retrofits. ModularArts and Genesis Surfaces lead with sculpted surfaces and recycled-PET cores that marry aesthetics with sound attenuation. Healthcare interiors also adopt antimicrobial acoustic panels, linking patient comfort with infection control. The fusion of acoustics, hygiene, and plug-and-play installation underwrites premium pricing within the wall covering market.
Growth of DIY Décor Influencers on Social Media Reshapes Consumer Behavior
Influencers broadcast step-by-step installs, lowering entry barriers for homeowners. Peel and Paper, for example, designs renter-safe sheets expressly for content creation, tapping into the virality of room-makeover videos. Traditional wallpaper makers now tweak colorways and repeats to look striking in smartphone frames. Retailers report traffic spikes immediately after high-engagement posts, confirming that social proof is a rising purchase catalyst in the wall covering market.
Restraints Impact Analysis of Wall Covering Market*
| Restraint | (~) % Impact on CAGR Forecast | Geographic Relevance | Impact Timeline |
|---|---|---|---|
| Volatility in PVC and petrochemical feedstock prices | -0.9% | Global vinyl segment | Short term (≤ 2 years) |
| High landfill cost of demolition waste | -0.4% | EU and North America | Medium term (2-4 years) |
| Fire-code compliance hurdles for composite panels | -0.5% | Global commercial builds | Long term (≥ 4 years) |
| In-house digital printing eroding third-party demand | -0.3% | North America and Europe | Medium term (2-4 years) |
| Source: Mordor Intelligence | |||
Volatility in PVC and Petrochemical Feedstock Prices Pressures Margins
Spiking ethylene and chloride values make vinyl cost curves unpredictable. Orbia’s early-2025 cost rationalization shows manufacturers countering raw-material swings through overhead cuts and portfolio shifts. [2]Orbia, “Q1 2025 Cost-Cutting Initiatives,” orbia.com Asian PVC spot markets add extra turbulence, exposing export-oriented converters to exchange-rate and freight shocks. Substitution toward bio-based laminates offers a hedge, but scaling capacity remains capital intensive, slowing short-term relief in the wall covering market.
High Landfill Cost of Demolition Waste Adds Disposal Burdens
Regulators in the EU and select U.S. states ratchet landfill levies, raising end-of-life costs for wall coverings, especially vinyl. Contractors now bake recycling fees into bids, altering cost comparisons versus paint and direct-apply surfaces. Manufacturers respond with take-back schemes and mechanically recycled vinyl loops, yet wide adoption lags. Disposal economics therefore trim near-term margins in the wall covering market.
*Our forecasts treat driver/restraint impacts as directional, not additive. The impact forecasts reflect baseline growth, mix effects, and variable interactions.
Wall Covering Market Segment Analysis
By Material:
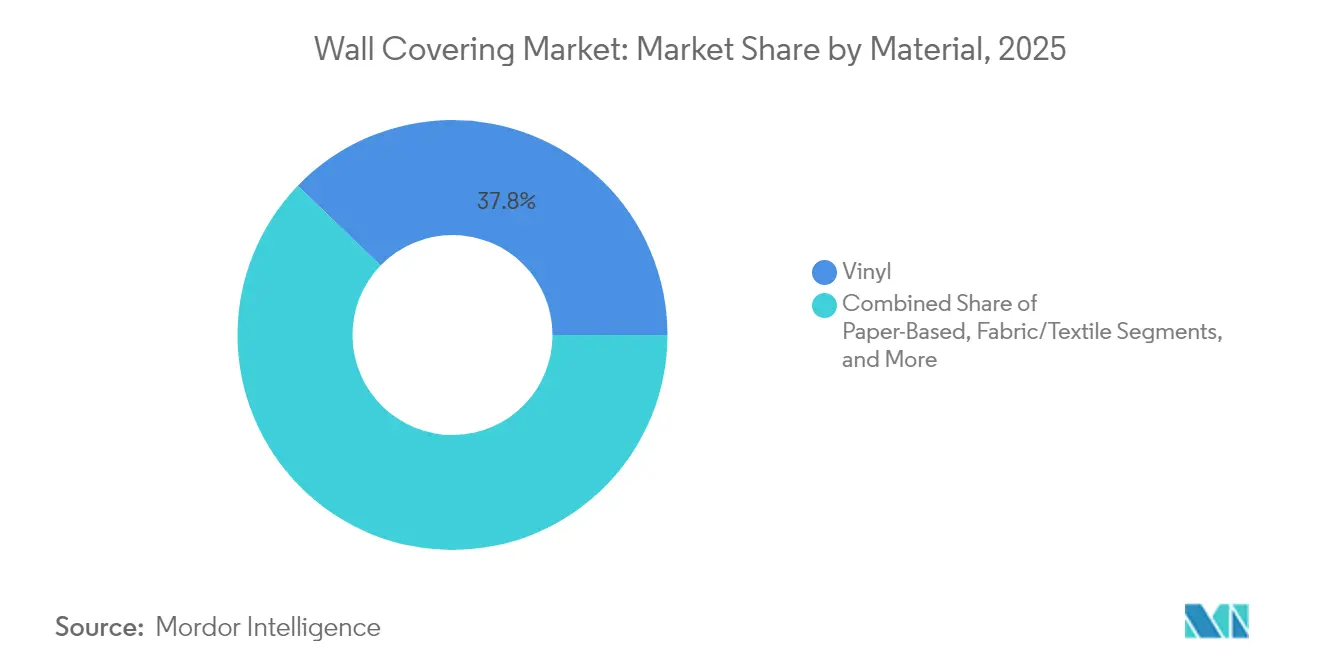
Vinyl Dominance Faces Bio-Based ChallengeVinyl contributed 37.78% wall covering market share in 2025 on the strength of water resistance, print versatility, and modest install costs. The wood category’s 6.17% CAGR underscores a pivot toward biophilic design and eco labels, with cork, bamboo, and engineered timber veneers meeting stringent low-VOC limits that attract commercial specifiers. Vinyl suppliers counter with recycling programs and ultralow-emission plasticizers, seeking to retain position as bio-based materials bite into the wall covering market.
Production scale sets the competitive pace. IZODEKOR’s 750,000 m² annual output of 3-D panels highlights capital depth among innovation-minded players. Kirkby Design’s 2025 recycled-cotton launch fuses textile feel with reclaimed content, positioning fabric-wall alternatives for boutique hotels and premium residential niches. The tug-of-war between vinyl’s installed base and rising eco criteria will define material share shifts within the wall covering market through 2031.



By Product Type:
Wall Panels Emerge as Growth LeaderWallpaper accounted for 38.95% of the wall covering market size in 2025, spanning vinyl, non-woven, and fabric backings that suit diverse pattern and durability needs. Wall panels, however, are projected to outpace all other formats at a 5.28% CAGR because they marry acoustic control with rapid clip-on installation that compresses labor hours.
Open-plan offices and schools intensify the call for noise mitigation, pushing producers like New York Soundproofing to amplify design-forward acoustic lines. Amico Architectural’s Medtronics health-care fitout underscores how modular panels accelerate large-footprint jobs without extended shutdowns. These dynamics lift wall panels from niche to mainstream status inside the wall covering market.
By End-Use Industry:
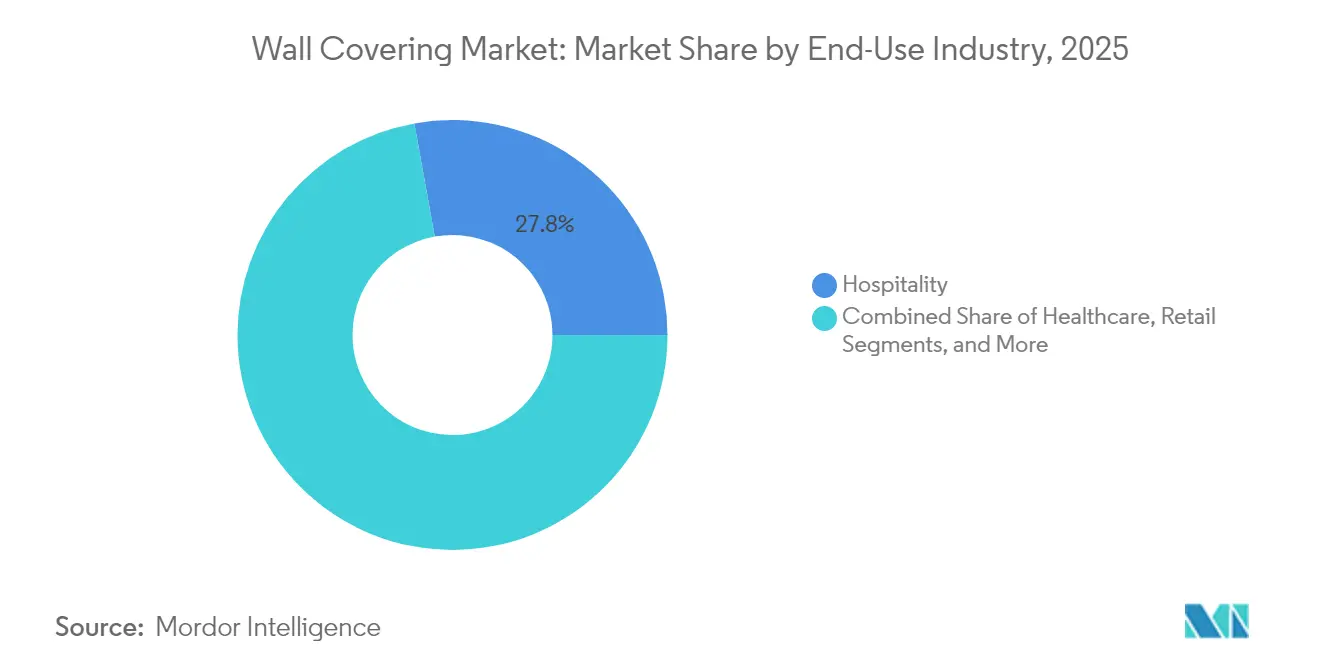
Domestic Housing Accelerates Past Commercial SegmentsHospitality maintained the largest slice at 27.84% in 2025 as hotels cycle through frequent brand refreshes that favor bold prints and durable, cleanable topcoats. Domestic housing, buoyed by pandemic-era home investment habits and social-media tutorials, records the top growth at 6.52% CAGR.
Longboard’s Baptist MD Anderson Cancer Center project illustrates healthcare’s exacting standards for hygiene, fire safety, and patient wellbeing, justifying premium rates within the wall covering market. Conversely, homeowner demand hinges on perceived ease: peel-and-stick and removable fabric murals dominate carts, expanding addressable volume beyond traditional contractor channels.
By Distribution Channel:
Franchise Stores Challenge Traditional RetailSpecialty outlets delivered 30.74% revenue in 2025 through deep product knowledge and installation services, retaining loyalty among contractors and discerning consumers. Franchise stores, though, should post a 5.08% CAGR as vendors seek tight brand control with local reach. Shaw Floors’ Pet Perfect+ range exemplifies franchise-ready lines that package stain resistance and do-it-yourself tutorials.
E-commerce grows fastest in skew-count yet still trails physical store revenue because tactile assessment and pro-install bundling remain purchase essentials for many buyers. Mixed-channel strategies that blend online visualization with in-store pickup are changing the go-to-market calculus across the wall covering market.
Geography Analysis
North America Wall Covering Market
North America recorded the largest regional revenue in 2025 on the back of robust commercial remodel demand, deep distribution networks, and progressive energy and indoor-air codes. United States spending on corporate re-stacking and hospitality lobbies sustains premium price points, while Canada benefits from institutional upgrades in healthcare and education. Mexico adds steady low-to-mid-grade volume to the wall covering market through shopping-mall and resort pipelines.
APAC Wall Covering Market
Asia-Pacific is projected to deliver a 7.86% CAGR, the fastest worldwide, powered by China’s infrastructure surge, India’s expanding middle-class housing, and Southeast Asian hospitality corridor growth. Affordable peel-and-stick wallpaper gains traction among first-time urban homeowners, while Japanese and Australian designers specify bio-based wall coverings to meet wellness objectives in mature high-end markets. Regulatory harmonization and rising preference for modular acoustic panels push the wall covering market deeper into the region’s grade-A office buildout cycle.
EMEA and South America Wall Covering Market
Europe maintains a sustainability-driven trajectory. Germany and France head adoption of PVC-free laminates under tightened EPD and circular-economy rules. United Kingdom hotel brands re-skin interiors every two to three years, channeling consistent retrofit flow. Italy and Spain contribute design know-how and small-batch digital-print capacity. South America shows incipient demand focused on Brazilian and Argentine mixed-use complexes, whereas the Middle East and Africa cluster growth around UAE leisure hubs and Saudi Vision 2030 public-sector investments.

Regulatory Landscape
Wall coverings are increasingly specified and traded under a compliance stack that combines indoor-air and chemical disclosure, fire-performance requirements for commercial interiors, and end-of-life obligations tied to waste and circular-economy policies. In Europe, disposal costs and circular-economy rules already influence material choices, and regulatory change continues through the Packaging and Packaging Waste Regulation (Regulation (EU) 2025/40), which entered into force on 11 February 2025 and applies from 12 August 2026. While packaging-focused, it reinforces market-wide pressure for material minimisation and harmonised labelling approaches that many building-material and decor suppliers reflect in their product information practices.
Industry bodies also shape compliance pathways through standards and test methods used by specifiers, contractors, and insurers, which affects adoption of composite wall panels and digitally printed surfaces. In the United States, adjacent print-and-substrate supply chains intersect with federal chemical compliance where color additives in paper and paperboard intended for food contact fall under the U.S. FDA framework (21 CFR Parts 73, 74, and relevant food-contact provisions). As a result, due diligence on inks, coatings, and additives has become routine across wallcovering supply networks when products share converters, pigments, and printing chemistries.
Value Chain Analysis
The wall covering value chain runs from upstream petrochemical and bio-based feedstocks (PVC resins, plasticizers, and increasingly wood, cork, bamboo, and recycled fibers), through specialty chemicals such as adhesives and coatings, including antimicrobial or stain-resistant finishes, and pigment systems such as titanium dioxide that can be cost-sensitive. Converters and manufacturers then laminate, coat, emboss, and print using rotogravure, screen, and an increasing share of digital latex/UV processes, before converting into rolls, panels, and modular acoustic systems with hardware and installation accessories. Recent supply volatility continues to shape procurement and production planning, for example, LX Hausys issued dealer notices in March 2026 flagging PVC supply instability and potential delivery delays in April and May 2026, highlighting exposure of vinyl-heavy categories to geopolitical and logistics disruptions.
Midstream players are using vertical integration and automation to shorten lead times, reduce scrap, and localize short runs, which aligns with demand for customized decor and fast commercial refurbishment cycles. Downstream, distribution stays multi-channel, with specialty stores and franchise formats bundling design support and installation services, while e-commerce supports visualization, sampling, and direct-to-consumer peel-and-stick orders. Contractors, architects, and facility owners close the loop through take-back schemes and recycling pilots where available, as landfill and demolition-waste fees in parts of North America and Europe increasingly influence total installed cost decisions.
Competitive Landscape
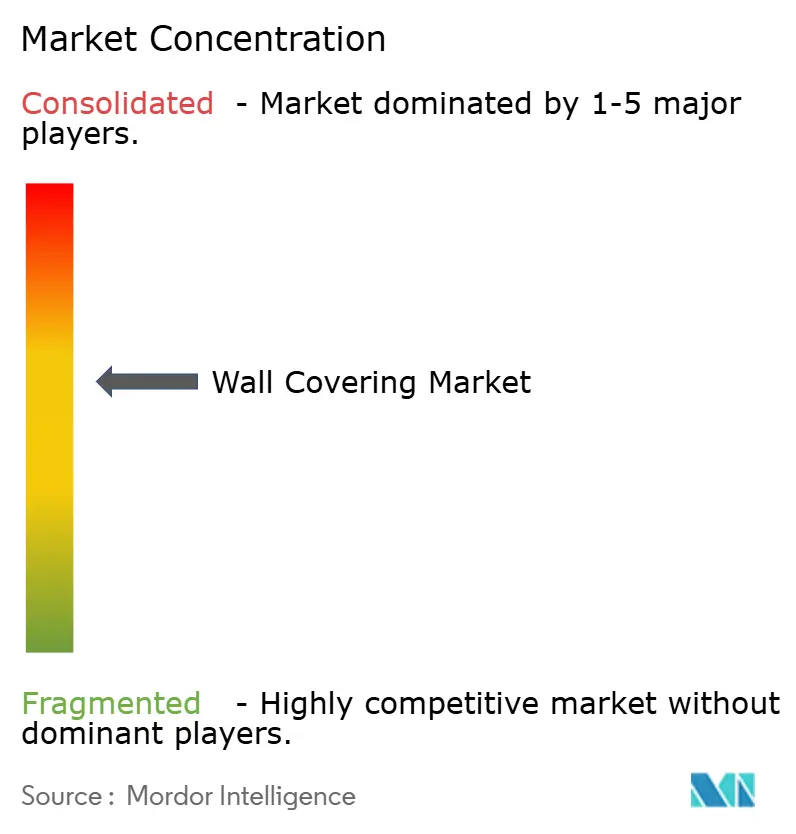
The wall covering industry sits in the moderate range of fragmentation: no single entity controls universal share, but established players occupy defensible niches. Armstrong World Industries executed 12 deals since 2016, layering acoustical ceilings with wall products to widen architectural influence. Saint-Gobain banks on low-carbon gypsum launches to cement green leadership, while Shaw Industries uses flooring relationships to cross-sell walls in renovation bids. [4] Saint-Gobain, “CarbonLow™ Wallboard,” saint-gobain.com
Vertical integration into printing, substrates, and adhesives buttresses margins against raw-material swings. Firms invest in multi-pass latex and UV machines that enable local short runs, shortening lead times and cutting freight. Niche entrants such as bio-material innovators partner with converters to fast-track code approvals, injecting fresh competition into the wall covering market.
Price rivalry widens in commodity vinyl but narrows in premium acoustic and sustainable formats where performance differentiators trump unit cost. Certifications-fire, low-VOC, and carbon-have become competitive table stakes. Players that couple multi-attribute compliance with design variety secure specification advantage, especially in government and healthcare procurement.
Wall Covering Industry Leaders
Saint-Gobain Adfors SA
Ahlstrom-Munksjö Oyj
AS Création Tapeten AG
Asian Paints Limited
Benjamin Moore & Co.
- *Disclaimer: Major Players sorted in no particular order
Wall Covering Market Companies Covered in this Report
- Saint-Gobain Adfors SA
- Ahlstrom-Munksjö Oyj
- AS Création Tapeten AG
- Asian Paints Limited
- Benjamin Moore & Co.
- Brewster Home Fashions LLC
- York Wallcoverings, Inc.
- J. Josephson Inc.
- Walker Greenbank PLC
- Grandeco Wallfashion Group NV
- Graham & Brown Ltd.
- F. Schumacher & Co. LLC
- Rasch GmbH & Co. KG
- Mohawk Industries, Inc.
- Armstrong World Industries, Inc.
- 3M Company
- Ceramiche Caesar S.p.A.
- Shaw Industries Group, Inc.
- Interface, Inc.
- Kingfisher plc

Market Opportunities and Future Outlook
Whitespace is forming around faster-turn, design-to-dispatch wallcoverings that fit commercial refurbishment schedules and residential DIY behavior, while meeting tighter sustainability and indoor-air targets. Investments in digital capacity and finishing are shifting more demand from long-run analog production to short runs and repeatable customization. Wallquest expanded its digital production facility in Wayne, Pennsylvania in February 2026 by adding four HP Latex FS70 W printers, and reported a 30% performance increase, which supports higher SKU counts, faster replenishment, and lower inventory risk for pattern-heavy portfolios.
Material and chemistry choices also open room in PVC-free, low-VOC systems and in modular assemblies that simplify installation and end-of-life handling, particularly for acoustic wall panels specified in offices, education, and healthcare. Suppliers with control over substrates, coatings, and printing can respond more effectively to waste-fee pressure and specification-driven requirements, while localized production networks help hedge freight variability and shorten lead times. At the same time, manufacturers and brand owners are adopting multi-sourcing and more resilient procurement models to manage input volatility (PVC, adhesives, pigments), which supports entrants and incumbents that can qualify alternative substrates and deliver consistent aesthetics across regions.
Recent Industry Developments in Wall Covering Market
- July 2026: Saint-Gobain announced a definitive agreement to acquire a glass fiber plant in Lexington, North Carolina, strengthening its North American supply chain for glass mat used in moisture-resistant reinforced plasterboard and related light construction applications. The move tightens control over a critical reinforcement input that can affect availability and performance of wall and interior building products. It also supports broader vertical-integration strategies that larger building-material groups use to stabilize cost and lead-time variability.
- July 2026: Ahlstrom expanded its global pressure sensitive adhesive (PSA) labeling offering by introducing new release paper manufactured in Brazil. The development adds regional capacity and product breadth in specialty paper grades that share converters and adhesive ecosystems with decorative and interior surfacing supply chains. It also reflects continued supplier focus on specialty substrates and engineered surfaces rather than purely commodity paper grades.
- December 2024: Fine Print NYC increased its digital-print capacity to 100,000 ft2 per week for wall graphics and related large-format production. Higher capacity enables shorter lead times and supports the growing mix of customized, short-run wall applications demanded by retail, hospitality, and experiential interiors. The expansion also intensifies competitive pressure on traditional long-run print workflows by improving responsiveness and job turnaround.


Wall Covering Market Report Scope and Research Methodology
Market Definition and Coverage
For this methodology, the wall covering market is the revenue from products installed on interior walls to protect the surface and improve the look, covering both residential and commercial buildings.
Scope exclusions: We exclude paint, loose wall art, and decor items that do not function as an installed wall covering.
Segments Covered in This Report
- By Material
- Paper-Based
- Fabric/Textile
- Wood-Based
- Vinyl
- Other Materials
- By Product Type
- Wall Panel
- Wallpaper
- Vinyl Wallpaper
- Non-woven Wallpaper
- Paper-based Wallpaper
- Fabric Wallpaper
- Other Wallpaper Types
- Tile
- Metal Wall Covering
- Other Product Types
- By End-use Industry
- Hospitality
- Healthcare
- Retail
- Corporate Offices
- Education
- Domestic Housing
- Industrial Facilities
- Other End-use Industries
- By Distribution Channel
- Specialty Store
- Franchise store
- E-commerce
- Other Distribution Channels
- By Geography
- North America
- United States
- Canada
- Mexico
- South America
- Brazil
- Argentina
- Rest of South America
- Europe
- United Kingdom
- Germany
- France
- Spain
- Italy
- Rest of Europe
- Asia-Pacific
- China
- India
- Japan
- Australia
- South Korea
- Rest of Asia-Pacific
- Middle East and Africa
- Middle East
- Saudi Arabia
- United Arab Emirates
- Turkey
- Rest of Middle East
- Africa
- South Africa
- Kenya
- Rest of Africa
- Middle East
- North America
Data Sources, Market Sizing, and Validation
Desk Research
Desk research was used to build the starting point for demand and supply signals, and then to set practical boundaries around what counts as a wall covering in revenue terms. We referred to public construction and housing indicators (new builds and renovation activity), and trade and pricing signals that help explain why wall covering demand changes by region and by project cycle.
Sources used include, as examples, construction output and permits data from agencies such as the US Census Bureau, international macro and construction indicators from groups such as the World Bank and OECD, trade and tariff statistics from UN Comtrade and national customs dashboards, and standards or material guidance from industry associations linked to wallpaper, wall panels, and tile. We also reviewed company filings, investor presentations, and reputable press coverage, and then supplemented gaps using paid subscriptions for company financials and intelligence, patents, and import or export shipment-level checks where useful. These examples are not exhaustive, and many other public sources were also used for data collection, validation, and clarification.
Primary Interviews and Surveys
Primary work focused on validating the definition and the pricing and volume assumptions that move totals the most, especially across wallpaper, wall panels, tile, and metallic wall coverings. We spoke with a mix of manufacturers, distributors, installers, and large buyers across APAC, EMEA, and the Americas, and the feedback was used to confirm demand drivers, realistic adoption in renovation versus new construction, and the pace of price changes in key materials.
Distribution of primary research fieldwork respondents
| Company type | Respondent position | Region |
|---|---|---|
| Top tier: 28% | CXOs: 12% | APAC: 44% |
| Mid tier: 51% | Functional/Unit leaders: 35% | EMEA: 37% |
| Smaller Players: 21% | Managers: 53% | Americas: 19% |
Market-Sizing & Forecasting
Sizing starts with a top-down build that reconstructs the addressable spend from construction and renovation activity, and then allocates that spend to wall coverings using penetration and usage patterns validated by interviews. In practice, the model is anchored on indicators such as residential completions and remodeling intensity, commercial fit-out cycles, wall area assumptions by building type, mix shifts across wallpaper versus panels and tile, and average selling price ranges by material and distribution channel.
Those totals are then pressure-tested with selective bottom-up approximations, such as rolling up a sample of supplier revenues, checking channel markups, and using sampled ASP times volume logic for key product groups where data is visible. When gaps appear in bottom-up views (for example, private players with limited disclosure), we fill them using share estimates derived from trade flows, installed base activity, and distributor feedback, and then re-balance to stay consistent with the top-down demand pool.
For forecasting, we used scenario analysis supported by simple regression-style relationships between wall covering demand and construction output, renovation spend, and material price inflation. Assumptions on mix, pricing progression, and regional growth were adjusted only after expert feedback aligned with observable construction and trade signals.
Data Validation & Update Cycle
Model outputs are checked against independent signals like construction cycles, trade values, and price movements, so large jumps can be explained before they are accepted. Variance checks are run by region and product group, and then the logic and calculations go through a multi-step analyst review so unit assumptions, currency handling, and growth drivers stay consistent.
When an outlier appears, follow-up interviews are triggered to confirm whether it reflects a real market change (such as a material substitution trend) or a data issue. Reports are refreshed annually, with interim updates when material events occur, and a final pre-delivery review is completed so the published numbers reflect the latest available indicators.
Mordor Intelligence's Wall Covering Market Estimate Compared With Other Published Estimates
Published market values for wall coverings can differ even when the topic sounds the same, because each publisher chooses its own product boundaries, year anchors, and pricing treatment. Differences also come from whether the estimate is tied more to construction demand signals or more to supplier-side rollups, which can vary in coverage.
The key gaps usually show up in what gets counted as a wall covering (for example, whether adjacent interior finishing categories are included), how renovation versus new construction is weighted, and how currency timing and inflation are handled in the base year before forecasting.
Benchmark comparison
| Source | Market Size | Gaps in Research Methodology |
|---|---|---|
| Mordor Intelligence | USD 41.40 B (2025) | |
| Industry Research Publisher A | USD 40.70 B (2025) | Uses a similar headline label but applies a different product mix weighting and regional share split, and it can understate categories like wall panels where installation practices vary by country. |
| Global Research Publisher B | USD 41.87 B (2024) | Anchors the model on a different base year and includes paints and coatings as part of wall covering, which expands the addressable value beyond installed wall covering products. |
The table shows a tight cluster in the low-40s range, and the spread mainly comes from scope and base-year choices rather than a disagreement on underlying construction activity. In Mordor Intelligence's model, only installed wall covering product categories are counted (such as wallpaper, wall panels, tile, and metallic wall coverings), and the 2025 value is kept consistent with renovation and new build signals before the forecast is applied.


Key Questions Answered in the Report
How large is the wall covering market in 2026?
The wall covering market size is USD 43.22 billion in 2026.
What is the expected growth rate for wall coverings through 2031?
The global CAGR is projected at 4.41%, lifting revenue to USD 53.63 billion by 2031.
Which product format is growing fastest?
Modular acoustic wall panels are forecast to expand at a 5.28% CAGR thanks to office and healthcare demand.
Why are vinyl prices affecting manufacturers?
Volatile PVC feedstock costs compress margins, prompting firms to diversify into bio-based alternatives.
Which region will see the fastest demand increase?
Asia-Pacific leads with an expected 7.86% CAGR, driven by urban housing and commercial construction.
What sustainability trend is shaping material choices?
Growing adoption of PVC-free and bio-based substrates aligns with LEED and other green-building criteria.
Page last updated on:





