
Market Overview
| Study Period | 2021 - 2031 |
|---|---|
| Market Size (2026) | USD 108.32 Billion |
| Market Size (2031) | USD 145.26 Billion |
| Growth Rate (2026 - 2031) | 6.05 % |
| Fastest Growing Market | Asia Pacific |
| Largest Market | North America |
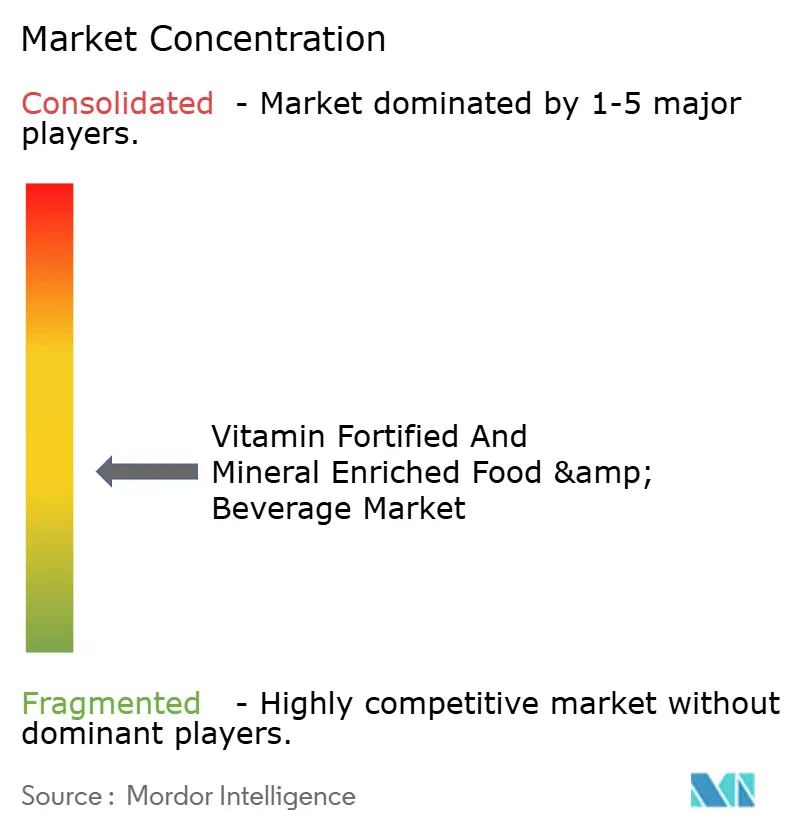
| Market Concentration | Medium |
Major Players
*Disclaimer: Major Players sorted in no particular order Image © Mordor Intelligence. Reuse requires attribution under CC BY 4.0. |
|
Vitamin Fortified And Mineral Enriched Food And Beverage Market Analysis by Mordor Intelligence
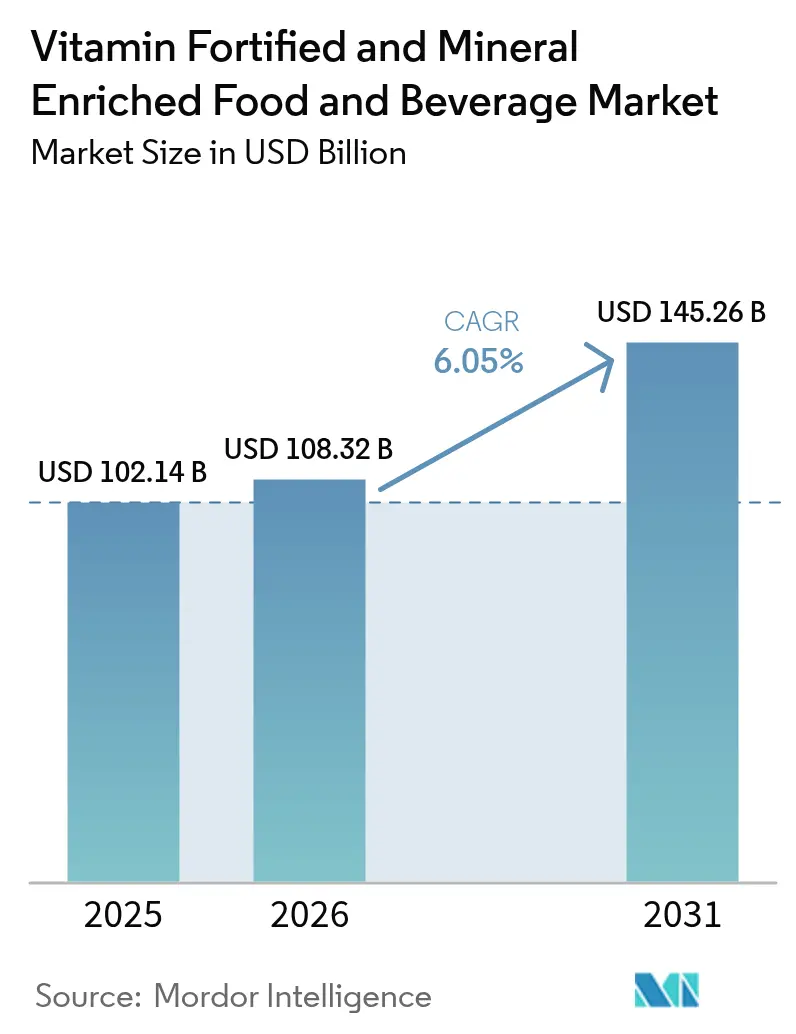
Vitamin Fortified and Mineral Enriched Food & Beverage market size in 2026 is estimated at USD 108.32 billion, growing from 2025 value of USD 102.14 billion with 2031 projections showing USD 145.26 billion, growing at 6.05% CAGR over 2026-2031. This growth is driven by increasing consumer awareness about the health benefits of vitamin and mineral fortification, rising prevalence of nutritional deficiencies, and increasing demand for functional foods and beverages that support immunity and overall wellness. Busy lifestyles and growing health consciousness among consumers further stimulate demand for convenient, nutrient-enriched products such as cereals, dairy, beverages, and infant formulas. Additionally, robust government initiatives and favorable regulatory frameworks aimed at combating malnutrition globally are bolstering market expansion. Emerging markets with rising disposable incomes and advancements in food fortification technologies also contribute significantly to the sustained growth trajectory of this market.
Key Report Takeaways
- By product type, beverages led with 35.98% of vitamin fortified and mineral enriched food & beverage market share in 2025, while infant formulas posted the fastest growth at 6.95% CAGR through 2031.
- By nature, conventional products accounted for 79.05% of the vitamin fortified and mineral enriched food & beverage market size in 2025; organic alternatives are forecast to expand at 7.25% CAGR during 2026-2031.
- By packaging, bottles retained 41.92% share in 2025; Tetrapack is projected to register the highest CAGR of 7.58% to 2031.
- By distribution channel, supermarkets/hypermarkets captured 44.80% share in 2025, whereas online retail stores are projected to grow at 7.66% CAGR.
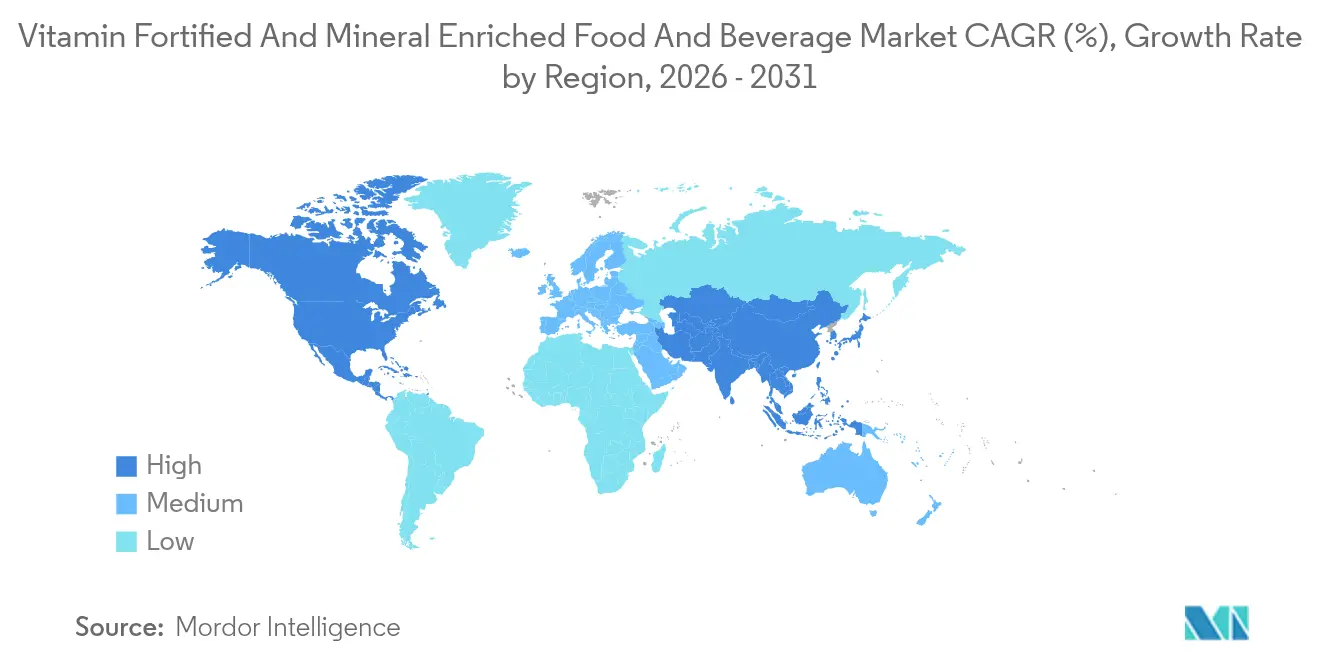
- By geography, North America held 31.05% share of the vitamin fortified and mineral enriched food & beverage market in 2025, while Asia-Pacific is poised for 7.28% CAGR through 2031.
Note: Market size and forecast figures in this report are generated using Mordor Intelligence’s proprietary estimation framework, updated with the latest available data and insights as of 2026.
Market Trends and Insights
Drivers Impact Analysis of Vitamin Fortified And Mineral Enriched Food And Beverage Market*
| Driver | (~) % Impact on CAGR Forecast | Geographic Relevance | Impact Timeline |
|---|---|---|---|
| Increasing health consciousness and growing consumer preference for nutritious food products | +1.8% | Global, with premium positioning in North America and Europe | Medium term (2-4 years) |
| Rising prevalence of nutritional deficiencies and diet-related diseases globally | +2.1% | Global, concentrated in emerging markets | Long term (≥ 4 years) |
| Government initiatives and regulatory support encouraging food fortification to address malnutrition | +1.5% | Asia-Pacific, Sub-Saharan Africa, South America | Long term (≥ 4 years) |
| Rising adoption of fortified products among infants and children | +0.9% | Global, with regulatory focus in developed markets | Medium term (2-4 years) |
| Demand growth in emerging markets due to increasing awareness | +1.2% | Asia-Pacific, Middle East, South America | Long term (≥ 4 years) |
| Innovations in product flavors, packaging, and plant-based fortified alternatives | +0.7% | North America, Europe, urban Asia-Pacific | Short term (≤ 2 years) |
| Source: Mordor Intelligence | |||
Increasing health consciousness and growing consumer preference for nutritious food products
Increasing health consciousness and a growing consumer preference for nutritious food products are key drivers fueling the growth of the Vitamin Fortified and Mineral Enriched Food & Beverage Market. As more consumers prioritize their health and wellness, they seek foods and beverages enriched with essential vitamins and minerals that offer added nutritional benefits beyond basic sustenance. According to Glanbia Nutritionals' 2023 report, 72% of consumers prefer functional beverages with added health benefits, while 44% actively seek products made with natural ingredients [1]Source: Glanbia Nutritionals, "European Functional Beverage Market Insights for 2023," glanbianutritionals.com.. This trend is especially strong among health-aware populations who recognize the advantages of fortified products for immune support, cognitive function, and overall well-being. Rising disposable incomes in developing regions further accelerate demand, as consumers are willing to pay premium prices for foods aligned with their health goals. Additionally, the convenience of fortified foods fits well into busy lifestyles, broadening their appeal. Government initiatives and regulatory support promoting food fortification to combat nutrient deficiencies also contribute significantly to market expansion worldwide
Rising prevalence of nutritional deficiencies and diet-related diseases globally
As nutritional deficiencies and diet-related diseases become increasingly prevalent, the market for vitamin-fortified and mineral-enriched food and beverages is witnessing significant growth. Millions around the globe grapple with insufficient nutrient intake, and as the burden of chronic diseases intensifies, fortified foods and beverages emerge as essential solutions. These products not only help bridge nutritional gaps but also contribute to improving overall health outcomes by addressing specific dietary deficiencies. The International Diabetes Federation (IDF) reported that in 2024, around 589 million adults aged 20-79 were living with diabetes [2]Source: International Diabetes Federation, "Diabetes around the world in 2024", idf.org. Alarmingly, this figure is set to soar to 853 million by 2050, highlighting the growing health challenges faced by populations worldwide. This escalating diabetes crisis, coupled with other diet-related ailments such as obesity and cardiovascular diseases, underscores the urgent demand for nutrient-enriched products. Such products play a pivotal role in managing and preventing these conditions by providing essential vitamins and minerals, thereby driving the global appetite for vitamin and mineral fortification.
Government initiatives and regulatory support encouraging food fortification to address malnutrition
Government initiatives and regulatory support play a crucial role in encouraging food fortification as a strategic intervention to address malnutrition globally. Many governments have implemented mandatory fortification policies that legally require the addition of essential vitamins and minerals to staple foods such as wheat flour, maize flour, and rice, significantly increasing the availability of fortified foods in vulnerable populations. For instance, according to the Food Fortification Initiative, as of 2023, 94 countries have implemented mandatory fortification of at least one industrially milled cereal grain, such as wheat flour, maize flour, or rice[3]Source: Food Fortification Initiative, "Global Progress," ffinetwork.org. In . International organizations like the World Food Programme (WFP), the Food Fortification Initiative (FFI), and the Global Alliance for Improved Nutrition (GAIN) actively support countries by providing technical assistance, advocating for fortification policies, and facilitating national fortification programs. These efforts are driven by the recognition that micronutrient malnutrition, or "hidden hunger," affects billions and leads to severe health, cognitive, and economic consequences. Fortification is seen as a cost-effective and scalable solution that delivers a high return on investment by preventing nutrition-related diseases and improving public health outcomes.
Rising adoption of fortified products among infants and children
The rising adoption of fortified products among infants and children is a significant market driver for the vitamin fortified and mineral enriched food and beverage sector. Increasing awareness among parents regarding the critical importance of early childhood nutrition for growth, development, and long-term health is fueling demand for fortified infant and toddler foods. This trend is supported by innovations in the baby food market, including the introduction of organic, allergen-free, and nutrient-enhanced formulations such as DHA-enriched and iron-fortified products. Additionally, the growing number of working parents, especially mothers, who seek convenient, nutrient-rich options is further accelerating market growth. Enhanced regulations and pediatric guidelines globally also promote the development and adoption of clinically formulated infant nutrition products tailored for specific health needs. As a result, the global baby food market—which includes fortified and mineral-enriched products—is projected to grow substantially, with increasing investments in advanced ingredients and traceability systems to address consumer safety and nutritional efficacy.
Restraints Impact Analysis of Vitamin Fortified And Mineral Enriched Food And Beverage Market*
| Restraint | (~) % Impact on CAGR Forecast | Geographic Relevance | Impact Timeline |
|---|---|---|---|
| Consumer skepticism and misconceptions about the safety and efficacy of fortified foods | -0.8% | Developed markets with high health literacy | Medium term (2-4 years) |
| High cost of fortification technologies and ingredient sourcing affecting product pricing | -1.2% | Global, particularly emerging markets | Short term (≤ 2 years) |
| Supply chain challenges and fluctuating raw material prices impacting product availability and cost | -0.9% | Global, concentrated in vitamin manufacturing hubs | Short term (≤ 2 years) |
| Risk of overconsumption or nutrient imbalances due to excessive fortification | -0.4% | Developed markets with multiple fortified product exposure | Long term (≥ 4 years) |
| Source: Mordor Intelligence | |||
Consumer skepticism and misconceptions about the safety and efficacy of fortified foods
Consumer skepticism and misconceptions about the safety and efficacy of fortified foods serve as a notable market restraint for the vitamin fortified and mineral enriched food and beverage sector. Despite strong evidence and strict regulations ensuring that fortified foods are safe and nutritionally beneficial, many consumers mistakenly believe these foods are genetically modified, unsafe, or cause adverse side effects. There is also a misconception that fortified foods are only for the wealthy, which undermines their acceptance among lower-income groups who benefit most from them. These misconceptions are compounded by concerns around overconsumption of certain nutrients, potential interactions with medications, and fears that fortified foods may discourage dietary diversity. Such skepticism can hinder widespread adoption, limiting market growth despite the proven public health benefits of fortification. Effective consumer education and transparent regulatory practices are essential to overcome these barriers and increase trust in fortified products.
High cost of fortification technologies and ingredient sourcing affecting product pricing
The high cost of fortification technologies and ingredient sourcing significantly affects product pricing and acts as a notable restraint on the vitamin fortified and mineral enriched food and beverage market. The initial investment for equipment to implement fortification processes, along with the recurring expenses related to purchasing micronutrient premixes, quality assurance testing, and storage, contribute to these elevated costs. Although fortification is recognized as a cost-effective public health intervention, the upfront costs and ongoing operational expenses can increase production costs, often translating into higher prices for fortified products compared to non-fortified alternatives. This pricing challenge can limit the reach of fortified products, particularly in price-sensitive markets and lower-income consumer segments. Despite these challenges, fortification costs typically remain a small fraction of total production expenses and are outweighed by the long-term health and economic benefits of reducing micronutrient deficiencies. However, managing these costs effectively remains crucial for promoting broader adoption and market growth.
*Our forecasts treat driver/restraint impacts as directional, not additive. The impact forecasts reflect baseline growth, mix effects, and variable interactions.
Vitamin Fortified And Mineral Enriched Food And Beverage Market Segment Analysis
By Product Type:
Beverages Lead While Infant Formulas Accelerate Premium GrowthBeverages currently command the largest market share in the Vitamin Fortified and Mineral Enriched Food and Beverage Market, accounting for approximately 35.98% of the market in 2025. This dominance is largely driven by innovations in functional waters and a growing portfolio of ready-to-drink fortified beverages which cater to the increasing demand for on-the-go consumption and convenience. Health-conscious consumers are increasingly seeking products that not only hydrate but also provide added nutritional benefits, which has spurred product development and adoption in this segment. The ease of consumption, combined with enhanced flavors and multi-functional health attributes, further supports the strong foothold of beverages within the market. Additionally, extensive availability across various retail channels including supermarkets, convenience stores, and online platforms ensures widespread consumer access.
Conversely, the infant formula segment is emerging as the fastest-growing category with a CAGR of 6.95% projected from 2026 to 2031. This rapid growth is attributed to the premium positioning strategies adopted by manufacturers, emphasizing superior nutritional profiles designed specifically for infant health and development. Regulatory changes have created a high barrier to entry, which benefits established players by reducing competition and enabling higher margins. Additionally, increasing awareness among parents regarding the importance of fortified nutrition in early life stages fuels demand. Manufacturers are also focused on innovations such as organic and hypoallergenic formulas to cater to diverse consumer needs. The segment’s growth is further supported by expanding distribution networks and rising birth rates in emerging markets, ensuring wider accessibility of fortified infant nutrition products globally.




By Nature:
Conventional Dominates While Organic Segment Captures Premium GrowthConventional products hold a substantial market share of 79.05% in 2025, primarily due to their cost-effectiveness and well-established supply chains. These factors enable conventional fortified foods and beverages to reach a wide range of price-sensitive consumer groups efficiently. Additionally, many government procurement programs prefer conventional products because of their affordability and reliable availability, further boosting their market dominance. The extensive infrastructure supporting these products facilitates mass-market penetration, ensuring that fortified products are accessible across various geographic and demographic segments. Furthermore, consumer familiarity and trust in conventional formulations drive sustained demand. Overall, the combination of economic viability and widespread distribution channels positions conventional products as the cornerstone of the vitamin fortified and mineral enriched food & beverage market.
In contrast, organic alternatives are emerging as the fastest-growing segment, with a predicted CAGR of 7.25% from 2026 to 2031, fueled by increasing consumer demand for clean-label products. Shoppers are progressively prioritizing natural ingredient sourcing, minimal processing, and transparency, which align well with organic fortified food and beverage offerings. The organic segment’s growth reflects heightened health awareness and environmental concerns influencing purchasing behaviors. Though organic products typically come at a premium, their appeal to niche markets that value sustainability and wellness supports expansion. Additionally, manufacturers are innovating to enhance organic product portfolios, further stimulating adoption. As consumer preferences evolve, the organic segment is expected to gain greater market share and reshape industry dynamics.
By Packaging Type:
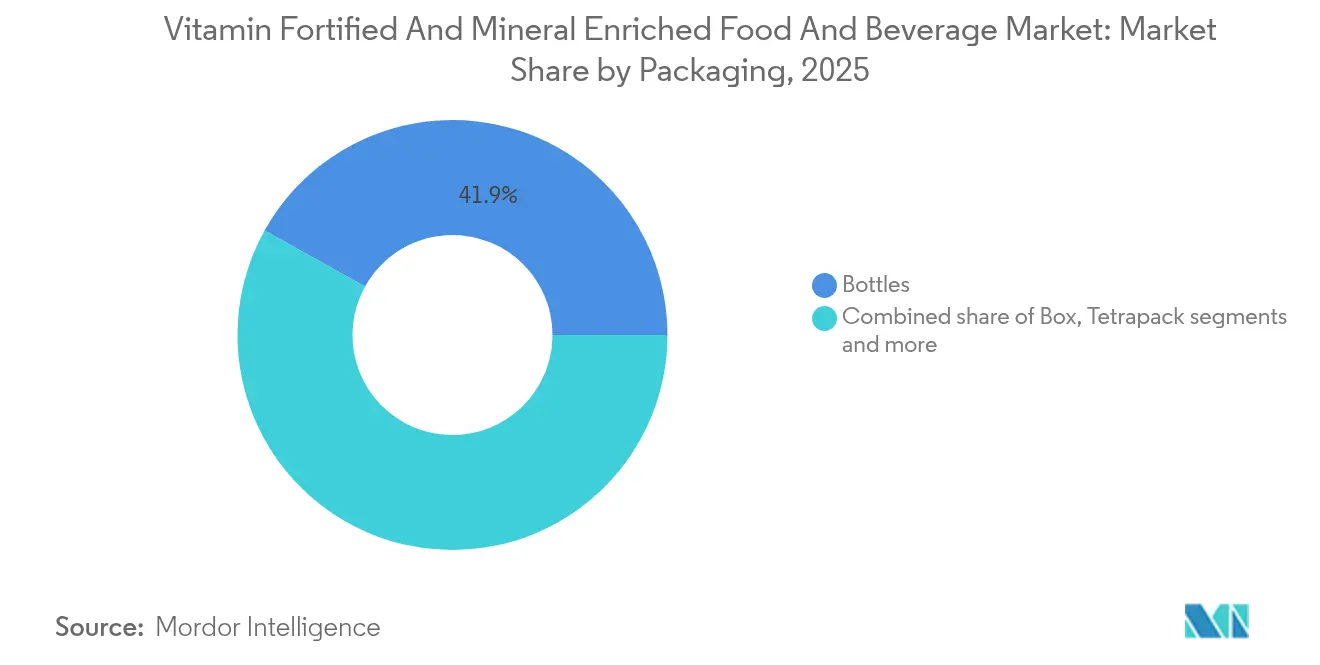
Bottles Lead While Tetrapack Drives Sustainability InnovationBottled packaging holds the largest share in the Vitamin Fortified and Mineral Enriched Food and Beverage Market, capturing 41.92% of the market in 2025. This dominance stems from consumer familiarity with bottles, combined with their resealability, which enhances convenience and product freshness. Bottles are highly versatile, accommodating both liquid and powder formulations across a wide array of product categories, including infant formulas and sports nutrition drinks. Their ease of use and portability align well with modern consumer lifestyles, making them a preferred choice across many markets. Moreover, the established supply chains and broad retail availability further solidify bottles as the go-to packaging format. The combination of functional benefits and consumer trust ensures bottle packaging maintains its leading position in the market.
Tetrapack packaging is poised as the fastest-growing segment with a forecasted CAGR of 7.58% from 2026 to 2031. Its growth is largely motivated by rising sustainability concerns and its eco-friendly manufacturing process, appealing to environmentally conscious consumers. Tetrapack offers aseptic packaging advantages, which extend product shelf life without the need for refrigeration, a significant benefit for fortified food and beverage stability. This format preserves nutrient integrity, maintaining the health benefits of fortified products over longer periods. The light weight and compact nature of Tetrapack packaging also reduce transportation costs and carbon footprint, further strengthening its market appeal. As manufacturers and consumers continue to prioritize sustainability, Tetrapack's market share is expected to rise steadily, reshaping packaging trends in the fortified food and beverage industry.
By Distribution Channel:
Traditional Retail Dominates While E-commerce AcceleratesSupermarkets and hypermarkets hold the largest market share in the Vitamin Fortified and Mineral Enriched Food and Beverage Market, accounting for 44.80% of the market in 2025. Their strong position is supported by strategic shelf space allocation that promotes visibility and consumer accessibility to fortified products. These retail formats benefit from their broad product assortments, enabling consumers to make one-stop purchases for household staples, including fortified foods and beverages. The ability to run promotional campaigns and discounts further enhances consumer attraction and loyalty. Additionally, consumer shopping habits favor the convenience and trust associated with established supermarkets and hypermarkets. The extensive physical presence of these outlets across urban and suburban areas solidifies their dominant role in distribution channels.
On the other hand, online retail stores are the fastest growing distribution channel in the market, expected to grow at a CAGR of 7.66% during 2026-2031. The rise in e-commerce penetration has made fortified products more accessible to a broader customer base, especially among younger, tech-savvy consumers. During the pandemic and beyond, online shopping for health and wellness products surged as consumers sought convenience and safety. Enhanced digital marketing, wider product ranges, and home delivery options position online retail as a convenient alternative to traditional retail, catering to evolving consumer lifestyles. Moreover, online platforms provide an efficient channel for niche and premium fortified formulations that target specific health concerns. This trend towards digitalization in retail is expected to continue reshaping the market landscape, boosting the share of online sales channels significantly.
Geography Analysis
North America Vitamin Fortified and Mineral Enriched Food and Beverage Market
In 2025, North America holds a 31.05% market share, buoyed by regulatory frameworks favoring fortified products and a consumer base increasingly conscious of health. The FDA's 2024 update on "healthy" claims emphasizes nutrient-dense fortified products, giving an edge to manufacturers who prioritize formulation and regulatory adherence. With a robust distribution network, high disposable incomes, and an aging population, the region sees heightened demand for functional foods targeting health concerns like bone health, cognitive function, and immune support. Canada's mandatory fortification of flour and margarine ensures steady demand, while Mexico's burgeoning middle class and urbanization fuel the market for fortified beverages and convenience foods.
APAC Vitamin Fortified and Mineral Enriched Food and Beverage Market
Asia-Pacific is set to be the fastest-growing region, boasting a 7.28% CAGR from 2026 to 2031. This growth is spurred by government-led fortification initiatives and a health-conscious middle class, navigating diverse regulatory landscapes and consumer preferences. India's fortified rice program, benefiting 291 million through the Public Distribution System, underscores the impact of government initiatives on sustained demand. In China, an aging populace and rising healthcare expenditures boost the appetite for premium fortified products. Meanwhile, economic growth and urbanization in Southeast Asian nations like Indonesia, Vietnam, and Thailand are propelling the adoption of packaged foods. Abbott's inauguration of a nutrition facility in India signals a strategic move by multinationals, eyeing the confluence of demographic trends, evolving regulations, and infrastructure advancements in emerging markets.
EMEA and South America Vitamin Fortified and Mineral Enriched Food and Beverage Market
Europe's growth is anchored in its regulatory frameworks and a consumer shift towards organic and clean-label products, resonating with global sustainability and environmental movements. The continent's rigorous food safety standards not only act as entry barriers but also bolster premium positioning for compliant brands, especially in organic fortified and specialized nutrition sectors. Meanwhile, South America, along with the Middle East and Africa, emerges as a fertile ground. Here, economic strides and urbanization are catalyzing a shift towards packaged foods, complemented by government-led fortification mandates and public health initiatives addressing micronutrient deficiencies.

Regulatory Landscape
Regulation of vitamin-fortified and mineral-enriched foods and beverages is shaped by both voluntary fortification policies, which are often used for brand differentiation, and mandatory large-scale food fortification programs, which target public-health staples. In the United States, FDA fortification policy under 21 CFR 104.20 sets guardrails to prevent indiscriminate nutrient addition, affecting how manufacturers position fortified beverages and foods and how claims and labeling are substantiated. In the European Union, Regulation (EC) No 1925/2006 governs the addition of vitamins and minerals to foods, with a consolidated version in effect as of November 2025, reinforcing positive lists, conditions of use, and compliance documentation across categories that include beverages, dairy, cereals, and infant/toddler foods.
Regional and national alignment efforts are also tightening implementation and enforcement mechanisms. In August 2024, ASEAN issued updated Guidelines and Minimum Standards for mandatory large-scale food fortification, indicating movement toward harmonized approaches across member states. At the country level, consolidated, multi-commodity frameworks are expanding. Tanzania enacted Mandatory Food Fortification Regulations in April 2025 and brought updated requirements into force in June 2026, including a fortified food logo and registered premix suppliers, increasing traceability, procurement, and packaging compliance demands for producers and importers.
Value Chain Analysis
The value chain begins upstream with high-purity vitamin manufacturers and mineral salt producers, followed by specialized premix formulators that combine micronutrients with carriers (such as maltodextrin) and use processes such as dry blending, agglomeration (spray drying), and microencapsulation (lipids or gums) to improve stability and dosing uniformity. Midstream, food and beverage manufacturers integrate premixes into end products (cereals, dairy, beverages, and infant formulas), supported by quality systems that generate certificates of analysis and stability dossiers used for labeling and regulatory audits. Downstream, products move through large retail (supermarkets/hypermarkets), pharmacies/drug stores, and online channels, with brand owners also using direct-to-consumer models for targeted functional positioning.
Regulation and standards bodies influence multiple nodes of the chain, particularly premix specifications, allowable forms, and labeling. Codex Alimentarius guidelines are commonly referenced in national frameworks, with a clear distinction between mandatory fortification for staples and voluntary fortification for commercial products. Bottlenecks concentrate around specialized microencapsulation capacity, nutrient sensitivity handling (including storage and, where applicable, cold-chain considerations), and the administrative complexity of compliance documentation. OECD work on governance for large-scale food fortification also highlights system needs such as authorization processes, enforcement capacity, and data collection, which can affect supplier qualification, audit readiness, and fortified portfolio timelines.
Competitive Landscape
The vitamin and mineral fortified food and beverage market exhibits moderate fragmentation, with established multinationals such as The Coca-Cola Company, Nestlé S.A., Kellanova, and PepsiCo leveraging their scale and regulatory expertise to maintain a stronghold in the industry. These companies benefit from their ability to navigate complex regulatory frameworks across multiple regions, ensuring compliance while maintaining operational efficiency. Emerging brands, on the other hand, focus on capturing niche segments by introducing innovative products tailored to specific consumer needs. Direct-to-consumer strategies, such as e-commerce platforms and subscription models, allow these smaller players to build strong customer relationships and compete effectively despite their limited resources. The market exhibits moderate concentration, reflecting a balanced mix of competition and opportunities for growth. The concentration score reflects the competitive dynamics of the market, where both established players and new entrants actively shape the industry.
Market leaders, such as Abbott, Nestlé, Kellogg, and PepsiCo, bolster their competitive edge with diversified portfolios that cater to a wide range of consumer preferences, from functional beverages to fortified snacks. Their global distribution networks enable them to penetrate both developed and emerging markets, ensuring widespread availability of their products. Additionally, significant investments in research and development allow these companies to stay ahead of regulatory changes and adapt to shifting consumer trends, such as the growing demand for plant-based and clean-label products. Strategic partnerships further enhance their market presence. For instance, Nestlé's alliance with Jamba focuses on creating functional beverages that appeal to health-conscious consumers, while Applied Nutrition's collaboration with TANG introduces plant-based protein products, expanding their reach into adjacent categories and meeting the rising demand for sustainable nutrition solutions.
Companies are harnessing technology to stand out in this competitive market. Innovations in bioavailability, such as microencapsulation and nanoformulation, improve nutrient absorption and effectiveness, addressing consumer concerns about product efficacy. Sustainable packaging solutions, including biodegradable and recyclable materials, not only align with environmental goals but also appeal to eco-conscious consumers. Personalized nutrition platforms, supported by advanced data analytics and artificial intelligence, enable companies to offer tailored solutions that meet individual dietary needs. These platforms also enhance direct-to-consumer engagement, fostering brand loyalty and driving subscription-based revenue models. Investments in aseptic packaging further improve product stability and extend shelf life, ensuring consistent quality while reducing waste.
Vitamin Fortified And Mineral Enriched Food And Beverage Industry Leaders
-
Nestlé SA
-
PepsiCo, Inc.
-
The Coca-Cola Company
-
Amway Corporation
-
Kellanova
- *Disclaimer: Major Players sorted in no particular order
Vitamin Fortified And Mineral Enriched Food And Beverage Market Companies Covered in this Report
- Abbott Laboratories
- Kellanova
- Nestlé SA
- PepsiCo, Inc.
- The Coca-Cola Company
- The Hain Celestial Group
- Amway Corporation
- General Mills Inc.
- Danone SA
- Kraft Heinz Company
- Monster Beverage Corporation
- HiPP GmbH
- Perrigo Company
- Reckitt Benckiser Group
- Glanbia Plc
- Procter & Gamble Company
- Land O’Lakes
- Mengniu Dairy Limited
- Pfizer Inc.
- GlaxoSmithKline
Read Analysis of Vitamin Fortified And Mineral Enriched Food And Beverage Companies

Market Opportunities and Future Outlook
One opportunity is higher-specification premixes and processing capabilities that improve nutrient stability and homogeneity across demanding matrices, including ready-to-drink beverages, plant-based alternatives, and infant/toddler applications. This is supported by capacity and capability investments in the fortification ecosystem, including dsm-firmenich completing a USD 10 million modernization of its Schenectady, United States, premix facility in March 2026, focused on GMP zoning and material conditioning for food, beverage, and infant nutrition use cases. Those upgrades expand the range of formulations that require tighter process control, faster changeovers, and stronger audit readiness.
Another opportunity is regional production and QA expansion close to growth markets where mandatory and voluntary fortification coexist, while brands build differentiated functional propositions. Bayer upgraded its consumer health production site in Cimanggis, Depok, Indonesia, in February 2026, increasing multiple micronutrient supplement output by 20% and enhancing R&D capability, and Amway commissioned a new solid dose tablet manufacturing line and quality control lab at the Nutrilite Spaulding Plant in Ada, Michigan, in May 2026 following a USD 75 million investment. With regulatory alignment initiatives such as ASEAN guidelines issued in August 2024, and tighter national compliance tools like packaging logos and registered premix suppliers (for example, Tanzania requirements effective June 2026), companies have room to build compliant, traceable fortification programs that serve both mass-market staples and premium functional offerings across beverages, dairy, and early-life nutrition.
Recent Industry Developments in Vitamin Fortified And Mineral Enriched Food And Beverage Market
- March 2026: Nestle launched Nestle Pure Life Soda Plus in Thailand, positioning it as a premium sparkling water with added Vitamin C and B vitamins (B1, B3, B6). The launch extends a mainstream water brand into fortified functionality, reinforcing the role of established beverage platforms in accelerating adoption of micronutrient-enhanced variants in emerging urban markets.
- May 2025: Nestle launched the Gerber HMO (Human Milk Oligosaccharide) formula rice cereal series in China following a National Health Commission of China update allowing HMO use in infant cereals. The move broadens fortified infant cereal innovation beyond standard vitamin and mineral enrichment, raising formulation and compliance requirements while strengthening premiumization in early-life nutrition.
- July 2024: Nestle launched a functional Gerber infant cereal series in China targeting specific nutritional needs for infants aged 6 to 12 months. This added-function positioning in a regulated category highlights how manufacturers use clinically oriented fortification cues to differentiate portfolios and support higher-value infant nutrition propositions.


Vitamin Fortified And Mineral Enriched Food And Beverage Market Report Scope and Research Methodology
Market Definition and Coverage
This market counts packaged food and beverage products that have added vitamins and or minerals as part of their labeled formulation and are sold through commercial retail and similar channels, across major consuming regions.
Scope exclusions: It excludes dietary supplement pills and capsules, as well as bulk premix ingredient sales that are not sold as finished food or drink products.
Segments Covered in This Report
-
By Product Type
- Cereal based products
- Dairy Products
- Beverages
- Infant Formulas
- Others
-
By Nature
- Conventional
- Organic/Natural
-
By Pacakgaing Type
- Box
- Bottle
- Tetrapack
- Others (Can, Pouch, Cup, and more)
-
By Distribution Channel
- Supermarkets / Hypermarkets
- Convenience Stores
- Pharmacy / Drug Stores
- Online Retail Stores
- Other Distribution Channels
-
By Geography
-
North America
- United States
- Canada
- Mexico
- Rest of North America
-
Europe
- Germany
- France
- United Kingdom
- Spain
- Italy
- Netherlands
- Russia
- Rest of Europe
-
Asia-Pacific
- China
- India
- Japan
- Australia
- South Korea
- Vietnam
- Indonesia
- Rest of Asia-Pacific
-
South America
- Brazil
- Argentina
- Rest of South America
-
Middle East and Africa
- Saudi Arabia
- United Arab Emirates
- South Africa
- Rest of Middle East and Africa
-
North America
Data Sources, Market Sizing, and Validation
Desk Research
Desk work started with defining what counts as fortified and enriched at the packaged product level, and then mapping where those products sit in normal food and beverage reporting. Public sources were used to anchor the demand context, such as USDA food availability data, FAO food balance sheets, WHO and national health agency nutrition guidance, and Codex Alimentarius fortification related standards.
To translate that context into a usable sizing structure, we also reviewed country trade and customs statistics, trade association publications for dairy, cereals, infant nutrition, and beverages, and peer reviewed nutrition and food science journals that discuss fortification prevalence and stability. Company filings, investor presentations, and reputable press were used to understand brand moves, pricing direction, and channel shifts. For company revenue normalization and cross checks, we used paid subscriptions that provide company financials and intelligence, along with a paid patent database to track fortification related claims and innovation signals. These sources are examples only, and the desk research set is not exhaustive because additional public references were also used for collection, validation, and clarification.
Primary Interviews and Surveys
Primary discussions were completed with a mix of packaged food and beverage manufacturers, ingredient and premix participants, distributors, and retail channel experts to confirm which products are routinely sold as fortified and how pricing is moving by format. Inputs were also gathered from nutrition focused specialists and regional commercial teams, which helped close gaps on fortification penetration, packaging preferences, and channel splits across major consuming regions before final assumptions were locked.
Distribution of primary research fieldwork respondents
| Company type | Respondent position | Region |
|---|---|---|
| Top tier: 37% | CXOs: 19% | APAC: 43% |
| Mid tier: 41% | Functional/Unit leaders: 40% | EMEA: 33% |
| Smaller Players: 22% | Managers: 41% | Americas: 24% |
Market-Sizing & Forecasting
Sizing is built using top-down and bottom-up steps, where packaged food and beverage consumption and category sales signals are reconstructed by region and then filtered to the share that is fortified and or enriched based on labeling prevalence and channel availability. Once that demand pool is formed, value is calculated using region wise average selling price bands that reflect packaging type, product category mix, and retail channel weighting.
To keep the totals realistic, selective bottom-up approximations are then used as a check, such as rolling up sampled supplier and brand revenues where disclosures are available, and using volume x price checks for high visibility categories like cereals, dairy, beverages, and infant formulas. When disclosure is thin in a country or channel, gaps are handled through proxy penetration rates from similar markets, followed by interview based adjustments.
The model is most sensitive to a few practical variables, including the share of packaged products carrying fortification claims, household spending on packaged foods and nonalcoholic beverages, infant formula consumption trends, supermarket and online retail share by region, and typical price premiums for fortified variants versus standard products. Forecasts are developed using scenario analysis, where these drivers are stepped forward with region specific assumptions validated through expert feedback, and then consolidated into a single base case forecast path.
Data Validation & Update Cycle
Outputs are triangulated against independent signals, including category level packaged food and beverage growth, trade flows for relevant finished products, and observed price movements in key retail channels. If a region shows an unusual jump in fortified share or an abrupt margin shift, the driver stack is rechecked and selected respondents are recontacted to confirm whether the change is real or a modeling artifact.
Before sign off, the full workbook goes through a multi step analyst review, which includes unit consistency checks, currency conversion timing checks, and variance checks at region and category levels. Reports are refreshed annually, and interim updates are made when material events affect pricing, regulation, or consumer demand. Before delivery, we run a final refresh pass so clients receive the most current view available.
Mordor Intelligence's Vitamin Fortified and Mineral Enriched Food Beverage Market Size Measured Against Other Published Estimates
It is normal to see different market size numbers for fortified and enriched foods and drinks because studies do not always count the same set of products, channels, and geographies. Differences also come from how each team converts local prices into USD, which year they treat as the starting point, and how often assumptions are revisited.
In this market, the biggest gaps usually come from scope edges, such as whether infant formula is fully counted, whether organic and conventional are both included, and whether packaging and channel splits are used to reduce double counting. A second driver is the growth path, where some publishers lean on a single long range CAGR without checking if fortification penetration can realistically rise at that pace in each region.
Benchmark comparison
| Source | Market Size | Gaps in Research Methodology |
|---|---|---|
| Mordor Intelligence | USD 108.32 B (2026) | |
| Industry Publisher A | USD 77.21 B (2025) | Uses an earlier anchor year and a shorter forecast window, and the fortified share assumptions by region appear to be applied more uniformly without clear channel and packaging level reconciliation. |
| Industry Publisher B | USD 93.00 B (2025) | Uses a different base year and a longer horizon, and the price and mix progression is presented at a high level, which can understate the impact of category mix and retail channel weighting. |
Observed packaged category growth, channel share patterns, and price premium checks are the evidence that ties Mordor Intelligence to a repeatable fortified demand pool by region, including how infant formula and fortified beverages are counted at the finished product level. Reading the table together, the spread is mainly explained by base year choice and how tightly the fortified share and pricing are linked to observable category and channel patterns.


Key Questions Answered in the Report
What is the projected size of the vitamin fortified and mineral enriched food & beverage market by 2031?
The sector is expected to reach USD 145.26 billion by 2031.
Which product type currently leads in value?
Fortified beverages hold the largest share at 35.98% of 2025 revenue.
Which region is forecast to grow fastest?
Asia-Pacific is poised for a 7.28% CAGR during 2026-2031 due to government fortification programs and rising incomes.
Why are infant formulas expanding rapidly?
Stringent nutrient standards and parental willingness to pay premiums drive a 6.95% CAGR for fortified infant formulas.
What channel shows the strongest growth outlook?
Online retail is expected to rise at an 7.66% CAGR as consumers embrace subscription and direct-to-consumer purchases.
Page last updated on:


 Your data is secure and never sold or shared.


