Market Overview
| Study Period | 2021 - 2031 |
|---|---|
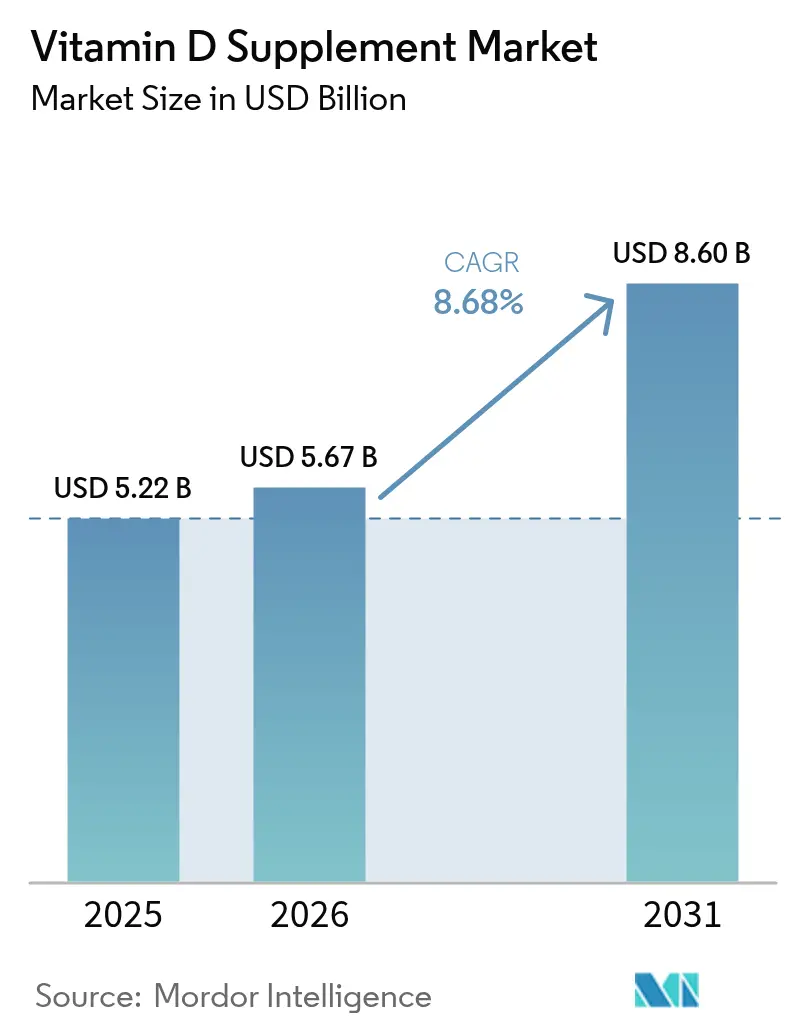
| Market Size (2026) | USD 5.67 Billion |
| Market Size (2031) | USD 8.6 Billion |
| Growth Rate (2026 - 2031) | 8.68% CAGR |
| Fastest Growing Market | Asia Pacific |
| Largest Market | North America |
| Market Concentration | Low |
Major Players
*Disclaimer: Major Players sorted in no particular order Image © Mordor Intelligence. Reuse requires attribution under CC BY 4.0. |
|
Vitamin D Supplement Market Analysis by Mordor Intelligence
The Vitamin D Supplements market size is expected to grow from USD 5.22 billion in 2025 to USD 5.67 billion in 2026 and is forecast to reach USD 8.6 billion by 2031 at 8.68% CAGR over 2026-2031. The market demonstrates robust growth due to increasing consumer awareness regarding vitamin D deficiency and its implications for overall health. The market expansion is primarily attributed to the growing scientific evidence supporting vitamin D's crucial role in immune system modulation, cognitive function enhancement, and skeletal health maintenance. The medical community's revised guidelines advocating higher vitamin D serum levels have significantly influenced market dynamics, particularly in regions with limited sunlight exposure. Additionally, the aging population, rising prevalence of osteoporosis, and increased focus on preventive healthcare contribute substantially to market growth.
Key Report Takeaways
- By product type, vitamin D3 commanded 85.65% of the vitamin D supplements market share in 2025 while maintaining an 8.81% CAGR outlook for 2026-2031.
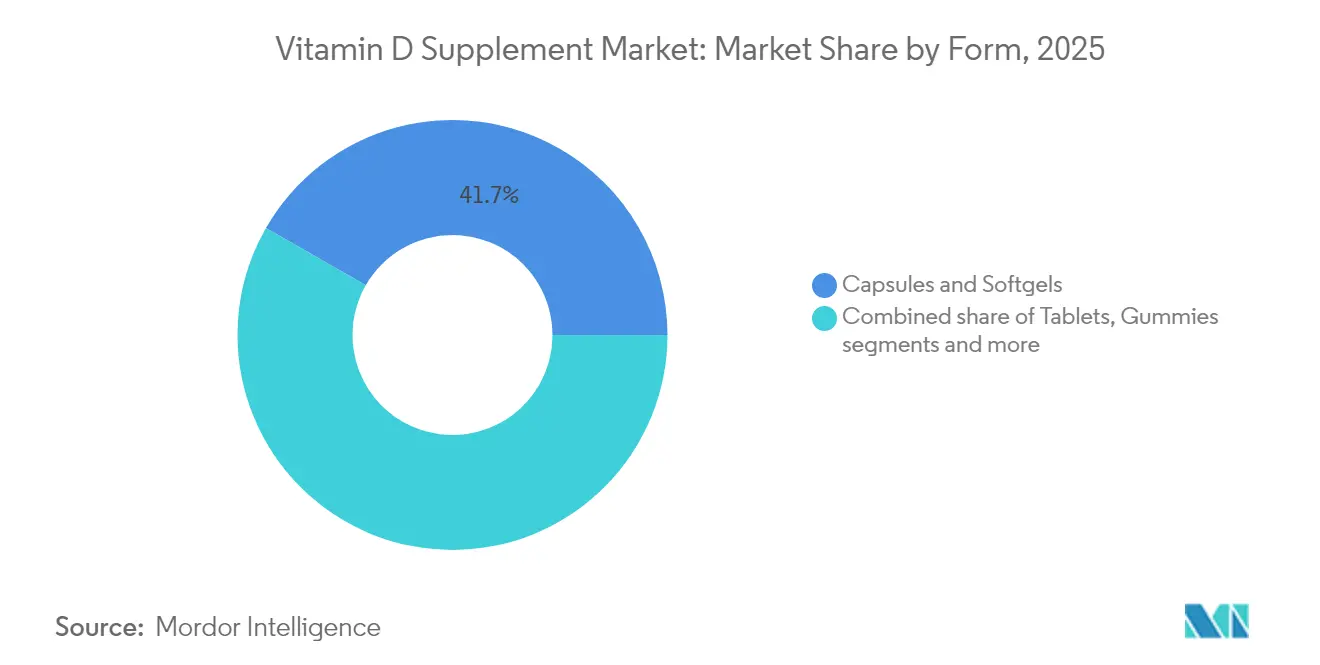
- By form, capsules and softgels held 41.72% of the vitamin D supplements market share in 2025. The gummies segment projects a CAGR of 11.92% during 2026-2031..
- By source, plant-based alternatives are expanding at a 14.6% CAGR, yet animal-derived products still represent 69.55% of the vitamin D supplements market size in 2025.
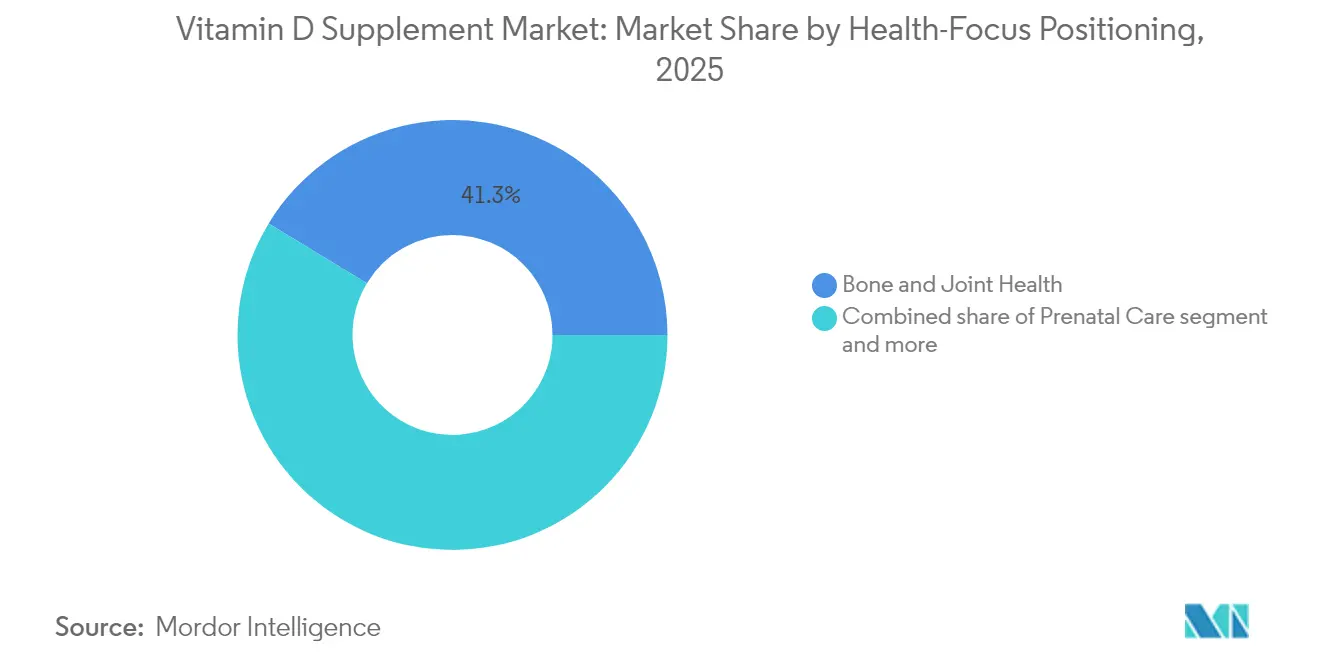
- By health-focus positioning, immune support products are growing at 11.95% CAGR, whereas bone and joint health leads with 41.33% revenue share in 2025.
- By distribution channel, specialty and health stores retained a 34.78% share in 2025, while online retail is scaling at 14.05% CAGR until 2031.
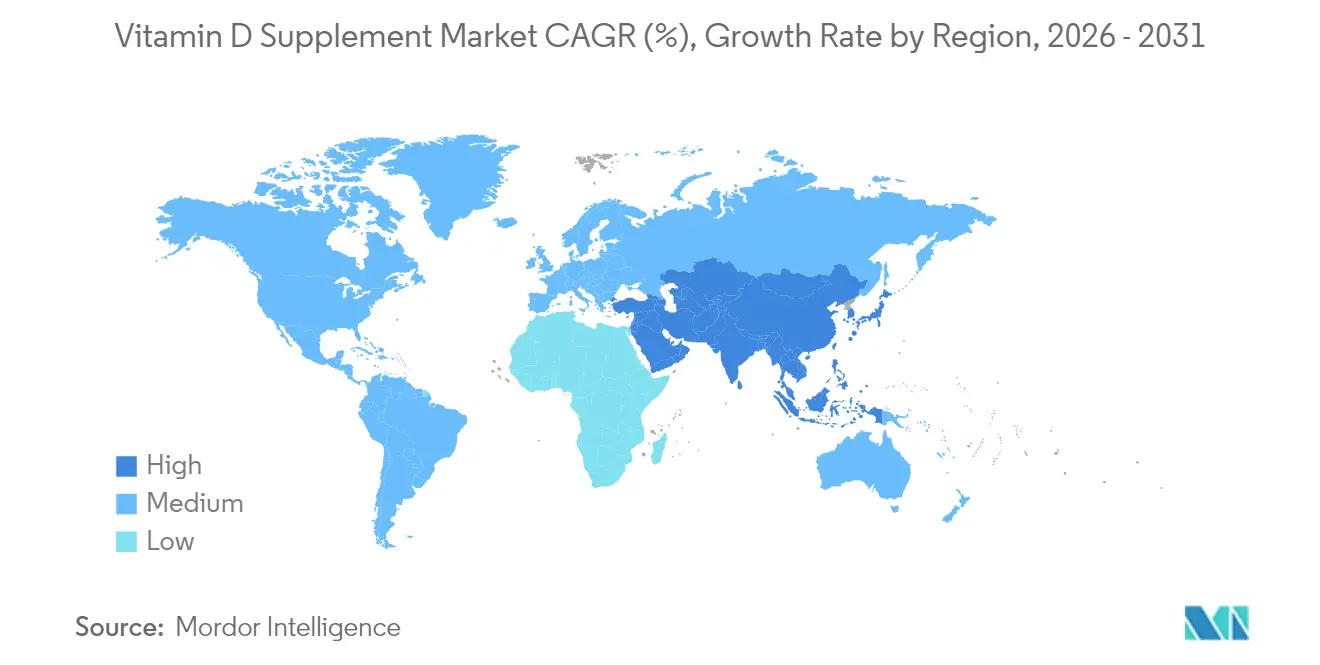
- By geography, North America captured 29.74% vitamin D supplement market share in 2025, and Asia-Pacific is set to rise at a 9.55% CAGR to 2031.
Note: Market size and forecast figures in this report are generated using Mordor Intelligence’s proprietary estimation framework, updated with the latest available data and insights as of 2026.
Global Vitamin D Supplement Market Trends and Insights
Drivers Impact Analysis*
| Driver | (~) % Impact on CAGR Forecast | Geographic Relevance | Impact Timeline |
|---|---|---|---|
| Rising vitamin D deficiency drives global market growth and expansion | +3.2% | Global, with highest impact in Middle East, Northern Europe, India, China | Long term (≥ 4 years) |
| Growing elderly population fuels increased demand for bone health supplements worldwide | +2.1% | North America, Europe, Japan, China | Long term (≥ 4 years) |
| Medical community support and recommendations strengthen vitamin D market development | +1.7% | Global, with early adoption in North America and Europe | Medium term (2-4 years) |
| Pandemic-driven health concerns boost global vitamin D consumption and sales | +1.0% | Global | Short term (≤ 2 years) |
| Public health programs and educational initiatives increase vitamin D awareness globally | +0.5% | Global, with concentration in developed markets | Medium term (2-4 years) |
| Growing consumer demand for plant-based supplements is supporting the market growth | +1.3% | Global, with stronger adoption in North America, Europe, Australia | Medium term (2-4 years) |
| Source: Mordor Intelligence | |||
Rising Vitamin D Deficiency Drives Global Market Growth and Expansion
The global vitamin D supplement market is experiencing significant growth, primarily driven by the widespread prevalence of vitamin D deficiency across populations and age groups. Vitamin D, which is essential for calcium absorption, immune function, and bone health, has gained increased attention as medical evidence links its deficiency to various health conditions, including osteoporosis, cardiovascular diseases, diabetes, autoimmune disorders, and compromised immunity. Modern urban lifestyles with limited sun exposure, particularly in densely populated areas and high-latitude regions, have resulted in millions of people failing to meet recommended daily vitamin D levels through natural synthesis or diet. Moreover, government agencies and international organizations have recognized vitamin D deficiency as a significant public health concern and implemented supportive measures. The National Health Service (NHS) in the United Kingdom advocates daily vitamin D supplementation, particularly during autumn and winter months. Similarly, Health Canada requires vitamin D fortification in milk and promotes supplementation, especially for older adults. These official endorsements validate the importance of vitamin D supplementation and enhance consumer confidence in supplements as a necessary health intervention.
Growing Elderly Population Fuels Increased Demand for Bone Health Supplements Worldwide
The global aging population trend is increasing the demand for vitamin D supplements, particularly those targeting bone and joint health. Research demonstrates that vitamin D supplementation in older adults supports both osteoporosis prevention and functional mobility maintenance while reducing disability risks. Companies are developing products that address bone health, mobility, and mental well-being for older consumers. The market features age-specific formulations designed to overcome absorption challenges and meet higher dosage requirements of elderly populations, establishing a premium market segment. This demographic shift is evidenced by World Bank data, which reports that the United States population aged 65 and over increased from 16.92% in 2022 to 17.43% in 2023, further accelerating the demand for specialized vitamin D supplements [1]Source: World Bank, "World Development Indicators", databank.worldbank.org.
Medical Community Support and Recommendations Strengthen Vitamin D Market Development
The medical community's evolving understanding of optimal vitamin D levels is transforming the supplement market. Research demonstrates vitamin D's importance beyond bone and calcium metabolism, prompting healthcare professionals to recommend supplementation to diverse patient groups. Medical practitioners now advise vitamin D supplements for infants, pregnant women, individuals with autoimmune disorders, metabolic syndromes, and those with limited sun exposure, in addition to traditional recommendations for the elderly and at-risk populations. This broader medical support has established vitamin D as an essential preventive health supplement. Healthcare provider recommendations have increased consumer confidence in vitamin D supplementation. Global medical organizations provide guidelines that support market growth. The Endocrine Society and the American Academy of Pediatrics (AAP) advocate vitamin D supplementation from infancy, with the AAP recommending 400 IU daily for breastfed infants to prevent rickets.[2]Source: Centers for Disease Control and Prevention (CDC), “Vitamin D and Breastfeeding”, cdc.gov .
Pandemic-Driven Health Concerns Boost Global Vitamin D Consumption and Sales
The COVID-19 pandemic increased consumer interest in immune support supplements, particularly vitamin D, following research indicating its importance in respiratory health and immune function. This increased awareness has led to lasting changes in consumer behavior, as supplementation became a regular practice rather than a temporary response to the pandemic. Consumers now view supplements as an integral part of their health maintenance routines, moving away from the previous pattern of occasional use. This shift is notable among younger consumers, who have begun incorporating vitamin D supplements into their daily routines. The pandemic also transformed purchasing patterns, with e-commerce becoming a primary distribution channel, allowing direct-to-consumer brands to expand their market presence through digital marketing and subscription services.
Restraints Impact Analysis*
| Restraint | (~) % Impact on CAGR Forecast | Geographic Relevance | Impact Timeline |
|---|---|---|---|
| Counterfeit products impact market growth of vitamin D supplements market | -0.8% | Global, with highest impact in developing regions | Medium term (2-4 years) |
| Competition from fortified functional foods diverts consumer spending from standalone supplements | -0.5% | North America, Europe, Australia, Japan | Medium term (2-4 years) |
| High cost of premium supplements reduces affordability in low-income markets | -0.7% | Developing regions, emerging markets, rural areas | Long term (≥ 4 years) |
| Supply chain disruptions affecting raw material availability and distribution of vitamin D products | -0.4% | Global | Short term (≤ 2 years) |
| Source: Mordor Intelligence | |||
Counterfeit Products Impact Market Growth of Vitamin D Supplements Market
The presence of counterfeit and substandard vitamin D supplements poses a significant market constraint by eroding consumer trust and risking negative health effects. According to the United States Pharmacopeia's 2024 policy position, the dietary supplements market expanded from 4,000 products in 1994 to approximately 80,000 products in 2024, creating substantial challenges for quality control and regulatory oversight. This market expansion has enabled some manufacturers to introduce products containing inconsistent or insufficient vitamin D levels, particularly in regions with weak regulatory enforcement. Quality issues are most evident in expanding online marketplaces, where product authenticity verification remains difficult. While the industry has implemented solutions such as blockchain traceability, authentication systems, and consumer awareness programs, these measures increase operational costs, particularly affecting smaller manufacturers. The counterfeit supplement problem is more severe in developing markets with emerging regulatory frameworks, which may restrict market growth in areas with high vitamin D deficiency rates and market expansion opportunities.
Competition From Fortified Functional Foods Diverts Consumer Spending from Standalone Supplements
The growth in vitamin D-fortified foods and beverages presents significant competition for traditional supplements by providing consumers with convenient ways to meet their nutritional needs through a regular diet. This trend is prominent in developed markets, where manufacturers incorporate vitamin D fortification to enhance product value. The 2020-2025 Dietary Guidelines for Americans recognize both fortified foods and supplements as valid sources for meeting nutritional requirements. Consumers increasingly favor obtaining nutrients through food sources, viewing fortified products as a more natural approach to nutrition compared to supplements. This preference is especially strong among health-conscious individuals who typically purchase premium supplements. In response, supplement manufacturers are focusing on distinctive advantages such as precise dosage control, specialized formulas, and enhanced absorption technologies that fortified foods cannot provide.
*Our forecasts treat driver/restraint impacts as directional, not additive. The impact forecasts reflect baseline growth, mix effects, and variable interactions.
Segment Analysis
By Form: Gummies Disrupt Traditional Delivery Methods
The form factor landscape is transforming, with gummies showing the highest growth rate at a CAGR of 11.92% from 2026-2031. However, capsules and softgels remain the market leaders, holding a 41.72% share in 2025. This evolution reflects consumer preferences for convenient and enjoyable supplement consumption methods that fit easily into daily routines. Gummies have gained particular popularity among Gen Z and Millennial consumers who seek alternatives to traditional supplements. Their appeal extends beyond taste, addressing pill fatigue and swallowing difficulties that impact supplement adherence across age groups.
Tablets retain substantial market presence due to their cost-effectiveness and stability benefits. Liquid formulations are increasing in popularity for their versatility and absorption advantages, especially in pediatric and geriatric applications. Powders have established a position in sports nutrition, frequently combined with protein and performance supplements. Innovation across form factors focuses on clean-label formulations, including reduced-sugar gummies, plant-based tablet excipients, and organic liquid formulations. This expansion of delivery formats is growing the market by attracting consumers who previously avoided supplements due to format limitations or compliance issues.


By Product Type: D3 Dominates While Expanding Applications
The vitamin D supplements market is dominated by Vitamin D3 (cholecalciferol), which accounts for 85.65% market share in 2025. The segment is expected to grow at a CAGR of 8.81% from 2026-2031. D3's market leadership is attributed to its higher bioavailability and effectiveness, as studies show it is more efficient in increasing and sustaining serum 25-hydroxyvitamin D levels compared to D2. Research indicates D3's benefits extend beyond bone health to immune function, cardiovascular health, and cognitive performance. While Vitamin D2 (ergocalciferol) remains available through prescriptions and plant-based products, its market share decreases as vegan D3 alternatives become more available.
The market shows advancement in delivery systems and formulation technologies to improve absorption and effectiveness. Companies are implementing microencapsulation techniques to enhance vitamin D3's stability and prevent degradation across various product forms. Oil-based formulations are becoming more prevalent due to their enhanced absorption characteristics. Production methods are also evolving, as demonstrated by Nutriearth's development of natural vitamin D3 oil that replicates the body's natural synthesis process without chemical extraction, which recently received marketing approval in Canada. These technological improvements are expanding D3's presence across product categories and consumer segments, supporting continued market growth despite its established market position.
By Source: Plant-Based Alternatives Reshape Market Dynamics
Animal-based vitamin D holds a 69.55% market share in 2025, while plant-based/vegan alternatives demonstrate a 14.6% CAGR from 2026-2031. This growth in plant-based options reflects consumer preferences for sustainable and ethical products, which are increasingly associated with wellness benefits. The plant-based vitamin D market is expanding beyond traditional vegan consumers to include flexitarians and health-conscious individuals. Companies like Hi-D are developing vitamin D products from UV-exposed mushrooms, providing whole-food alternatives with additional nutritional benefits.
Synthetic vitamin D maintains a market position by offering cost-effective supplementation options for price-sensitive consumers. The segment continues to improve through technological advancements that enhance product purity and reduce environmental impact. Animal-based vitamin D, while experiencing market share decline, benefits from established supply chains and consumer familiarity. Companies in this segment are implementing sustainable practices and transparent sourcing, particularly in lanolin extraction. The availability of multiple vitamin D sources enables companies to target specific consumer segments based on preferences, supporting focused brand positioning and customer retention.
By Health-Focus Positioning: Immune Support Accelerates Beyond Traditional Applications
Bone and joint health positioning maintains market dominance with a 41.33% share in 2025, while immune support emerges as the fastest-growing positioning segment, projected to grow at a 11.95% CAGR from 2026-2031. The immune support segment's growth reflects the shift in consumer perception of immune health from a seasonal concern to a year-round priority following the pandemic. Vitamin D's immune-modulating properties have gained increased recognition, particularly among younger consumers who prioritize immune resilience over bone health. The prenatal care segment, though specialized, continues to expand due to increased understanding of vitamin D's importance in maternal and infant health.
The others category includes positioning opportunities in mood support, cognitive function, and cardiovascular health, offering market differentiation potential. These segments typically feature higher price points and targeted marketing to specific health-conscious consumer groups. Companies are adopting multi-benefit positioning strategies that highlight vitamin D's multiple physiological functions, developing products that address several health outcomes. This comprehensive approach reflects consumers' understanding of interconnected health systems and positions vitamin D as a core component in overall supplementation strategies. This positioning evolution enables companies to enhance their value propositions and expand their consumer base while maintaining existing product formulations.
By Distribution Channel: Digital Transformation Reshapes Consumer Access
The vitamin D supplement distribution landscape is undergoing a structural change, with online retail achieving a 14.05% CAGR from 2026-2031. Specialty and health stores maintain market leadership with a 34.78% market share in 2025. The transition to digital channels reflects evolving consumer purchasing behavior, initially accelerated by the pandemic but maintained through operational efficiency, expanded product selection, and customized purchasing options. Online channels demonstrate strong performance for vitamin D supplements due to product uniformity, consistent purchase cycles, and recurring revenue opportunities. The distribution landscape is projected to stabilize by 2025, with natural and specialty stores, e-commerce, and mass market channels reaching equivalent market positions.
Supermarkets and hypermarkets maintain a strong market presence through integration with regular grocery shopping. These retailers are expanding their vitamin D product range to include premium formulations. Direct selling, practitioner channels, and fitness centers serve specific market segments through targeted offerings. Distribution channel diversification enables companies to implement omnichannel strategies while maintaining brand consistency. Online brands drive product innovation, while traditional retail brands emphasize in-store visibility and customer education.
Geography Analysis
North America holds 29.74% market share in 2025, supported by high consumer awareness, healthcare spending, and comprehensive regulatory standards. The region's market position stems from its adoption of innovative delivery formats and specialized formulations, particularly in direct-to-consumer channels. The United States market shows distinct segmentation across price points, with premium brands focusing on quality, bioavailability, and targeted benefits. Canada's vitamin D market is strengthened by regulatory policies ensuring product safety and efficacy, particularly during winter months with limited sunlight. The region's aging population drives demand for bone health supplements, while preventive health trends expand consumption across age groups.
Europe maintains a significant market share, with growth varying across countries based on deficiency rates, regulations, and consumer preferences. The European Union's regulatory framework guides market development while prioritizing consumer safety. The United Kingdom and Germany dominate in market value, while Nordic countries demonstrate high per capita consumption due to geographical factors and deficiency awareness. European markets show strong development in plant-based vitamin D products, reflecting consumer demand for sustainable options.
Asia-Pacific shows the highest growth rate at 9.55% CAGR from 2026-2031, driven by health awareness, increasing incomes, and recognition of vitamin D deficiency. China's market expansion is led by Caltrate through product launches and market activation. India presents growth opportunities owing to vitamin D deficiency, while Japan's market is characterized by an aging population and a focus on preventive health, supporting premium vitamin D products. Japan's elderly population segment (aged 65 years and older) constituted 29.6% of the total population in 2023, according to the World Bank . E-commerce development enhances access to international brands and specialized products. Regional manufacturers compete through locally adapted formulations, including combination supplements addressing common nutritional gaps in Asian diets.

Competitive Landscape
The vitamin D supplements market is fragmented. This structure creates a competitive environment where established pharmaceutical and consumer health companies operate alongside specialized nutrition firms and emerging wellness brands. The market dynamics allow scale advantages for industry leaders while providing innovation opportunities for agile competitors focusing on specific consumer segments or distribution channels. Major market players include Nestle S.A., Haleon plc, NOW Foods, Amway Corporation, and Herbalife Nutrition Ltd.
The competitive landscape continues to evolve through strategic partnerships. For example, Nutriearth's collaboration with AIDP Inc. for North American distribution of its natural vitamin D3 oil enables smaller innovators to access broader markets through established distribution networks. Companies differentiate themselves across the competitive spectrum, with premium brands focusing on quality credentials, specialized formulations, and enhanced bioavailability. Value-oriented players compete through cost efficiency and broad distribution. Market opportunities remain in personalized supplementation, condition-specific formulations, and innovative delivery systems that improve compliance and user experience.
Digital capabilities influence competitive dynamics, as direct-to-consumer brands use data analytics and targeted marketing to build consumer relationships outside traditional retail channels. Regulatory expertise has become a competitive advantage amid increasing global compliance requirements. The FDA's 2024 revised guidance for dietary supplements containing new dietary ingredients creates additional barriers to entry for smaller players. The market faces competition from adjacent categories, including functional foods and beverages fortified with vitamin D, requiring supplement manufacturers to demonstrate clear value propositions against these alternatives.
Vitamin D Supplement Industry Leaders
-
Nestle S.A.
-
Haleon plc
-
NOW Foods
-
Amway Corporation
-
Herbalife Nutrition Ltd.
- *Disclaimer: Major Players sorted in no particular order

Recent Industry Developments
- May 2025: Pharmavite LLC established its new manufacturing and research and development facility in New Albany, Ohio. The USD 250 million facility encompassed 225,000 square feet and represented the company's first presence in the region, creating 225 jobs with space available for future expansion.
- October 2024: Immunotec released Sunray, a weekly vitamin D supplement containing calcifediol (25-hydroxyvitamin D) to enhance health outcomes.
- October 2024: Caldic North America established a distribution partnership with Infusd Nutrition, a Canadian manufacturer, to supply vitamin D products and nutritional solutions throughout North America through Caldic's distribution network.
- February 2024: Bobbie diversified its product line beyond infant formula through the introduction of two organic infant supplements: Vitamin D and Probiotic Drops. This diversification marked the company's first venture into non-formula products, complementing its established infant formula offerings.


Research Methodology Framework and Report Scope
Market Definitions and Key Coverage
Our analysis defines the vitamin D supplements market as finished oral products, tablets, capsules, softgels, gummies, liquids, and powders, containing ergocalciferol (D2) or cholecalciferol (D3) that are sold over the counter or through practitioner channels for human dietary use.
Our scope excludes bulk vitamin D ingredients for animal feed, food fortification, or personal-care formulations, and all injectable therapies.
Segmentation Overview
-
By Product Type
- Vitamin D2
- Vitamin D3
-
By Form
- Tablets
- Capsules and Softgels
- Gummies
- Powders
- Liquid
- Others
-
By Source
- Synthetic
- Animal-Based
- Plant-Based/Vegan
-
By Health-Focus Positioning
- Bone and Joint Health
- Immune Support
- Prenatal Care
- Others
-
By Distribution Channel
- Supermarkets/Hypermarkets
- Specialty and Health Stores
- Online Retailers
- Other Distribution Channels
-
By Geography
-
North America
- United States
- Canada
- Mexico
- Rest of North America
-
Europe
- United Kingdom
- Germany
- France
- Italy
- Spain
- Netherlands
- Poland
- Belgium
- Sweden
- Rest of Europe
-
Asia-Pacific
- China
- Japan
- India
- South Korea
- Australia
- Indonesia
- Thailand
- Singapore
- Rest of Asia-Pacific
-
South America
- Brazil
- Argentina
- Colombia
- Chile
- Peru
- Rest of South America
-
Middle East and Africa
- Saudi Arabia
- South Africa
- United Arab Emirates
- Nigeria
- Egypt
- Morocco
- Turkey
- Rest of Middle East and Africa
-
North America
Detailed Research Methodology and Data Validation
Primary Research
We spoke with endocrinologists, community pharmacists, contract manufacturers, and e-commerce category managers across North America, Europe, India, and ASEAN. Their insights on average selling prices, pack sizes, and subscription reorder cycles tightened model assumptions and confirmed emerging demand triggers.
Desk Research
We began with tier-1 public sources such as the WHO Global Health Observatory, CDC NHANES intake tables, Eurostat nutrition surveys, India's NFHS, and the International Osteoporosis Foundation; these confirmed deficiency prevalence, dosing norms, and age-group demand. We then mapped trade flows and pricing using UN Comtrade, USDA GATS, and China Customs to benchmark import values for D3 solids and oils.
Our team enriched the picture with company 10-Ks, earnings calls, retail scanner panels, and patent filings, while selective paid platforms, including D&B Hoovers for brand revenues and Volza for shipment volumes, helped reconcile producer and channel splits. This list is illustrative only; many additional databases and journals were consulted for validation and clarification.
Market-Sizing & Forecasting
Our top-down model starts with national supplement expenditure, extracts the vitamin share, and then applies deficiency prevalence and dosage norms to build a demand pool that is further filtered through channel mix and average price points. Bottom-up checks, selected brand sales roll-ups and sampled ASP × unit volumes, validate and adjust totals. Key inputs include adult deficiency rates, online supplement penetration, average retail price per 1,000 IU dose, gummy format share, regulatory upper-limit shifts, and physician recommendation rates. Forecasts employ multivariate regression, linking these drivers to income growth and population aging, and are stress-tested with scenario analysis around fortification mandates. Any missing private-label volumes are bridged using moving-average imputation anchored to verified retailer growth.
Data Validation & Update Cycle
Our analysts compare outputs with shipment tonnage, retail audit trends, and financial filings, flagging variances above five percent for re-review. Models undergo peer audit before sign-off and refresh annually, with interim updates when material regulatory or recall events occur.
Why Our Vitamin D Supplements Baseline Commands Reliability
We observe that published estimates often diverge, driven by differing product mixes, price references, and refresh cadences.
Our review finds the main gap drivers are: some studies include feed or functional-food ingredients, others value output at factory transfer prices rather than consumer ASPs, and several extend pre-pandemic trends without adjusting for post-2022 e-commerce normalization.
Benchmark comparison
| Market Size | Anonymized source | Primary gap driver |
|---|---|---|
| USD 5.22 bn (2025) | Mordor Intelligence | |
| USD 2.14 bn (2025) | Regional Consultancy A | Counts only raw D2 & D3 bulk plus limited geographies |
| USD 0.89 bn (2025) | Global Consultancy B | Values ingredient output at ex-factory prices, excludes OTC finished goods |
| USD 1.34 bn (2022) | Trade Journal C | Uses older base year and projects with fixed CAGR without channel checks |
Hence, clients trust Mordor's balanced baseline because every assumption is traceable to transparent variables, vetted with field insight, and recalibrated each year to mirror real consumer spend.


Key Questions Answered in the Report
What is the current value of the vitamin D supplements market?
The market is valued at USD 5.67 billion in 2026 and is forecast to reach USD 8.6 billion by 2031.
Which segment holds the largest vitamin D supplements market share?
Vitamin D3 dominates with 85.65% share in 2025 because of superior bioavailability.
Why are gummies growing so quickly within the category?
Gummies alleviate pill fatigue, appeal to younger users, and post a 11.92% CAGR through 2031.
Which region is expanding the fastest?
Asia-Pacific is projected to grow at 9.55% CAGR, driven by rising deficiency awareness and e-commerce access.
Page last updated on:


