Virtualization Software Market Size and Share
Market Overview
| Study Period | 2020 - 2031 |
|---|---|
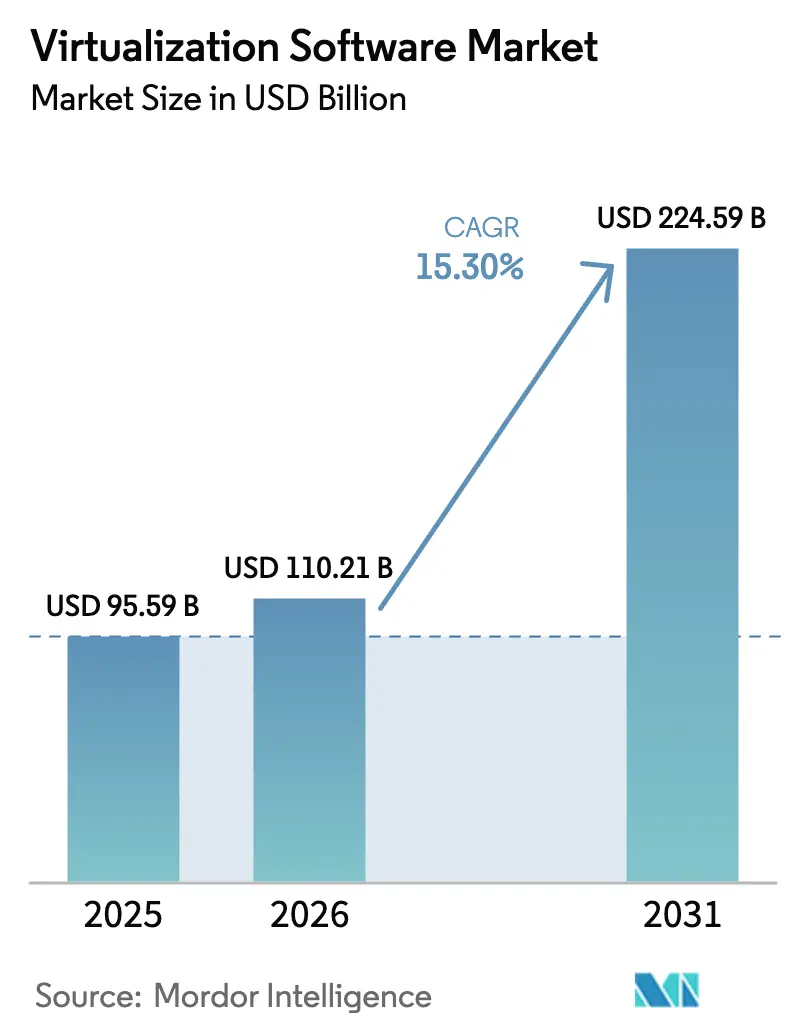
| Market Size (2026) | USD 110.21 Billion |
| Market Size (2031) | USD 224.59 Billion |
| Growth Rate (2026 - 2031) | 15.30% CAGR |
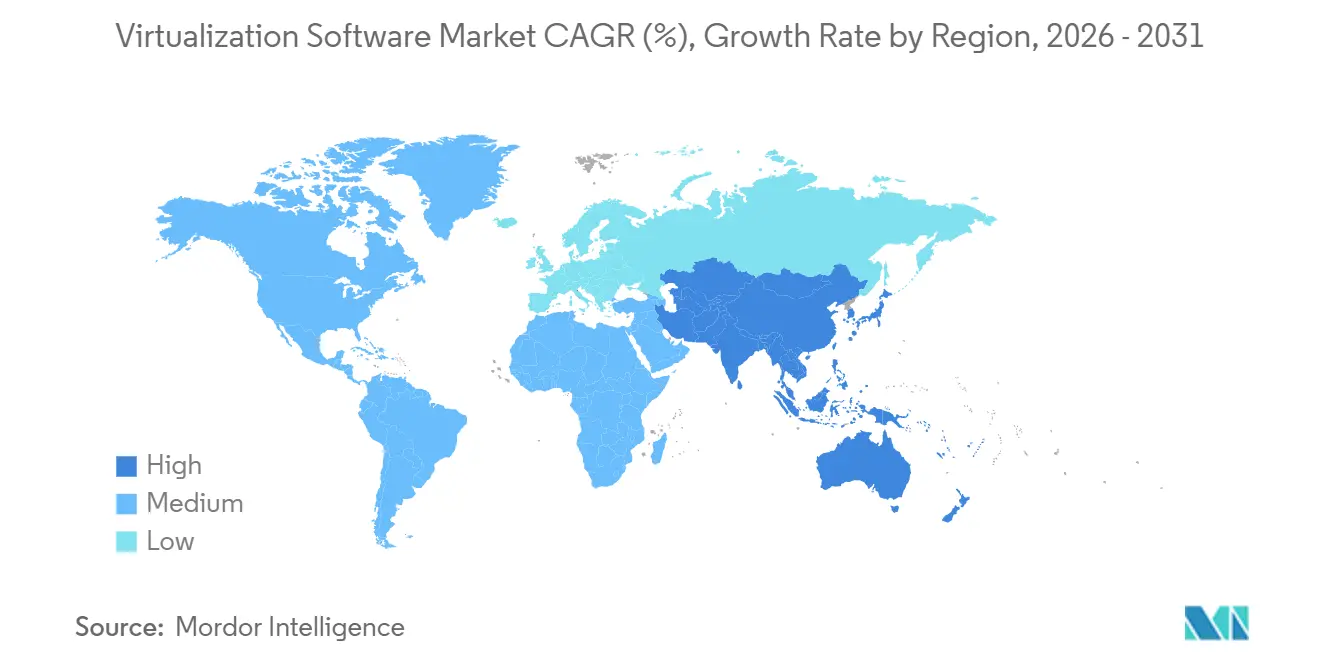
| Fastest Growing Market | Asia Pacific |
| Largest Market | North America |
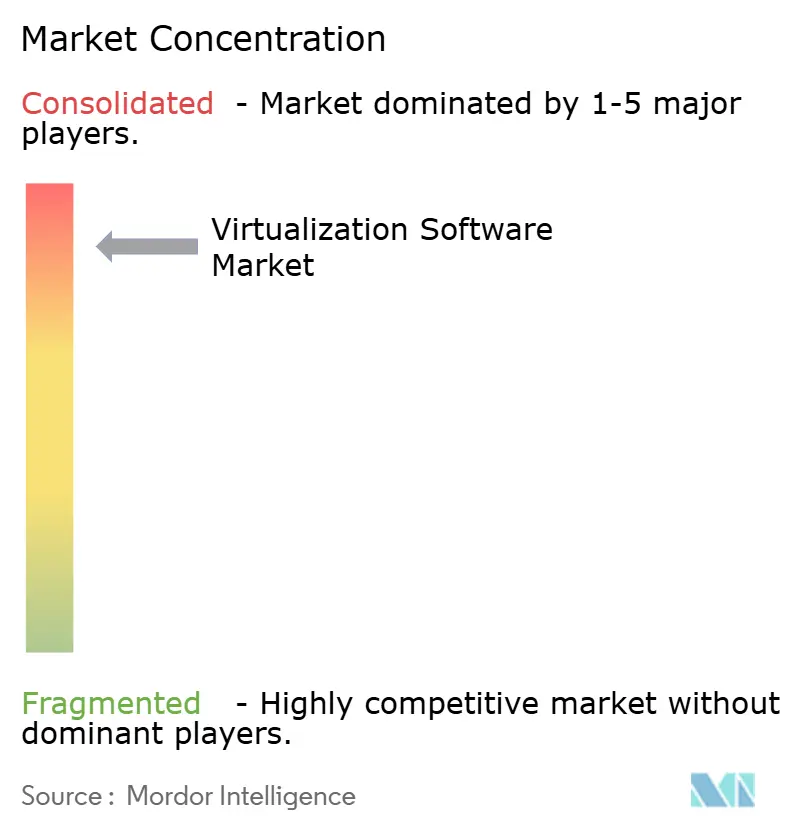
| Market Concentration | High |
Major Players *Disclaimer: Major Players sorted in no particular order Image © Mordor Intelligence. Reuse requires attribution under CC BY 4.0. | |
Virtualization Software Market Analysis by Mordor Intelligence
The Virtualization Software Market size is projected to expand from USD 95.59 billion in 2025 and USD 110.21 billion in 2026 to USD 224.59 billion by 2031, registering a CAGR of 15.30% between 2026 to 2031. Enterprises are revisiting hypervisor budgets after Broadcom converted VMware’s flagship products to subscription-only licensing, which accelerated evaluations of Nutanix AHV, Microsoft Hyper-V, KVM, and other alternatives. North American incumbents still anchor spending, but sovereign-cloud policies in China and India, coupled with 5G core virtualisation across Asia Pacific, signal faster regional upside. Server consolidation remains a cost lever, while confidential-computing features baked into new silicon from Intel and AMD strengthen compliance postures in healthcare and finance. Competitive momentum is also shifting as hyperscalers embed lightweight hypervisors into infrastructure-as-a-service offerings, blurring the line between private cloud and public cloud procurement.
Key Report Takeaways
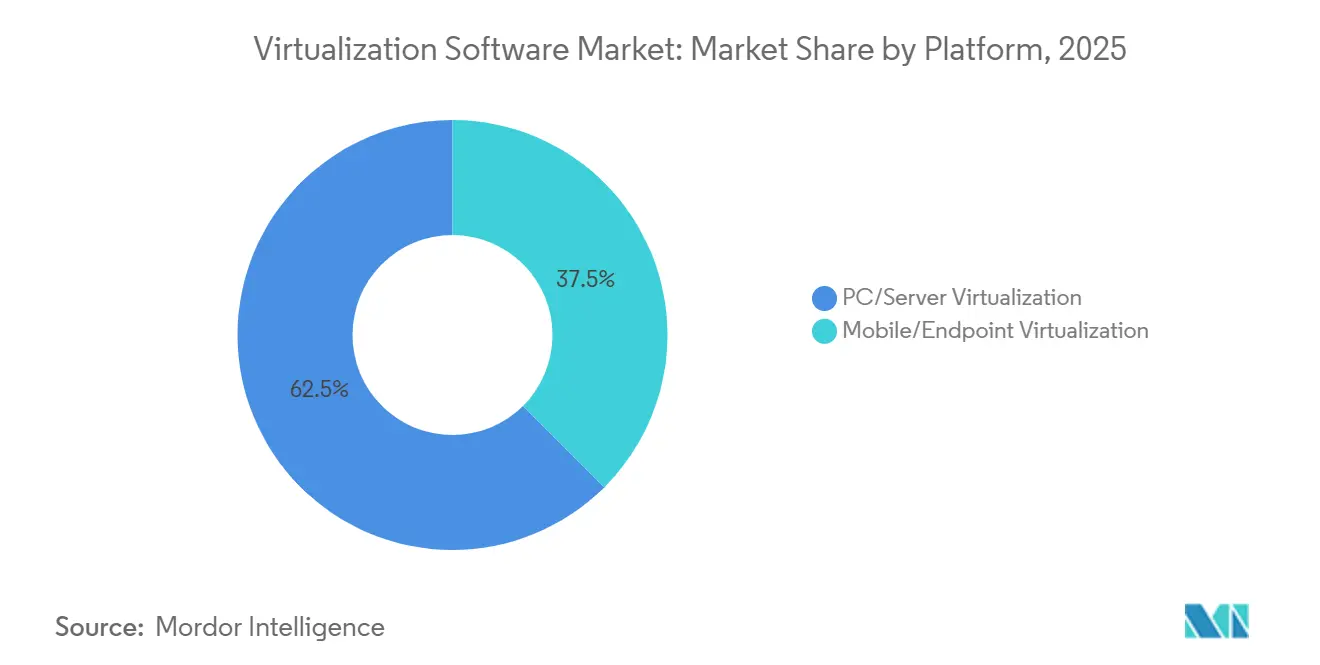
- By platform, PC and server virtualisation led with 62.46% revenue share in 2025, while mobile and endpoint virtualisation is projected to expand at a 16.32% CAGR through 2031.
- By virtualisation category, server and compute virtualisation held 42.72% of the 2025 base, whereas network and software-defined-network virtualisation is forecast to accelerate at 15.96% CAGR to 2031.
- By deployment model, on-premise clusters accounted for 50.54% of installations in 2025, yet hybrid configurations are advancing at a 17.74% CAGR to 2031.
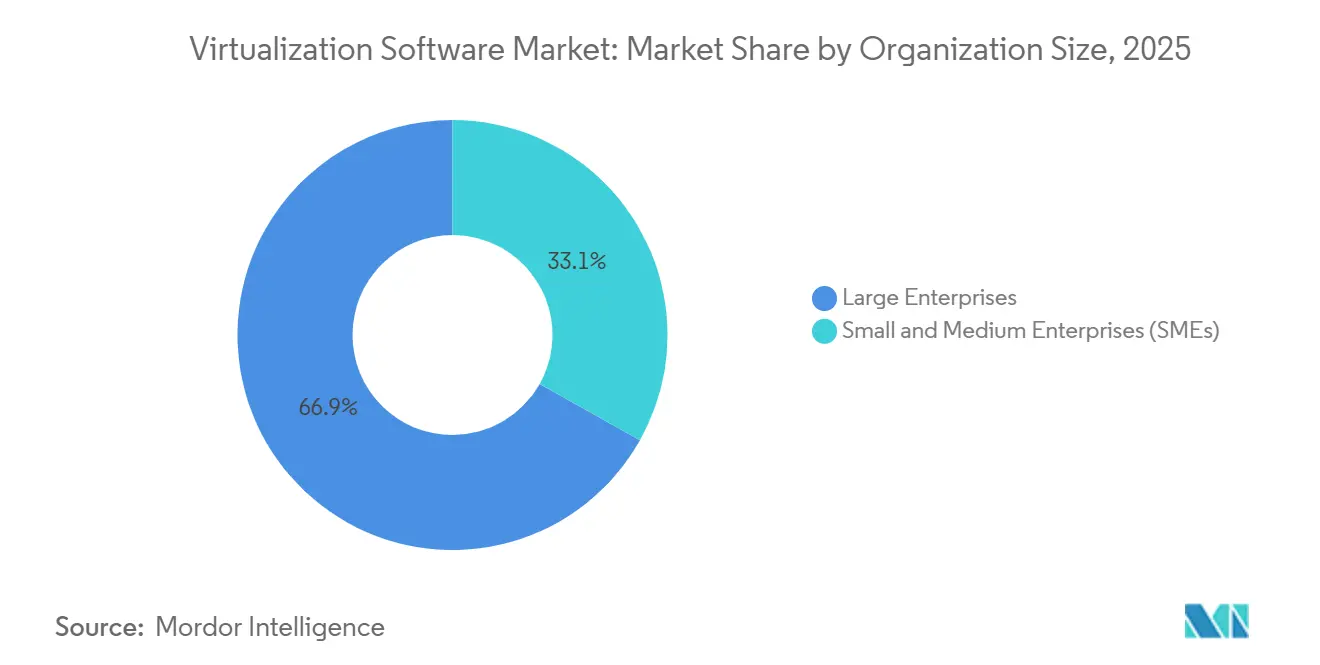
- By organisation size, large enterprises captured 66.86% of 2025 spending, while small and medium enterprises are expanding at 17.28% CAGR through 2031.
- By end-user industry, IT and telecommunications commanded 28.88% in 2025; healthcare and life sciences is the fastest sectoral riser at 16.92% CAGR to 2031.
- By geography, North America contributed 42.42% of 2025 revenue, whereas Asia Pacific is scaling at a 17.26% CAGR across the outlook period.
Note: Market size and forecast figures in this report are generated using Mordor Intelligence’s proprietary estimation framework, updated with the latest available data and insights as of January 2026.
Global Virtualization Software Market Trends and Insights
Drivers Impact Analysis*
| Driver | (~) % Impact on CAGR Forecast | Geographic Relevance | Impact Timeline |
|---|---|---|---|
| Cost-reduction from server consolidation | +2.8% | Global, strongest in North America and Europe | Medium term (2-4 years) |
| Cloud-first enterprise IT strategies | +3.2% | Global, led by North America and Asia Pacific | Long term (≥4 years) |
| Remote-work and edge-compute proliferation | +2.5% | Global, faster in Asia Pacific and Latin America | Short term (≤2 years) |
| Vendor diversification away from vSphere | +2.1% | North America and Europe | Short term (≤2 years) |
| Confidential-computing enabled virtualisation | +1.9% | North America, Europe, China | Medium term (2-4 years) |
| AI-optimised workload placement | +1.7% | Global, early uptake in North America and China | Long term (≥4 years) |
| Source: Mordor Intelligence | |||
Cost-Reduction From Server Consolidation
Enterprises running hundreds of physical hosts routinely devote more than one-third of data-center operating budgets to power, cooling, and real-estate overhead. Packing dozens of virtual machines onto each socket pushes utilisation above 60%, lengthens hardware refresh cycles, and allows factories to drop under-utilised racks without jeopardising throughput.[1] IBM Editorial Team, “Server Consolidation Benefits,” IBM, ibm.com European operators face additional pressure as the Energy Efficiency Directive obliges sites above 1 megawatt to publish annual power-usage-effectiveness figures, making workload density metrics a board-level key performance indicator.[2]European Commission, “Energy Efficiency Directive,” europa.eu Edge deployments magnify savings; lightweight hypervisors on shop-floor gateways locally filter sensor traffic, cutting wide-area-network egress fees for manufacturing firms by up to half.
Cloud-First Enterprise IT Strategies
Chief information officers now architect directly for workload mobility, pairing on-premise clusters with hyperscale regions to meet latency and data-residency targets without refactoring legacy applications. Financial-services institutions cite Basel III operational-resilience rules that keep transactional data on domestic soil yet permit non-sensitive analytics in public cloud, fueling projects such as Google Cloud VMware Engine and Azure VMware Solution, both of which logged triple-digit growth in billable hours during 2024. The United States Department of Defense’s Joint Warfighting Cloud Capability contract reinforces the pattern by requiring vendors to support monolithic virtual machines alongside microservices, acknowledging that COBOL and Ada workloads remain mission-critical.
Remote-Work and Edge-Compute Proliferation
Virtual-desktop-infrastructure shipments rose 22% in 2024 as hospitals issued secure desktops to clinicians working from home, satisfying HIPAA encryption mandates while keeping clinical latency under 50 milliseconds. Retailers are also embedding hypervisors into point-of-sale terminals and digital-signage controllers to isolate payment flows from inventory systems, meeting PCI-DSS segmentation requirements without purchasing duplicate hardware. At the automotive edge, real-time operating systems run beside infotainment Linux guests on in-vehicle compute modules, and hardware-assisted virtualisation guarantees sub-10-millisecond interrupt response for brake-by-wire functions, meeting ISO 26262 safety certification.
Vendor Diversification Away From vSphere
Broadcom’s decision to end VMware perpetual licences and boost subscription prices by roughly 300% prompted the sector’s largest migration wave in a decade. Nutanix disclosed that 40% of fiscal 2025 bookings involved VMware displacement, with predictable node-based pricing and integrated storage cited as advantages. Open-source ecosystems are expanding in parallel; Proxmox enterprise subscriptions climbed 60% in 2024 as mid-market firms pursued low-cost, high-availability clusters outside traditional licensing models.
Restraints Impact Analysis*
| Restraint | (~) % Impact on CAGR Forecast | Geographic Relevance | Impact Timeline |
|---|---|---|---|
| Deployment and lifecycle-management complexity | -1.4% | Global, acute in SME segment | Short term (≤2 years) |
| Escalating hypervisor licence costs | -1.8% | North America and Europe | Short term (≤2 years) |
| Rising VM-specific security attack surface | -0.9% | Global, higher in BFSI and healthcare | Medium term (2-4 years) |
| Container-first cultural shift dampening VM use | -1.2% | North America, Europe, Asia Pacific | Long term (≥4 years) |
| Source: Mordor Intelligence | |||
Deployment and Lifecycle-Management Complexity
Administering high-availability clusters, tuning memory ballooning, and orchestrating rolling upgrades still demand specialized skills. Certification programs can cost several thousand United States dollars per engineer and must be renewed biennially, a barrier for small enterprises that seldom maintain dedicated platform teams. In emerging markets, managed-service fees often rival software subscription costs, raising total cost of ownership. Compliance adds friction: life-sciences firms must document every configuration change under FDA 21 CFR Part 11, forcing additional tooling that integrates with hypervisor APIs.
Escalating Hypervisor Licence Costs
Post-acquisition price increases from Broadcom routinely reach triple digits during contract renewals, pushing many customers to evaluate competing platforms or adopt open-source alternatives. For organisations running tens of thousands of virtual machines, incremental annual expenses can stretch into eight-figure USD totals, overwhelming planned capital budgets. While subscription models promise flexible term lengths, abrupt hikes have highlighted the risk of vendor lock-in, especially in jurisdictions where exit-strategy skills are scarce.
*Our forecasts treat driver/restraint impacts as directional, not additive. The impact forecasts reflect baseline growth, mix effects, and variable interactions.
Segment Analysis
By Platform: Endpoint Mobility Fuels Dual-Screen Growth
The server side of the virtualization software market accounted for 62.46% of 2025 revenue, underpinned by financial-services and telecommunications operators that rely on Type-1 hypervisors for mission-critical uptime. Sub-millisecond failover, hardware-assisted memory encryption, and deterministic I/O scheduling remain non-negotiable for these workloads. Conversely, the virtualization software market is witnessing rapid demand for lightweight stacks that can run on low-power edge gateways, enabling local processing of sensor data before sending compressed payloads to regional clouds.
Mobile and endpoint virtualization is poised to grow at a 16.32% CAGR, the fastest track inside the virtualization software market. Employers increasingly stream high-resolution desktops to browsers, avoiding capital outlays for fully provisioned laptops. Hospitals retiring on-premise Citrix farms report endpoint management savings near 40% after pivoting to cloud-hosted thin clients. As password-less authentication becomes table stakes, virtual desktop instances can be spun up or torn down automatically, maintaining contextual security without manual patching cycles.


By Virtualization Category: Software-Defined Networks Capture Telco Spend
Server and compute layers still command 42.72% of category revenue because they consolidate sprawling x86 estates and enable live workload migration during maintenance windows. Financial traders segment latency-sensitive engines onto dedicated core pairs while relegating batch analytics to shared pools, balancing speed with cost. Network-focused virtualization, however, is pacing at 15.96% CAGR, aided by telecom providers that are virtualizing 5G core functions to trim per-site capital spend from roughly USD 500,000 for proprietary appliances to sub-USD 100,000 on commodity servers.
Within the virtualization software market, SD-WAN overlays replace multiprotocol label switching circuits, boosting agility for distributed branch offices. ETSI NFV blueprints ensure that disaggregated network functions remain interoperable, and ISO/IEC 27001 frameworks impose consistent security baselines. Storage and application virtualization continue to facilitate lift-and-shift of monolithic workloads, with policy-based data placement allowing administrators to pin sensitive datasets to encrypted media.
By Deployment Model: Hybrid Configurations Reconcile Sovereignty and Agility
On-premise clusters represented 50.54% of 2025 deployments as banks, pharmaceuticals, and public-sector agencies grapple with data-sovereignty statutes that limit cross-border transfers. The virtualization software market size for hybrid deployments is now scaling faster than either pure on-premise or pure software-as-a-service footprints. Azure Arc and Google Anthos extend cloud control planes into private racks, letting administrators enforce uniform policies while preserving local data residency.
Hybrid configurations are projected to grow at 17.74% CAGR because they let pharmaceutical firms keep FDA-validated production batches local while bursting computational-chemistry simulations to hyperscale clouds during peak discovery cycles. The virtualization software market share for subscription-based platforms that support policy-driven placement is therefore likely to inch upward as licensing moves to flex consumption across locations.
By Organization Size: SMEs Embrace Consumption Models
Large enterprises commanded 66.86% of 2025 spending, standardizing global footprints on VMware Cloud Foundation or Nutanix stacks and negotiating multi-year enterprise agreements that bundle support and upgrades. Such customers often operate tens of thousands of virtual machines and can justify dedicated platform-engineering personnel.
Small and medium enterprises are forecast to expand at 17.28% CAGR by exploiting pay-as-you-go pricing that removes upfront capital hurdles. A regional bank can provision virtual desktops in the public cloud for a low monthly charge, paying only during active business hours. Local-currency billing and self-service portals further lower barriers across South America and Southeast Asia, allowing hospitality and retail chains to scale environments seasonally without stranded capacity.
By End-User Industry: Clinical Workflows Drive Healthcare Surge
IT and telecommunications firms retained 28.88% of 2025 end-user expenditure, virtualizing packet cores and radio access networks to support Open RAN architectures that cut vendor lock-in. Carriers generally target 75% network-function virtualisation by 2026, affirming a central role for the virtualization software market in telco capital-budget plans.
Healthcare and life sciences is advancing at a 16.92% CAGR, the fastest of any vertical, as hospitals migrate electronic-health-record systems into hybrid clouds. HIPAA requires encryption at rest and in transit, and virtual machines can enforce those controls without rewriting legacy applications. Cloud-enabled hosting from vendors such as Epic reduces server-room footprints and enables operating-expenditure financing models that free capital for patient-care initiatives.
Geography Analysis
North America contributed 42.42% of 2025 revenue thanks to abundant hyperscaler regions that provide sub-ten-millisecond proximity to metro customers. Regulated enterprises adopt hybrid setups to satisfy the Digital Operational Resilience Act in Europe and similar regulations elsewhere that require critical data to remain within national borders for recovery-time objectives below four hours.
Asia Pacific is growing at 17.26% CAGR as China enforces cybersecurity rules that mandate domestic storage of personal information, bolstering demand for Huawei FusionSphere and indigenous KVM distributions.[3] India’s national cloud initiative likewise favors open-source hypervisors to reduce dependency on foreign providers while supporting rapid rollout of digital public infrastructure. Japan, South Korea, and Australia continue to pair on-premise clusters with regional public clouds for disaster-recovery resilience, reflecting the broadening reach of the virtualization software market into regulated industries across the region.
Europe remains pivotal as the General Data Protection Regulation obliges firms to quantifiably govern personal data flows. Hybrid compliance architectures dominate banking and insurance deployments in Germany, France, and the United Kingdom, assuring that sensitive workloads never traverse borders without explicit consent. South America and the Middle East and Africa trail in overall volumes but post double-digit growth as telecom modernisation and digital-government programs ramp.

Competitive Landscape
Broadcom’s October 2023 purchase of VMware redefined market economics. VMware commanded roughly 70% of the on-premise hypervisor installed base pre-deal, and the new subscription-only model lifted list prices by an average 300%, triggering a wave of proofs of concept for Nutanix AHV, Microsoft Hyper-V, Proxmox, and KVM derivatives. Nutanix reported that 40% of fiscal 2025 bookings were direct VMware displacements, buoyed by integrated storage and predictable node pricing.
Hyperscalers are leveraging silicon innovation to bake hypervisors beneath the user plane. AWS Nitro separates control functions into dedicated cards, trimming overhead and enabling confidential-computing attestations recognised by healthcare and finance regulators.[4]Amazon Web Services, “Amazon EC2 Nitro System,” aws.amazon.com Google Cloud VMware Engine and Azure VMware Solution each posted triple-digit growth in billable hours in 2024 as customers stretched familiar VMware tooling into public-cloud zones without re-architecting workloads.
Emerging challengers occupy niche frontiers. Scale Computing bundles hyperconverged stacks with an intentionally lightweight interface for mid-market clients, while Virtuozzo offers per-container billing models coveted by hosting providers. At the processor layer, Intel Trust Domain Extensions and AMD Secure Encrypted Virtualization encrypt guest memory inline, enabling banks to pursue zero-trust strategies without sacrificing performance. As confidential-computing use cases mature, these hardware roadmaps will increasingly influence the purchasing calculus inside the virtualization software market.
Virtualization Software Industry Leaders
VMware Inc.
Microsoft Corporation
Citrix Systems Inc.
Red Hat Inc. (IBM Corporation)
Nutanix Inc.
- *Disclaimer: Major Players sorted in no particular order

Recent Industry Developments
- September 2025: Microsoft announced a strategic partnership with Nutanix to integrate Azure Arc management capabilities with Nutanix AHV, enabling enterprises to manage hybrid virtualization environments through a unified control plane and addressing demand from customers seeking alternatives to VMware following Broadcom's licensing changes.
- August 2025: Amazon Web Services launched AWS Nitro v5, featuring enhanced confidential computing capabilities with support for 512GB encrypted memory per instance and hardware-based attestation, targeting financial services and healthcare customers requiring zero-trust architectures for virtualized workloads.
- July 2025: Broadcom completed the divestiture of VMware's end-user computing division to private equity firm KKR for USD 4 billion, allowing the acquirer to focus on core data-center virtualization while KKR plans to expand Horizon VDI and Workspace ONE into mid-market segments.
- June 2025: Red Hat announced OpenShift Virtualization 4.16 with native support for NVIDIA GPU virtualization, enabling enterprises to run AI inference workloads on virtual machines within Kubernetes clusters and addressing demand for hybrid VM-container architectures in machine-learning deployments.


Research Methodology Framework and Report Scope
Market Definitions and Key Coverage
Our study defines the virtualization software market as revenues generated from hypervisor-based platforms and related management suites that abstract compute, storage, network, or desktop resources so multiple operating systems or containers run concurrently on standard hardware. The model tracks license, subscription, and support fees across on-premise, cloud, and hybrid deployments for server, desktop, network, storage, and application virtualization.
Scope exclusion: standalone container orchestration stacks that operate without a hypervisor layer are outside this study.
Segmentation Overview
- By Platform
- PC / Server Virtualization
- Mobile / Endpoint Virtualization
- By Virtualisation Category
- Application Virtualization
- Network / SD-Network Virtualization
- Server / Compute Virtualization
- Storage Virtualization
- By Deployment Model
- On-Premise
- Cloud / SaaS-Hosted
- Hybrid
- By Organization Size
- Large Enterprises
- Small and Medium Enterprises (SMEs)
- By End-User Industry
- IT and Telecommunications
- BFSI
- Healthcare and Life Sciences
- Manufacturing
- Government and Defence
- Media and Entertainment
- Other End-User Industries
- By Geography
- North America
- United States
- Canada
- Mexico
- South America
- Brazil
- Argentina
- Chile
- Rest of South America
- Europe
- Germany
- United Kingdom
- France
- Italy
- Spain
- Russia
- Rest of Europe
- Asia Pacific
- China
- India
- Japan
- South Korea
- Singapore
- Malaysia
- Australia
- Rest of Asia Pacific
- Middle East
- United Arab Emirates
- Saudi Arabia
- Turkey
- Rest of Middle East
- Africa
- South Africa
- Nigeria
- Egypt
- Rest of Africa
- North America
Detailed Research Methodology and Data Validation
Primary Research
To close gaps, we interviewed enterprise infrastructure architects, hyperscale cloud capacity planners, value-added resellers, and open-source maintainers across North America, Europe, and Asia-Pacific. Their inputs on hypervisor replacement cycles, VM-to-container ratios, and regional pricing adjustments helped us validate assumptions and fine-tune growth levers.
Desk Research
Mordor analysts first mapped the demand pool using freely available tier-1 sources such as the US Bureau of Economic Analysis ICT spending tables, Eurostat cloud adoption surveys, Japan's METI server shipment data, NIST virtualization security guidelines, and peer-reviewed work on hypervisor density from IEEE Xplore. Company 10-Ks, investor decks, trade-association white papers, and curated news hits from Dow Jones Factiva and D&B Hoovers then supplied pricing trends, license mix shifts, and vendor share signals. The publicly listed sources cited illustrate the breadth; many additional references supported data checks.
Market-Sizing & Forecasting
A top-down construct begins with global IT hardware outlays, aligns server shipments and cloud capex, and applies virtual machine penetration and average license cost multipliers. Selective bottom-up roll-ups of supplier revenue disclosures and channel checks corroborate totals. Key variables include x86 server shipments, average VM density per host, public cloud IaaS spend, hypervisor ASP shifts, and regional data-center capacity additions, each forecast through multivariate regression supported by scenario testing. Where bottom-up evidence is sparse, proxy metrics such as rack power installations are used with conservative load factors.
Data Validation & Update Cycle
Outputs pass three-layer variance checks, peer review, and senior-analyst sign-off. Models refresh annually and are re-run when material events, large M&A, and pricing resets or regulatory changes occur, ensuring clients receive the latest viewpoint.
Why Mordor's Virtualization Software Baseline Stands Out for Decision-Makers
Published estimates often diverge because firms choose different virtualization layers, bundle security or NFV differently, and refresh data on varied cadences.
Key gap drivers include: some studies lump adjacent markets like container platforms or disaster-recovery suites; others apply uniform license prices across geographies; a few project growth from historical CAGR without checking server-shipment slowdowns. Mordor's definition, selective variable set, and yearly bottom-up validations minimize such distortions.
Benchmark comparison
| Market Size | Anonymized source | Primary gap driver |
|---|---|---|
| USD 94.82 B (2025) | Mordor Intelligence | - |
| USD 81.60 B (2024) | Global Consultancy A | Bundles virtualization security and NFV modules |
| USD 41.88 B (2024) | Industry Journal B | Excludes cloud-hosted hypervisor subscriptions |
These contrasts show that Mordor's carefully delimited scope, multi-variable modeling, and annual update cadence deliver a balanced, transparent baseline that technology suppliers and investors can trust when calibrating strategy and budgets.


Key Questions Answered in the Report
How large is the virtualization software market in 2026?
The virtualization software market size is USD 110.21 billion in 2026 and is projected to reach USD 224.59 billion by 2031.
What CAGR is expected for virtualization platforms to 2031?
Overall market revenue is forecast to advance at a 15.3% CAGR across 2026-2031.
Which region will grow fastest over the forecast horizon?
Asia Pacific is set to rise at a 17.26% CAGR, propelled by sovereign-cloud requirements in China and India.
Why are enterprises migrating away from VMware?
Broadcom replaced perpetual licences with costlier subscriptions, prompting customers to evaluate Nutanix AHV, Microsoft Hyper-V, and open-source KVM solutions.
What sector is leading adoption among end users?
IT and telecommunications retains the largest spend, whereas healthcare and life sciences is logging the fastest growth on the back of electronic-health-record migration.
How does hybrid deployment help with data-sovereignty rules?
Hybrid setups let organizations keep sensitive datasets on-premise while bursting non-critical workloads into public cloud regions, ensuring compliance with jurisdiction-specific residency laws.
Page last updated on:


