Virtual Pipeline Systems Market Size and Share
Market Overview
| Study Period | 2021 - 2031 |
|---|---|
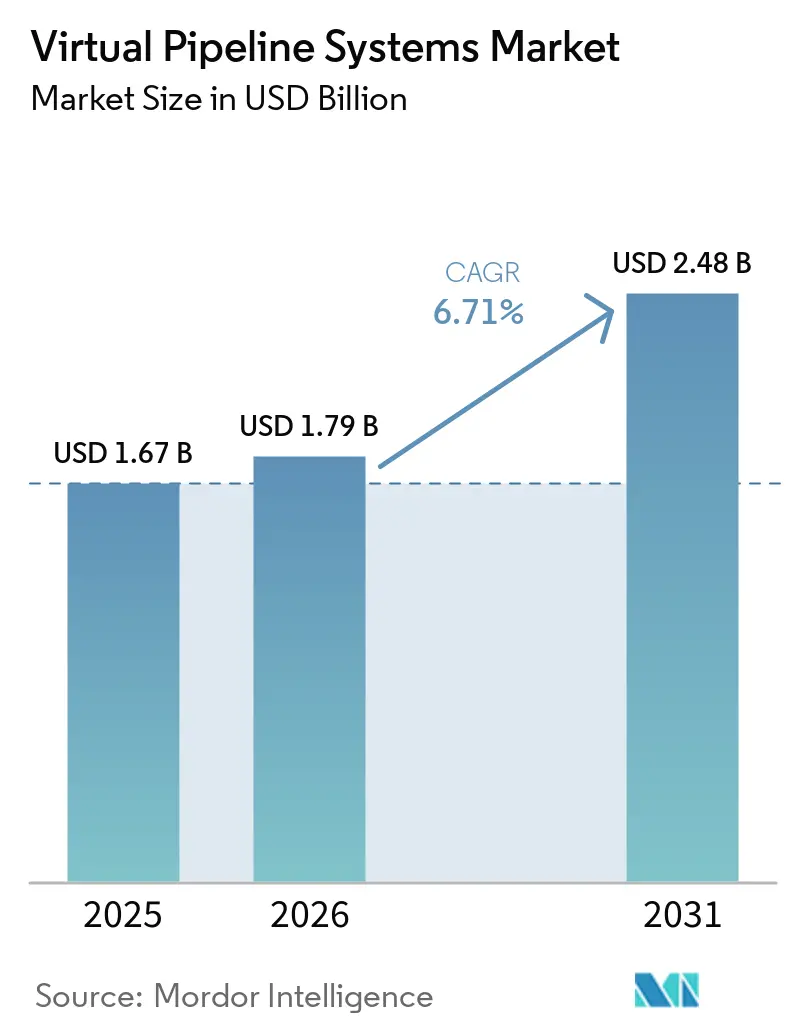
| Market Size (2026) | USD 1.79 Billion |
| Market Size (2031) | USD 2.48 Billion |
| Growth Rate (2026 - 2031) | 6.71% CAGR |
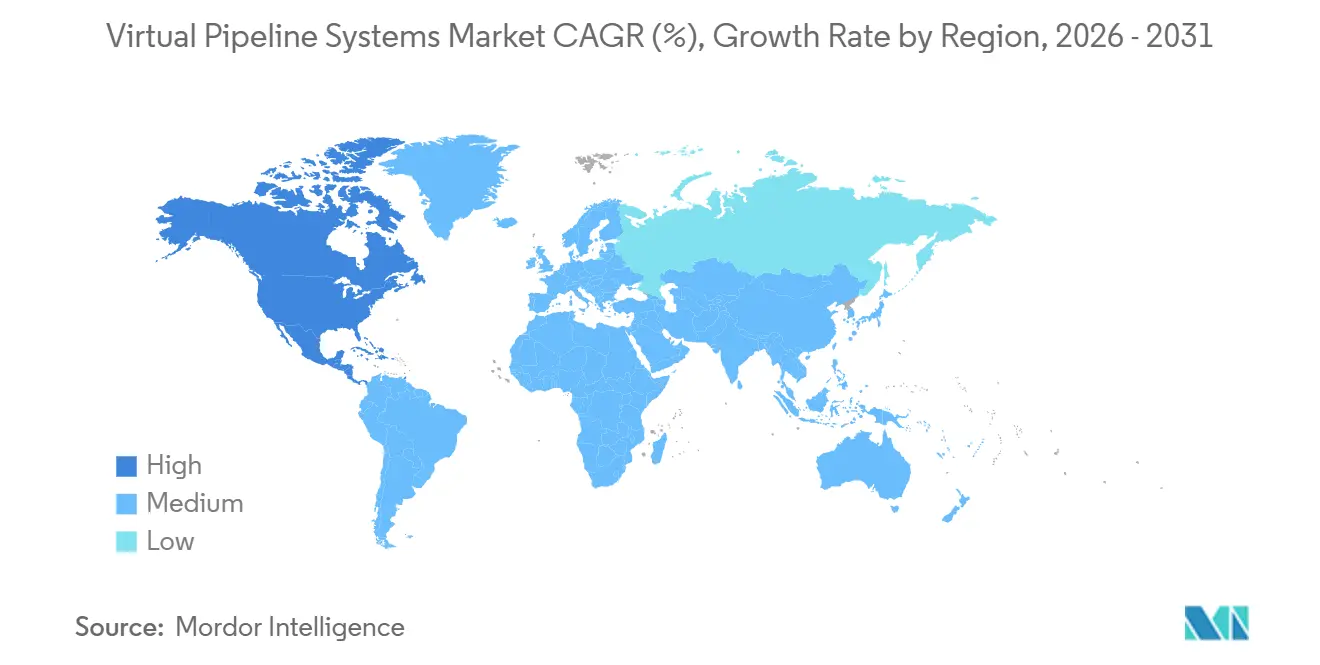
| Fastest Growing Market | North America |
| Largest Market | North America |
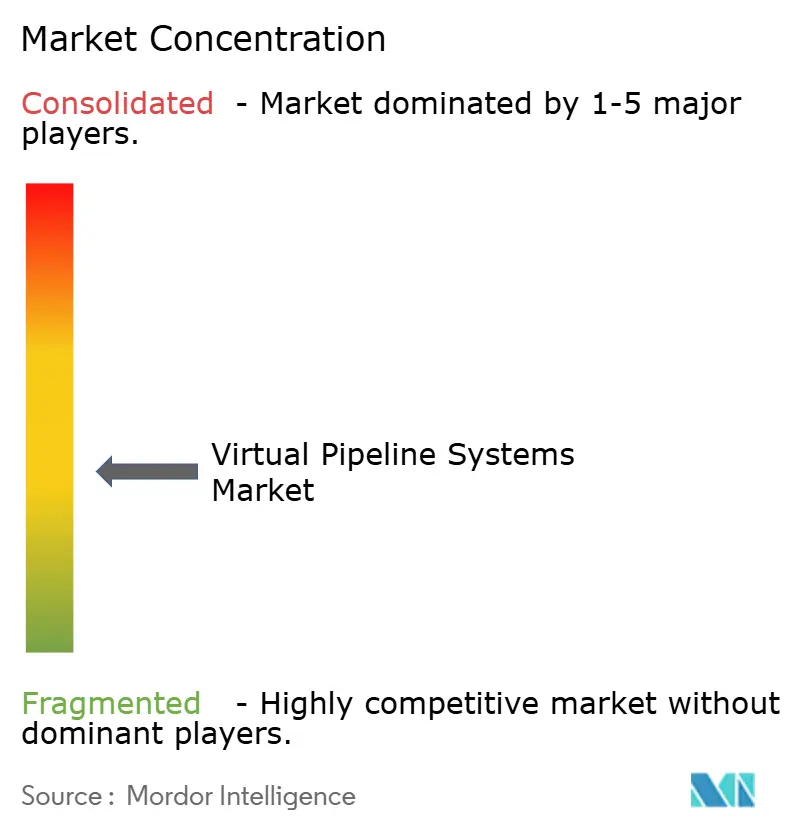
| Market Concentration | Medium |
Major Players *Disclaimer: Major Players sorted in no particular order Image © Mordor Intelligence. Reuse requires attribution under CC BY 4.0. | |
Virtual Pipeline Systems Market Analysis by Mordor Intelligence
The Virtual Pipeline Systems Market size was valued at USD 1.67 billion in 2025 and is estimated to grow from USD 1.79 billion in 2026 to reach USD 2.48 billion by 2031, at a CAGR of 6.71% during the forecast period (2026-2031). Strong off-grid industrial demand, hydrogen-ready trailer rollouts, and supportive North American and European regulations are reshaping last-mile natural-gas logistics. Compressed natural gas retained the largest revenue contribution, yet renewable natural gas and hydrogen blends are gaining traction because they earn premium carbon credits under the U.S. RNG Incentive Act and the EU Methane Regulation. Trailer innovation is slashing delivery costs as carbon-fiber cylinders cut tare weight by 40%, while digital twin platforms trim unscheduled downtime by 20%. North America leads adoption thanks to the Inflation Reduction Act incentives and a dense network of data centers that require peak-shaving LNG. However, volatile spot LNG prices and fragmented hazmat rules introduce margin uncertainty, especially for operators in emerging markets.
Key Report Takeaways
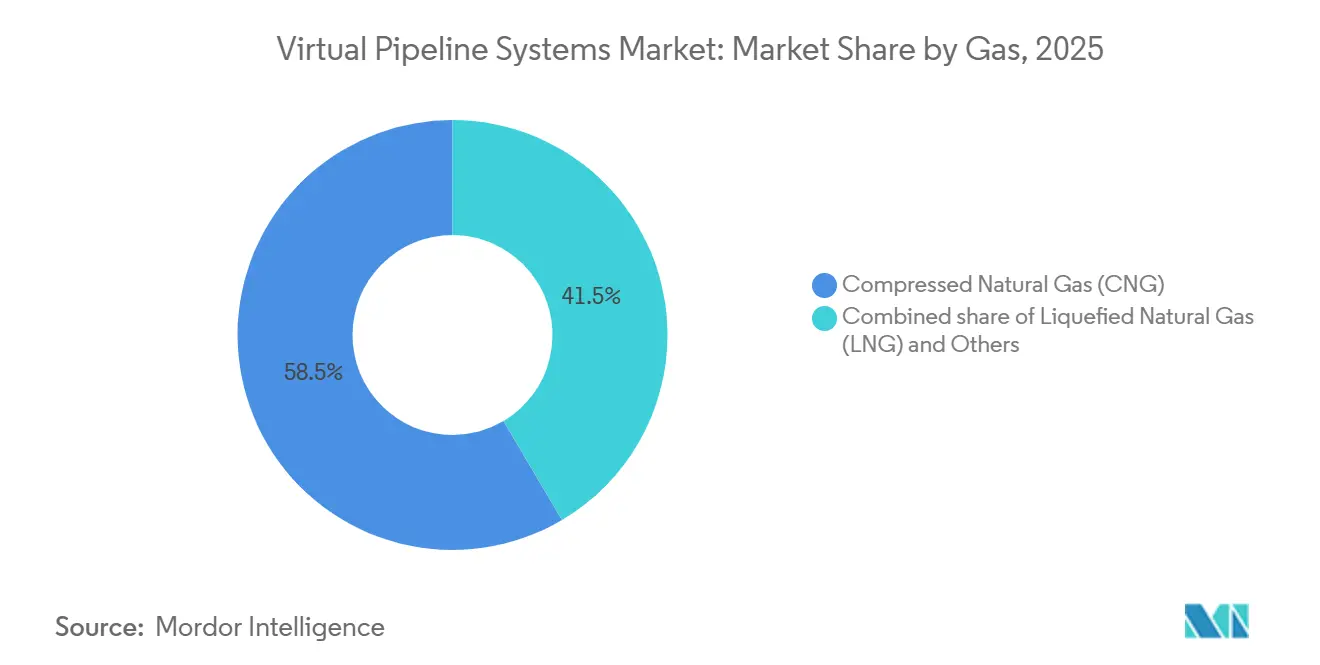
- By gas, compressed natural gas led with 58.5% of the virtual pipeline systems market share in 2025, while the Others segment (biogas, RNG, and hydrogen) is projected to register a 15.5% CAGR through 2031.
- By type, standard trailers held 75.8% revenue share in 2025; towable trailers are the fastest-growing at a 9.1% CAGR to 2031.
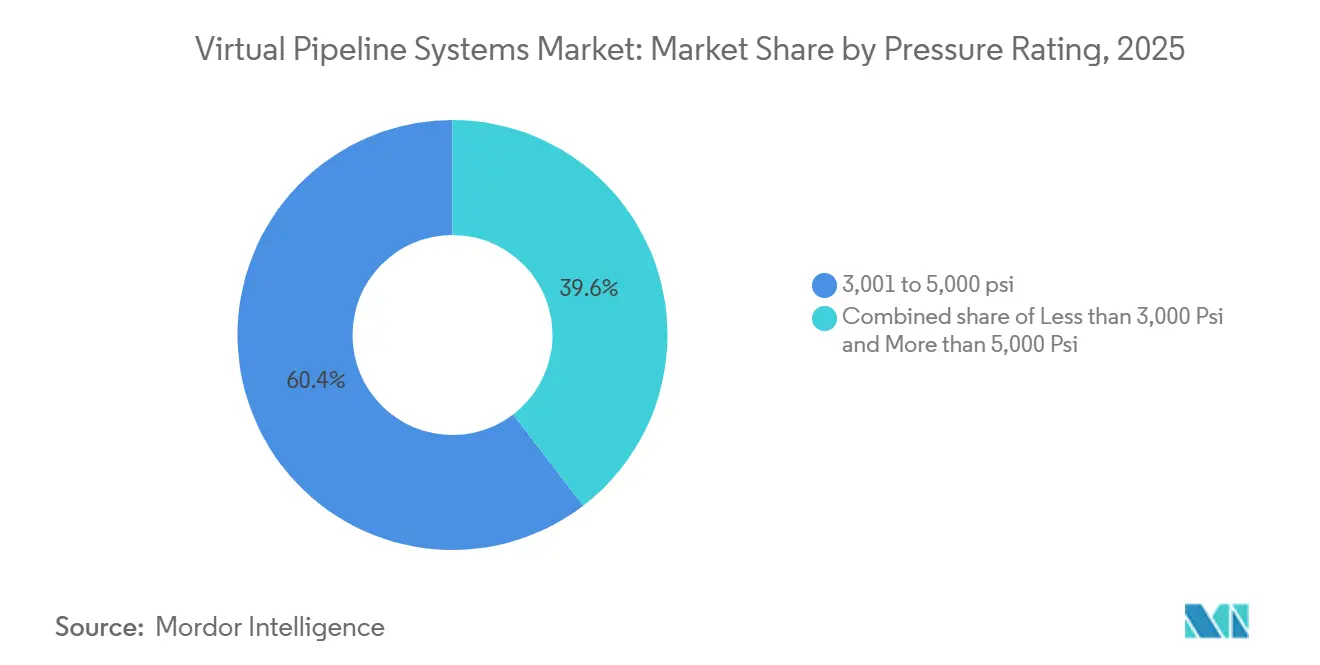
- By pressure rating, 3,001–5,000 psi modules accounted for 60.4% of the virtual pipeline systems market size in 2025, yet above-5,000 psi systems are forecast to expand at an 8.4% CAGR.
- By application, industrial users captured 50.2% share of the virtual pipeline systems market size in 2025, whereas transportation is advancing at a 7.8% CAGR on the back of heavy-duty LNG truck conversions.
- By geography, North America commanded 40.6% of the virtual pipeline systems market share in 2025 and is expected to post a 7.2% CAGR through 2031.
Note: Market size and forecast figures in this report are generated using Mordor Intelligence’s proprietary estimation framework, updated with the latest available data and insights as of January 2026.
Global Virtual Pipeline Systems Market Trends and Insights
Drivers Impact Analysis*
| Driver | (~) % Impact on CAGR Forecast | Geographic Relevance | Impact Timeline |
|---|---|---|---|
| Soaring off-grid natural-gas demand in mining & remote power | +1.2% | Global, concentrated in North America, Australia, APAC mining corridors | Medium term (2-4 years) |
| Modular trailer innovations slashing last-mile delivery costs | +1.0% | North America, Europe, APAC | Short term (≤ 2 years) |
| Carbon-credit premiums for renewable CNG & LNG blends | +1.3% | North America, EU, parts of South America | Medium term (2-4 years) |
| Industrial decarbonization mandates across EU & North America | +1.1% | EU, North America, spillover to APAC | Long term (≥ 4 years) |
| Hydrogen-ready composite cylinders expanding addressable market | +0.9% | EU, North America, Japan, South Korea | Long term (≥ 4 years) |
| Defense & disaster-relief agencies adopting mobile gas hubs | +0.6% | North America, Middle East, ASEAN | Short term (≤ 2 years) |
| Source: Mordor Intelligence | |||
Soaring Off-Grid Natural-Gas Demand in Mining & Remote Power
Remote mines, data centers, and military installations are bypassing lengthy pipeline build-outs in favor of virtual pipeline systems that can be deployed within weeks. Altaaqa Global erected a 40 MW mobile gas-turbine plant for a Kazakh data center in just 27 days, highlighting the speed advantage over fixed infrastructure [1]Altaaqa Global, “Kazakhstan 40 MW Mobile Gas Plant,” powerengineeringint.com. Australian mining sites using hybrid solar-battery systems still rely on mobile CNG or LNG for baseload power, cutting diesel consumption by 77.9%. In Texas, MPLX supplies Delaware Basin gas to a 400 MW crypto-mining campus that plans to scale to 1.5 GW under a long-term virtual-pipeline contract. The U.S. Air Force validated the model with a 250 kW multi-fuel generator at Travis Air Force Base, proving suitability for defense resilience. Growing power-intensive workloads and energy-security concerns keep this demand trend firmly positive over the medium term.
Modular Trailer Innovations Slashing Last-Mile Delivery Costs
Advances in carbon-fiber cylinders and better cryogenic insulation are reducing tare weight by about 40%, boosting payloads and lowering unit-delivery costs. Hexagon Agility’s TITAN 53 CNG module carries 492,000 scf, 40% more than legacy steel designs, which cuts trip frequency for high-volume clients [2]Hexagon Agility, “TITAN 53 Launch,” hexagonagility.com. CIMC ENRIC doubled LNG-cylinder production capacity after a 1,000-unit order that enables 3,500 km driving ranges for heavy trucks. Cryoshelter’s second-generation LNG tanks add 30% fuel capacity within the same footprint, widening commercial take-up. Digital-twin routing from Intangles trims unscheduled downtime by 20%, further shrinking the total cost of ownership. Collectively, these innovations place continual downward pressure on delivered-gas pricing.
Carbon-Credit Premiums for Renewable CNG & LNG Blends
Regulators are monetizing low-carbon fuels, creating direct margin uplift for operators that deliver renewable gas via virtual pipelines. The U.S. RNG Incentive Act provides a USD 1 per-gallon credit for renewable natural gas used in transportation, cushioning fleet operating costs [3]U.S. Congress, “RNG Incentive Act,” congress.gov. IRS Section 45Z further rewards fuels with lifecycle emissions below 50 kg CO₂e per MMBtu, slotting RNG into the top tier IRS.GOV. Clean Energy Fuels’ South Fork Dairy plant converts manure from 16,000 cows into 2.6 million gallons of RNG annually under long-term transit contracts. U.S. RNG supply reached 225 TBtu in 2025 and already fuels 94% of natural-gas vehicles. These premium credits accelerate project payback and intensify the shift toward bio-derived feedstocks.
Industrial Decarbonization Mandates Across EU & North America
Carbon-border tariffs and methane-leak rules are pushing manufacturers to swap coal and oil for cleaner gases that can reach off-grid facilities. The EU Carbon Border Adjustment Mechanism starts imposing tariffs on carbon-intensive imports in 2026, raising the cost of high-emission goods and incentivizing lower-carbon inputs. The EU Methane Regulation tightens leak detection from 2024, encouraging the use of virtual pipeline fleets equipped with real-time monitoring [4]European Parliament, “EU Methane Regulation,” europarl.europa.eu. Canada’s Clean Electricity Regulations target a net-zero grid by 2035, spurring cogeneration projects that depend on mobile LNG for reliability. In the United States, the EPA introduced a USD 900-1,500 per-ton methane fee effective 2024, nudging industries toward lower-leak supply chains. These mandates collectively expand the addressable market for compliant virtual pipeline services.
Restraints Impact Analysis*
| Restraint | (~) % Impact on CAGR Forecast | Geographic Relevance | Impact Timeline |
|---|---|---|---|
| High upfront CAPEX for cryogenic ISO & Type-IV modules | -0.8% | Global, acute in emerging markets with limited financing | Short term (≤2 years) |
| Patchwork of hazmat transport regulations across regions | -0.5% | ASEAN, South America, Africa | Medium term (2-4 years) |
| Scarcity of skilled drivers & technicians for LNG handling | -0.4% | APAC, Middle East, South America | Medium term (2-4 years) |
| Volatile spot LNG/CNG pricing impacting project IRRs | -0.6% | Global, most acute in Europe and Asia-Pacific | Short term (≤2 years) |
| Source: Mordor Intelligence | |||
High Upfront CAPEX for Cryogenic ISO & Type IV Modules
Cryogenic ISO tanks and Type-IV hydrogen trailers cost 50-100% more than conventional steel CNG units, deterring small operators from fleet upgrades. A single Type-IV container carrying 1.1 t of hydrogen sells for more than USD 500,000, whereas steel CNG trailers average USD 200-300 thousand. Chart Industries’ jumbo 1,700 m³ cryogenic tanks need specialized Louisiana fabrication, keeping global prices elevated. Emerging-market buyers often rely on used equipment lacking advanced safety features, widening a technology gap. Limited leasing facilities and high local interest rates extend payback cycles. This financial barrier slows technology diffusion even where fuel demand is robust.
Patchwork of Hazmat Transport Regulations Across Regions
Operators confront disparate regulations such as U.S. 49 CFR, Europe’s ADR, and the maritime IMDG Code, each imposing separate testing and documentation. ASEAN nations require country-specific permits, adding paperwork and idle time for cross-border fleets. South American markets like Brazil, Argentina, and Chile enforce different cylinder-inspection intervals, reducing asset utilization. Compliance costs scale with fleet size, favoring incumbents with larger legal teams. These fragmented rules delay market entry and inflate insurance premiums, trimming profitability.
*Our forecasts treat driver/restraint impacts as directional, not additive. The impact forecasts reflect baseline growth, mix effects, and variable interactions.
Segment Analysis
By Gas: Hydrogen and RNG Accelerate Diversification
CNG delivered 58.5% of the virtual pipeline systems market revenue in 2025, owing to its entrenched role in industrial heating and heavy transport. The Others category (biogas, RNG, and hydrogen) is forecast to grow at 15.5% CAGR through 2031, propelled by premium carbon credits and new hydrogen hubs. North American RNG output reached 225 TBtu in 2025, validating feedstock scalability. Hexagon Purus shipped Europe’s first Type-IV hydrogen units in March 2026, opening new decarbonization pathways.
RNG uptake is rising in dairy-intensive regions, with Clean Energy Fuels’ USD 85 million South Fork facility generating 2.6 million gallons annually under long-term transit contracts. Indonesia’s 40 t/d Cryobox micro-LNG plant shows how small-scale LNG can displace diesel on islands lacking pipelines. Hydrogen demand remains nascent yet is scaling in Germany, Japan, and South Korea as green-steel pilots advance.


By Type: Towable Trailers Win Speed-of-Deployment Niches
Standard trailers occupied 75.8% of the virtual pipeline systems market in 2025 because of high-volume payloads and predictable delivery cycles. Towable platforms, however, are projected to expand at 9.1% CAGR as mining camps and disaster-relief agencies favor rapid deployment. Altaaqa Global repositioned towable LNG modules to power a 40 MW Kazakh site within 27 days.
Standard units still dominate large industrial contracts; Hexagon Agility’s TITAN 53 cuts delivery trips by 30% thanks to 492,000 scf capacity. In urban settings, decoupled towable tanks relieve congestion by allowing tractors to swap loads without on-site idling, enhancing fleet productivity.
By Pressure Rating: High-Pressure Modules Enable Hydrogen Logistics
Systems rated 3,001-5,000 psi maintained 60.4% share of the virtual pipeline systems market size in 2025 as they balance cost and CNG payload efficiency. Above-5,000 psi modules are on track for an 8.4% CAGR to 2031 because hydrogen transport at up to 70 MPa demands higher pressures. CIMC-Hexagon delivered 30 MPa hydrogen trailers to Chinese clients in 2025, leveraging composite cylinders that are 40% lighter than metal-lined tanks.
Lower-pressure modules remain relevant for biogas, which often requires additional cleaning before high-compression. Compliance costs rise with pressure rating because ISO 11120 and ISO 16924 impose stricter test intervals, nudging smaller operators toward mid-pressure equipment.
By Application: Transportation Outpaces Industrial Demand
Industrial users captured 50.2% of the virtual pipeline systems market revenue in 2025, relying on LNG and CNG for cogeneration and process heat in pipeline-scarce zones. The transportation segment is growing at 7.8% CAGR as fleets convert to LNG trucks; China sold 152,000 units in 2023, reaching 16.7% penetration.
Clean Energy Fuels signed March 2026 RNG deals covering more than 8,000 refuse and transit vehicles, underscoring fleet momentum. Commercial microgrids also contribute: Crowley’s Puerto Rico LNG microgrid came online in 2026 to safeguard port operations during outages.
Geography Analysis
North America held 40.6% virtual pipeline systems market share in 2025 and is forecast to achieve a 7.2% CAGR to 2031, supported by the Inflation Reduction Act tax credits and DOE hydrogen-cost targets of USD 4 per kg by 2031. Operator NG Advantage has already delivered more than 25 Bcf of CNG to off-pipeline industrial clients, a record volume for the region. Canada’s net-zero grid policy pushes remote miners toward mobile LNG for on-site generation. Mexico’s 7.8 Mtpa Amigo LNG export project will supply northern industrial corridors via virtual pipelines starting in 2028.
Europe is expanding at a steady clip due to methane-leak rules and hydrogen pilots. Hexagon Purus secured a EUR 6.2 million (~ USD 7.21 million) order for hydrogen distribution units in March 2026, marking Europe’s first commercial deployment of Type-IV containers. Southern Europe is embracing small-scale LNG for island power; INOXCVA commissioned terminals in the Bahamas and Scotland that can reload ISO tanks for onward truck delivery.
The Asia-Pacific region shows the largest absolute volume growth. China’s LNG truck boom and India’s city-gas build-out anchor demand, though hazmat-rule fragmentation restrains fleet utilization. Indonesia’s Cryobox micro-LNG rollout proves small-island viability. Japan and South Korea are channeling subsidies into hydrogen logistics, fueling composite-cylinder imports.
South America and the Middle East constitute emerging pockets. Brazil is weighing micro-LNG to serve pre-salt platforms, whereas Argentina’s Vaca Muerta shale produces surplus gas suited for trucking to coastal demand centers. Gulf producers are adding LNG trailers to diversify revenue beyond crude, while South African mines in the Northern Cape deploy CNG trailers to offset diesel volatility.

Competitive Landscape
The virtual pipeline systems market is semi-fragmented. Chart Industries posted a USD 5.89 billion backlog in Q4 2025 on surging orders for micro-LNG equipment. Hexagon Purus shipped Europe’s first Type-IV hydrogen containers in 2026 and logged its 6,000th carbon-fiber cylinder delivery to Processkontroll the same year. NG Advantage leverages automated trailer-swap stations to deliver >25 Bcf of CNG with 99% reliability, illustrating how service innovation can offset scale gaps.
Differentiation centers on modular scalability, digital fleet optimization, and dual-fuel capability. Intangles’ predictive-maintenance software lowered downtime by 20%, while PipeSense’s AI leak detection improved accuracy to 50 ft, giving compliant fleets a regulatory hedge. ISO 11120 and ISO 16924 certification expenses create a barrier that favors vertically integrated suppliers with in-house testing.
White-space opportunities lie in Central Asia, sub-Saharan Africa, and select ASEAN states where pipeline coverage is sparse. However, limited equipment financing, driver shortages, and unaligned hazmat codes tip the playing field toward global manufacturers that can bundle leasing with training.
Virtual Pipeline Systems Industry Leaders
Xpress Natural Gas (XNG)
Hexagon Composites ASA
Chart Industries Inc.
NG Advantage LLC
Clean Energy Fuels Corp.
- *Disclaimer: Major Players sorted in no particular order

Recent Industry Developments
- July 2025: Baker Hughes inked a definitive agreement to acquire all outstanding shares of Chart Industries, valuing the deal at a total enterprise value of USD 13.6 billion.
- December 2024: Chart Industries secured a contract for 16 cold boxes and IPSMR technology for Woodside Energy’s Louisiana LNG project, valued at USD 200–300 million.
- October 2024: Hexagon Agility received USD 4.3 million in orders for RNG/CNG fuel systems for Class 8 trucks using Cummins’ X15N engine, expanding its addressable fleet base.
- June 2024: Peru LNG opened its second LNG truck-loading bay, doubling distribution capacity to domestic off-grid customers.


Global Virtual Pipeline Systems Market Report Scope
Virtual Pipeline Systems offers a flexible and cost-effective solution to traditional gas pipelines by transporting fuels such as Compressed Natural Gas (CNG) and Liquefied Natural Gas (LNG) through mobile carriers, including trucks, rail, or ships. These systems enable energy access in remote or infrastructure-limited regions. While they provide benefits such as rapid deployment, scalability, and lower upfront investment, they are typically more suitable for smaller volumes and shorter distances due to higher operational costs and logistical challenges compared to permanent pipeline networks.
The virtual pipeline systems market is segmented by gas type, system type, pressure rating, application, and geography. By gas, the market is categorized into CNG, LNG, and others. By type, the market is segmented into standard trailers and towable trailers. Based on pressure rating, the market is divided into less than 3,000 psi, 3,001 to 5,000 psi, and more than 5,000 psi. By application, the market is segmented into industrial, transportation, commercial, and residential sectors. Geographically, the report covers major regions including North America, Europe, Asia-Pacific, South America, the Middle East, and Africa. For each segment, market sizing and forecasts are provided based on value (USD).
| Compressed Natural Gas (CNG) |
| Liquefied Natural Gas (LNG) |
| Others (Biogas, Hydrogen, etc.) |
| Standard Trailer |
| Towable Trailer |
| Less than 3,000 Psi |
| 3,001 to 5,000 Psi |
| More than 5,000 Psi |
| Industrial |
| Transportation |
| Commercial and Residential |
| North America | United States |
| Canada | |
| Mexico | |
| Europe | Germany |
| United Kingdom | |
| France | |
| Italy | |
| NORDIC Countries | |
| Russia | |
| Rest of Europe | |
| Asia-Pacific | China |
| India | |
| Japan | |
| South Korea | |
| ASEAN Countries | |
| Rest of Asia-Pacific | |
| South America | Brazil |
| Argentina | |
| Rest of South America | |
| Middle East and Africa | Saudi Arabia |
| United Arab Emirates | |
| South Africa | |
| Egypt | |
| Rest of Middle East and Africa |
| By Gas | Compressed Natural Gas (CNG) | |
| Liquefied Natural Gas (LNG) | ||
| Others (Biogas, Hydrogen, etc.) | ||
| By Type | Standard Trailer | |
| Towable Trailer | ||
| By Pressure Rating | Less than 3,000 Psi | |
| 3,001 to 5,000 Psi | ||
| More than 5,000 Psi | ||
| By Application | Industrial | |
| Transportation | ||
| Commercial and Residential | ||
| By Geography | North America | United States |
| Canada | ||
| Mexico | ||
| Europe | Germany | |
| United Kingdom | ||
| France | ||
| Italy | ||
| NORDIC Countries | ||
| Russia | ||
| Rest of Europe | ||
| Asia-Pacific | China | |
| India | ||
| Japan | ||
| South Korea | ||
| ASEAN Countries | ||
| Rest of Asia-Pacific | ||
| South America | Brazil | |
| Argentina | ||
| Rest of South America | ||
| Middle East and Africa | Saudi Arabia | |
| United Arab Emirates | ||
| South Africa | ||
| Egypt | ||
| Rest of Middle East and Africa | ||


Key Questions Answered in the Report
How fast is demand growing for mobile gas delivery solutions?
The virtual pipeline systems market is forecasted to reach USD 2.48 billion by 2031, at a CAGR of 6.71%
Which fuel blend is expanding the quickest?
Biogas, renewable natural gas, and hydrogen collectively are projected to post a 15.5% CAGR through 2031 as carbon-credit incentives deepen adoption.
Why is North America the largest regional adopter?
Inflation Reduction Act tax credits, dense data-center buildouts, and federal hydrogen-cost targets help the region hold 40.6% market share and lead growth at 7.2% CAGR.
What constrains faster rollout of high-pressure trailers?
Upfront capital costs exceeding USD 500,000 per Type-IV hydrogen container and fragmented hazmat regulations slow fleet expansion in emerging markets.
Which companies dominate new equipment orders?
Chart Industries and Hexagon Purus have the largest current backlogs, while CIMC-Hexagon and Clean Energy Fuels secure sizable regional contracts.
Page last updated on:


