Pipeline Maintenance Services Market Size and Share
Market Overview
| Study Period | 2021 - 2031 |
|---|---|
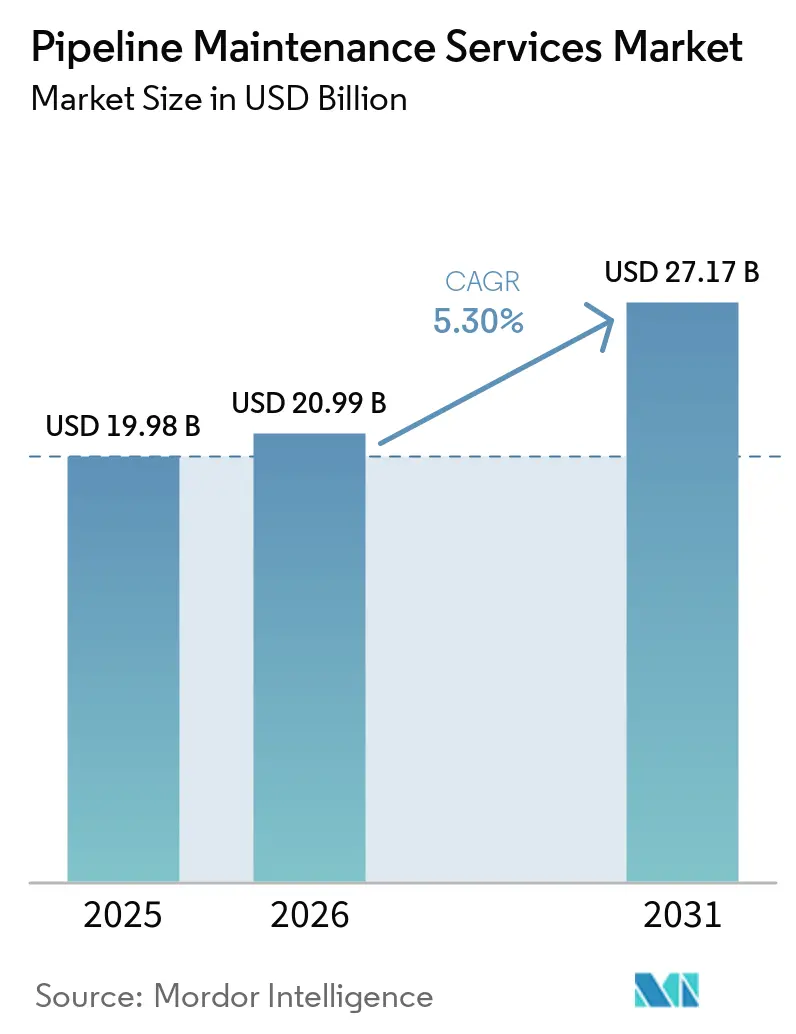
| Market Size (2026) | USD 20.99 Billion |
| Market Size (2031) | USD 27.17 Billion |
| Growth Rate (2026 - 2031) | 5.30% CAGR |
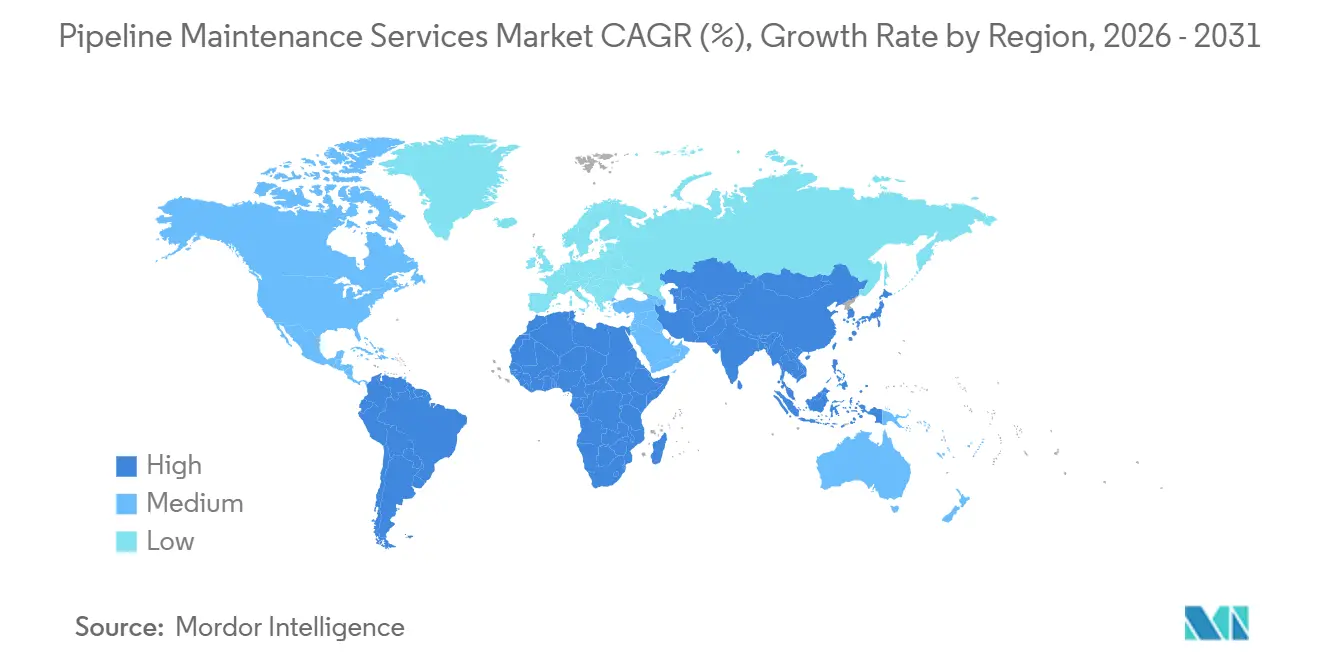
| Fastest Growing Market | Asia Pacific |
| Largest Market | North America |
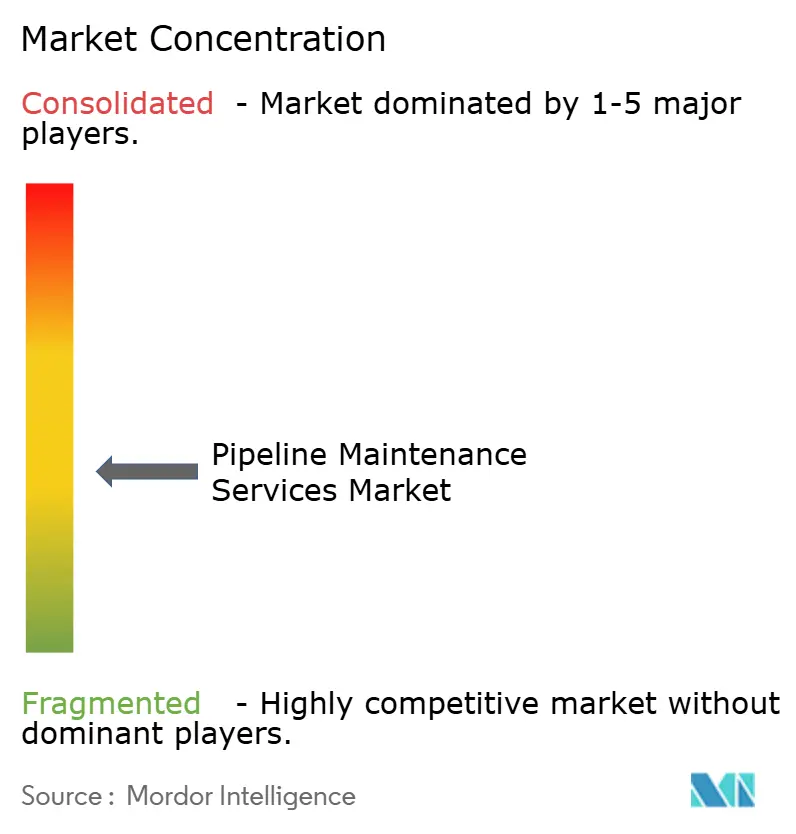
| Market Concentration | Medium |
Major Players*Disclaimer: Major Players sorted in no particular order Image © Mordor Intelligence. Reuse requires attribution under CC BY 4.0. | |
Pipeline Maintenance Services Market Analysis by Mordor Intelligence
The Pipeline Maintenance Services Market size is expected to increase from USD 19.98 billion in 2025 to USD 20.99 billion in 2026 and reach USD 27.17 billion by 2031, growing at a CAGR of 5.30% over 2026-2031.
Operators now treat integrity spending as essential rather than discretionary because shutdowns can trigger regulatory fines and significant revenue losses. Predictive maintenance tools that blend inline-inspection data with digital-twin analytics shorten response times and help companies avoid unplanned outages. Capital previously earmarked for large-scale expansion is increasingly diverted to extending the service life of existing assets, especially in North America and Europe, where much of the network was installed before 1970. Service providers are able to bundle inspection, data analytics, and repair to capture premium margins because asset owners prefer single-source contracts that simplify compliance audits. Competitive dynamics intensified after NDT Global acquired Entegra in 2025, accelerating technology convergence in ultrasonic and magnetic-flux-leakage platforms.[1]NDT Global, “CIGMA-x Launch Announcement,” ndt-global.com
Key Report Takeaways
- By type, maintenance services commanded 54% of the pipeline maintenance service market share in 2025, and their revenue is expected to grow at a 6.7% CAGR through 2031 as operators migrate from reactive repairs to continuous monitoring.
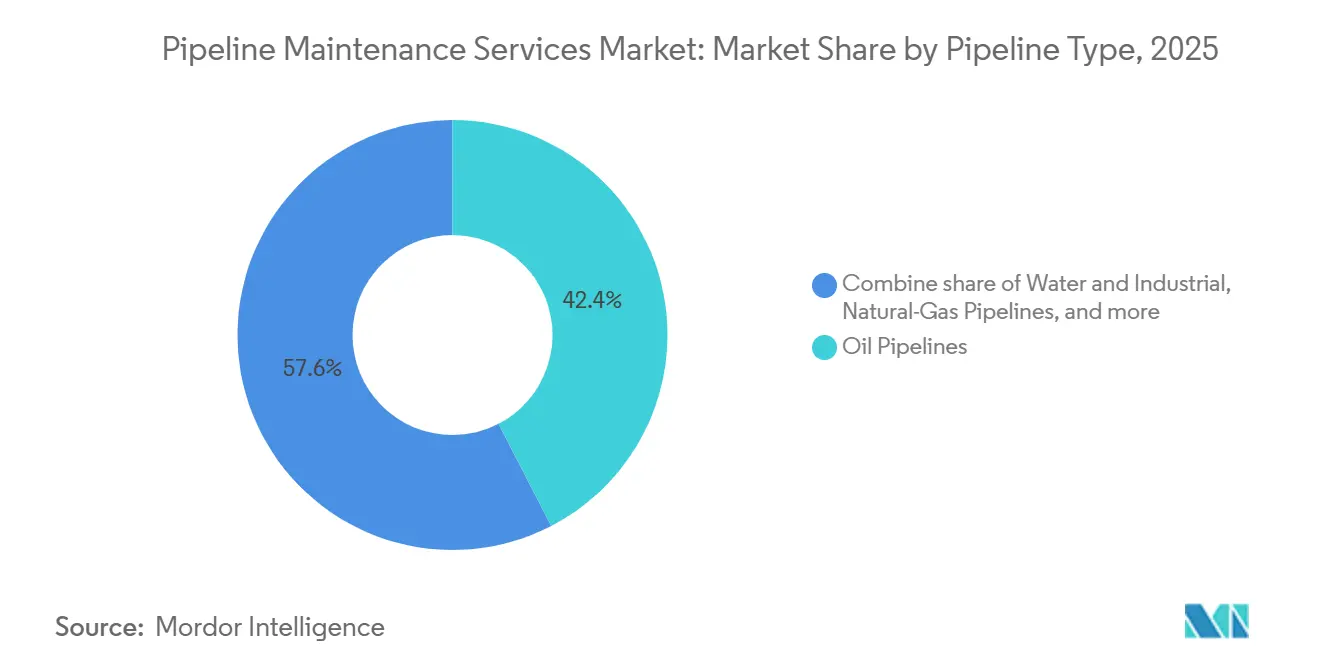
- By pipeline type, oil pipelines retained 42.4% of the pipeline maintenance service market size in 2025, yet water and industrial lines are expected to expand at a 6.9% CAGR on the back of lead-pipe replacement mandates.
- By application, oil and gas applications held 62.8% revenue share in 2025, while water and wastewater utilities are projected to grow at a 7.5% CAGR to 2031 as ESG targets tighten for municipal systems.
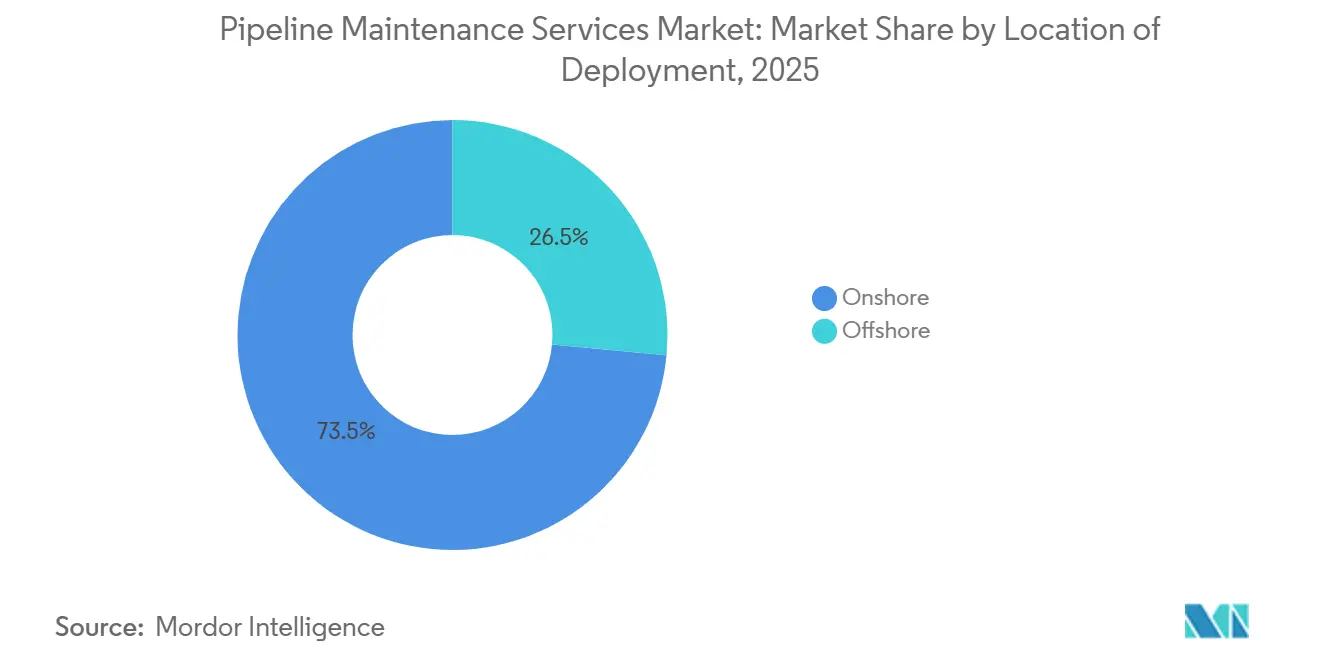
- By location of deployment, onshore deployments captured 73.5% of 2025 spending, whereas offshore projects are expected to rise 7.0% annually owing to deep-water field activity in Brazil and Norway.
- By geography, North America led with 41% revenue share in 2025, but Asia-Pacific is projected grow at a 7.3% CAGR through 2031, propelled by India’s 1,635-kilometer Numaligarh-to-Siliguri LNG corridor.
Note: Market size and forecast figures in this report are generated using Mordor Intelligence’s proprietary estimation framework, updated with the latest available data and insights as of 2026.
Global Pipeline Maintenance Services Market Trends and Insights
Drivers Impact Analysis*
| Driver | (~) % Impact on CAGR Forecast | Geographic Relevance | Impact Timeline |
|---|---|---|---|
| Aging transmission infrastructure in OECD economies | +1.2% | North America, Europe | Long term (≥ 4 years) |
| Stringent HSE regulations mandating periodic inline inspection | +1.0% | Global | Medium term (2-4 years) |
| Expansion of long-distance LNG pipelines in Asia | +0.9% | Asia-Pacific, Middle East | Medium term (2-4 years) |
| Digital twin adoption for predictive maintenance scheduling | +0.8% | Global | Short term (≤ 2 years) |
| Autonomous “smart-pig” technologies reducing downtime | +0.7% | Global | Medium term (2-4 years) |
| Rise of outcome-based service contracts | +0.6% | North America, Middle East | Long term (≥ 4 years) |
| Source: Mordor Intelligence | |||
Aging Transmission Infrastructure in OECD Economies
More than half of U.S. crude and refined-product trunk lines were installed before 1970, and corrosion-related incidents accounted for 18% of PHMSA-reportable events during 2024.[2]Pipeline and Hazardous Materials Safety Administration, “Pipeline Safety Incident Data,” phmsa.dot.gov European operators confront a parallel replacement cycle, especially in Germany, where post-war pipelines must now handle hydrogen blends that accelerate girth-weld cracking.[3]Enbridge, “Line 5 Tunnel Project Overview,” enbridge.com TC Energy plans to allocate 40% of its USD 1.26 billion 2026 capital program to integrity work, underscoring a structural pivot toward life-extension projects.[4]TC Energy, “2026 Capital Program,” tcenergy.com Inline inspection every three to five years costs 60-70% less than emergency repairs, keeping maintenance budgets resilient even when crude prices soften. Significant programs, such as Enbridge’s USD 500 million Line 5 tunnel, demonstrate that aging assets can still attract capital if the upgrade also mitigates environmental risk.
Stringent HSE Regulations Mandating Periodic Inline Inspection (ILI)
PHMSA’s 2022 Gas Transmission Final Rule extended reassessment to medium-consequence areas, effectively doubling the U.S. mileage that falls under mandatory inspection. In 2025, the UK Health & Safety Executive began requiring operators to align inspection frequency with modeled corrosion rates instead of fixed calendars. Convergence is also visible outside the OECD: Saudi Aramco adopted API 1163 protocols in 2024, opening Middle-East opportunities for Western service firms. Operators lacking in-house integrity teams increasingly outsource full-cycle inspection and engineering assessments, creating sticky revenue for contractors that can certify compliance documentation.
Expansion of Long-Distance LNG Pipelines in Asia
The 1,635-kilometer Numaligarh–Siliguri line traverses seismically active terrain, so fiber-optic distributed acoustic sensing was specified to provide real-time strain monitoring. Vietnam’s LNG build-out will add more than 800 kilometers of new transmission pipe by 2027. China laid 4,200 kilometers of trunk lines in 2025 that bundle 15-year operations-and-maintenance contracts into EPC awards, ensuring predictable revenue for inspection vendors. Because these assets are new, baseline inspections must be completed within 12 months of commissioning, generating a front-loaded demand surge that complements steady work on legacy systems elsewhere.
Digital Twin Adoption for Predictive Maintenance Scheduling
Rosen Group’s Pipeline Insights platform aggregates anonymized data from millions of joints, letting operators benchmark anomaly patterns against regional peers. Digital twins that fuse inline inspection logs, cathodic-protection voltages, and SCADA telemetry forecast remaining service life with 85-90% accuracy, cutting unnecessary excavations by 40% for early adopters such as Middle-East national oil companies. Service providers able to feed real-time operating data into dynamic risk models are now winning multi-year outcome-based contracts because they can quantify avoided downtime.
Restraints Impact Analysis*
| Restraint | (~) % Impact on CAGR Forecast | Geographic Relevance | Impact Timeline |
|---|---|---|---|
| Volatile crude-price cycles deferring OPEX budgets | -0.8% | North America, Latin America | Short term (≤ 2 years) |
| Scarcity of skilled ILI technicians in emerging markets | -0.5% | Asia-Pacific, Africa, South America | Medium term (2-4 years) |
| Cyber-security risks slowing rollout of remote diagnostic tools | -0.4% | Europe, North America | Short term (≤ 2 years) |
| ESG-driven capital flight from fossil-fuel projects | -0.6% | Europe, North America | Long term (≥ 4 years |
| Source: Mordor Intelligence | |||
Volatile Crude-Price Cycles Deferring OPEX Budgets
Price whiplash after brief spikes above USD 100 per barrel in early 2026 prompted some North American independents to trim discretionary spending by nearly 20%. Postponed inspections compound corrosion depth by 8-12% over a three-year gap, multiplying future repair costs. Maintenance demand, therefore, becomes counter-cyclical: spending dips during downturns only to surge later when regulatory reports expose growing anomaly backlogs. Service providers must balance capacity planning and equipment procurement against this volatility.
Scarcity of Skilled ILI Technicians in Emerging Markets
Fewer than 200 new Level II and Level III ultrasonic or magnetic-flux-leakage interpreters graduate annually across Southeast Asia, Africa, and Latin America, while the median age of certified U.S. personnel now exceeds 52 years. Wage premiums of 25-30% are required to retain senior staff, inflating project budgets. To bridge the gap, companies such as Rosen and NDT Global have opened regional training centers, but throughput remains insufficient, delaying project schedules. Semi-automated anomaly-classification algorithms could reduce dependence on scarce labor, yet regulators still insist on human sign-off for critical assessments.
*Our forecasts treat driver/restraint impacts as directional, not additive. The impact forecasts reflect baseline growth, mix effects, and variable interactions.
Segment Analysis
By Type: Maintenance Dominance Reflects Preventive Shift
Maintenance services held 54% of 2025 revenue, and the pipeline maintenance service market size for this segment is forecast to rise at a 6.7% CAGR to 2031. Inspection rules requiring risk-aligned intervals elevate baseline demand, while digital twins lengthen safe operating windows between excavations. Repair activities such as hot tapping and composite wraps maintain a steady share because anomalies detected by inspection still require field intervention. Replacement remains smallest because permitting hurdles and community pushback slow outright rerouting.
Predictive models now guide intervention timing based on corrosion kinetics instead of pre-set calendars, producing savings that encourage operators to increase inspection frequency. Service firms that combine data analytics with field crews win recurring awards because clients prefer a single point of accountability. During commodity downturns, maintenance budgets prove less elastic than capital projects, stabilizing revenue for contractors focused on this segment.
By Pipeline Type: Water Infrastructure Gains Momentum
Oil lines represented 42.4% of 2025 revenue, yet water and industrial pipes are expanding at 6.9% CAGR. Lead-service-line replacement under the EPA’s 10-year mandate drives a surge in assessment contracts, and American Water Works alone has earmarked USD 3.1 billion in 2026 capex. Gas pipelines benefit from coal-to-gas power-sector conversions, but refined-product lines face long-term demand erosion as electric-vehicle penetration climbs.
NDT Global’s CIGMA-x offers stress-corrosion detection in gas networks, whereas municipal operators need leak-location and condition assessment for cast-iron mains. Because many local water utilities lack in-house data analysts, vendors offering turnkey inspection-plus-engineering packages secure long-term service agreements. Regional regulatory pressure ultimately shapes spending: cities with strict timelines for lead removal will require higher inspection cadence than those with deferred compliance targets.


By Application: Utilities Emerge as Growth Engine
Oil and gas uses contributed 62.8% revenue in 2025, but water and wastewater utilities are projected to post the fastest 7.5% CAGR. The pipeline maintenance service market share captured by chemical and petrochemical applications remains small yet stable because refinery and plant operators adhere to internal asset-integrity management programs. District heating, slurry, and other niche lines provide steady but limited demand.
Tighter drinking-water quality limits on PFAS compounds oblige utilities to catalog all service-line materials, spurring contract awards for condition assessment and targeted rehabilitation. Oil and gas majors already employ advanced inspection technologies and therefore drive high-spec demand; municipal buyers are cost-sensitive but increasingly recognize lifetime-value savings from predictive analytics. Growth, therefore, depends on vendors articulating clear return-on-investment narratives to non-technical procurement teams.
By Location of Deployment: Offshore Complexity Commands Premiums
Onshore lines accounted for 73.5% of the 2025 value, while offshore projects are forecast to rise 7.0% annually through 2031 due to deep-water development in Brazil’s pre-salt basins and Norway’s Johan Castberg field. Vessel charter rates, ROV mobilization, and weather downtime make offshore inspection 4-6 times more expensive, encouraging operators to choose vendors that can deliver multiple sensor modalities in a single campaign.
Subsea 7’s combination of ultrasonic gauging and visual imaging reduces voyage count and limits exposure to weather delays. DNV and ISO standards governing North-Sea operations mandate biennial subsea checks, keeping demand consistent even when exploration capex softens. In contrast, onshore rules allow deferral on low-consequence segments, creating lumpier schedules but larger absolute revenue pools.
Geography Analysis
North America’s 41% revenue share in 2025 reflects its 3.2 million-kilometer network and strict PHMSA enforcement. Williams Companies budgeted USD 210 million for 2026 integrity programs, illustrating that maintenance remains non-negotiable even amid price swings. Operators extensively adopt digital twins, and the region leads in outcome-based contracting, rewarding contractors with integrated analytics and field execution.
Asia-Pacific is the pipeline maintenance service market’s fastest-growing region at 7.3% CAGR. India’s 1,635-kilometer LNG corridor and Vietnam’s terminal network expansions trigger front-loaded inspection demand. China links 4,200 kilometers of new trunk lines into 15-year O&M packages, locking inspection vendors into long-term revenue streams. Younger pipeline stock means the immediate priority is baseline integrity recording, but high-sulfur gas compositions accelerate corrosion, ensuring that follow-up inspections occur sooner than in OECD systems.
Europe faces twin imperatives: Eastern members must replace Soviet-era steel, while Western operators modify high-strength pipelines for hydrogen blends. Germany’s hydrogen-ready grid requires specialty tools that identify embrittlement long before leaks occur. Capital flight from oil projects pushes contractors to diversify toward natural-gas and water-utility clients, shifting the competitive mix.

Competitive Landscape
Five global providers, Baker Hughes, Rosen Group, STATS Group, NDT Global, and T.D. Williamson holds about 38% combined share, indicating moderate concentration. NDT Global’s 2025 acquisition of Entegra merged ultrasonic and ultra-high-resolution magnetic-flux-leakage technologies, prompting rivals to pursue vertical integration. T.D. Williamson’s acquisition of Petro-Line added PETROSLEEVE® permanent repair capability, letting the firm offer non-intrusive fixes during live operations.
Technology leadership now rests on data interpretation rather than sensor hardware alone. Firms that deliver automated severity grading charge 15-20% pricing premiums. Regional equipment depots shorten mobilization times and win outcome-based service contracts that guarantee uptime. White-space exists in municipal water systems, where vendors can differentiate by bundling inspection, analytics, and rehabilitation under a single invoice.
Software-centric entrants threaten to commoditize hardware by offering cloud-based integrity platforms that can ingest data from any inspection tool. Incumbents respond by embedding analytics directly into their service propositions or partnering with niche software developers. Market concentration is therefore expected to tighten further as scale becomes critical for multi-year, multi-geography agreements.
Pipeline Maintenance Services Industry Leaders
Baker Hughes Co.
TD Williamson Inc.
Rosen Group
STATS Group
EnerMech Ltd
- *Disclaimer: Major Players sorted in no particular order

Recent Industry Developments
- January 2026: STATS Group secured a California pipeline-contractor license, expanding its U.S. reach and enabling deployment of its BISEP isolation technology.
- January 2026: NDT Global commercially launched CIGMA-x, an ultrasonic Lamb-wave tool for gas pipelines that detects stress-corrosion cracking with 90% probability.
- July 2025: NDT Global acquired Entegra, integrating ultra-high-resolution magnetic-flux-leakage capabilities into its inspection portfolio.
- April 2025: STATS Group and EPOMS won a three-year Malaysian pipeline-isolation contract covering onshore and offshore assets.


Global Pipeline Maintenance Services Market Report Scope
The Pipeline Maintenance Services Market encompasses the global industry dedicated to providing specialized services, technologies, and solutions aimed at maintaining the integrity, safety, reliability, and operational efficiency of oil, gas, water, and chemical pipeline networks. These services include routine and advanced maintenance activities such as inspection, cleaning, monitoring, repair, rehabilitation, corrosion prevention, and emergency response throughout the lifecycle of transmission and distribution pipelines.
The pipeline maintenance services market is segmented into type, pipeline type, application, location of deployment, and geography. By type, the market is segmented into maintenance, repair, and replacement. By pipeline type, the market is segmented into oil, natural gas, refined products, and water and industrial. By application, the market is segmented into oil and gas, chemicals and petrochemicals, water and wastewater utilities, and other applications. By location of deployment, the market is divided into onshore and offshore. The report also covers the market size and forecasts for the pipeline maintenance services market across the major regions. For each segment, the market size and forecasts have been done based on revenue (USD billion).
| Maintenance |
| Repair |
| Replacement |
| Oil Pipelines |
| Natural-Gas Pipelines |
| Refined-Product Pipelines |
| Water and Industrial Pipelines |
| Oil and Gas |
| Chemicals and Petrochemicals |
| Water and Waste-water Utilities |
| Other Applications |
| Onshore |
| Offshore |
| North America | United States |
| Canada | |
| Mexico | |
| Europe | Germany |
| United Kingdom | |
| France | |
| Italy | |
| NORDIC Countries | |
| Russia | |
| Rest of Europe | |
| Asia-Pacific | China |
| India | |
| Japan | |
| South Korea | |
| ASEAN Countries | |
| Australia and New Zealand | |
| Rest of Asia-Pacific | |
| South America | Brazil |
| Argentina | |
| Colombia | |
| Rest of South America | |
| Middle East and Africa | Saudi Arabia |
| United Arab Emirates | |
| South Africa | |
| Nigeria | |
| Algeria | |
| Rest of Middle East and Africa |
| By Type | Maintenance | |
| Repair | ||
| Replacement | ||
| By Pipeline Type | Oil Pipelines | |
| Natural-Gas Pipelines | ||
| Refined-Product Pipelines | ||
| Water and Industrial Pipelines | ||
| By Application | Oil and Gas | |
| Chemicals and Petrochemicals | ||
| Water and Waste-water Utilities | ||
| Other Applications | ||
| By Location of Deployment | Onshore | |
| Offshore | ||
| By Geography | North America | United States |
| Canada | ||
| Mexico | ||
| Europe | Germany | |
| United Kingdom | ||
| France | ||
| Italy | ||
| NORDIC Countries | ||
| Russia | ||
| Rest of Europe | ||
| Asia-Pacific | China | |
| India | ||
| Japan | ||
| South Korea | ||
| ASEAN Countries | ||
| Australia and New Zealand | ||
| Rest of Asia-Pacific | ||
| South America | Brazil | |
| Argentina | ||
| Colombia | ||
| Rest of South America | ||
| Middle East and Africa | Saudi Arabia | |
| United Arab Emirates | ||
| South Africa | ||
| Nigeria | ||
| Algeria | ||
| Rest of Middle East and Africa | ||


Key Questions Answered in the Report
How big will global spending on pipeline maintenance reach by 2031?
The pipeline maintenance service market size is forecast to reach USD 27.17 billion by 2031, up from USD 20.99 billion in 2026.
Which segment grows fastest through 2031?
Maintenance services advance at a 6.7% CAGR as operators favor preventive inspections over reactive repairs.
Why is Asia-Pacific attracting the most new investment?
Large-scale LNG corridors in India, Vietnam, and China require baseline and follow-up inspections, driving a regional 7.3% CAGR.
What technologies cut downtime during inline inspection?
Autonomous smart-pigs like NDT Globalism CIGMA-x and isolation plugs such as STATS Group's Remote Tecno Plug allow work without extended shutdown.
How are ESG pressures reshaping capital allocation?
Investors reduce exposure to crude-oil projects, pushing operators to prioritize gas, water, and hydrogen-ready pipelines, which shifts maintenance demand toward low-carbon assets.
Page last updated on:


