
Market Overview
| Study Period | 2021 - 2031 |
|---|---|
| Forecast Data Period | 2026 - 2031 |
| Base Year Market Size (2025) | 18.67 gigawatt |
| Market Volume (2026) | 19.7 gigawatt |
| Market Volume (2031) | 25.79 gigawatt |
| Growth Rate (2026 - 2031) | 5.53 % |
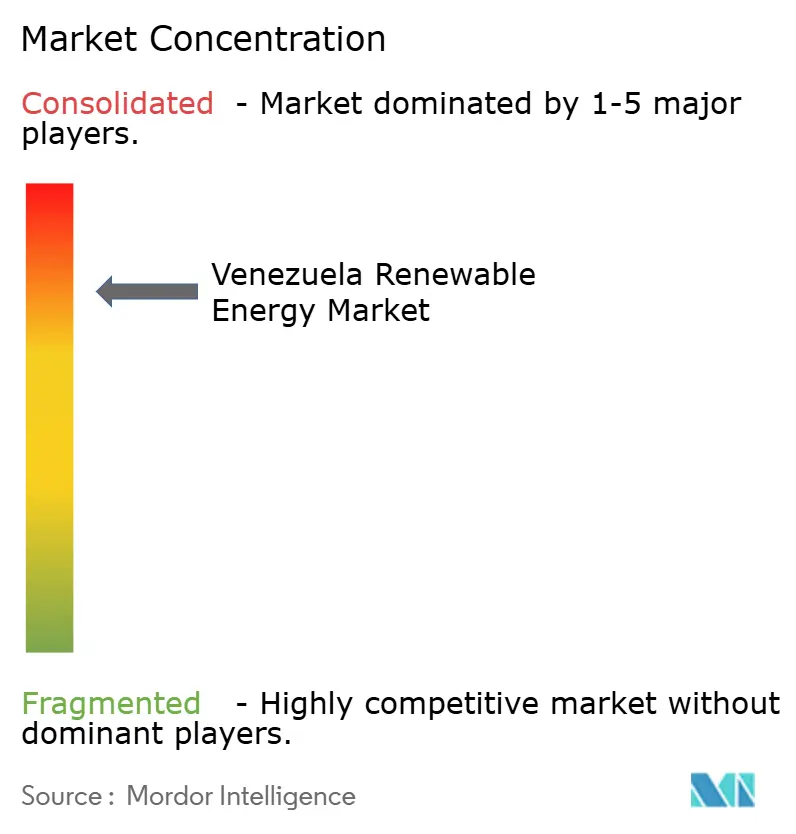
| Market Concentration | High |
Major Players *Disclaimer: Major Players sorted in no particular order Image © Mordor Intelligence. Reuse requires attribution under CC BY 4.0. | |
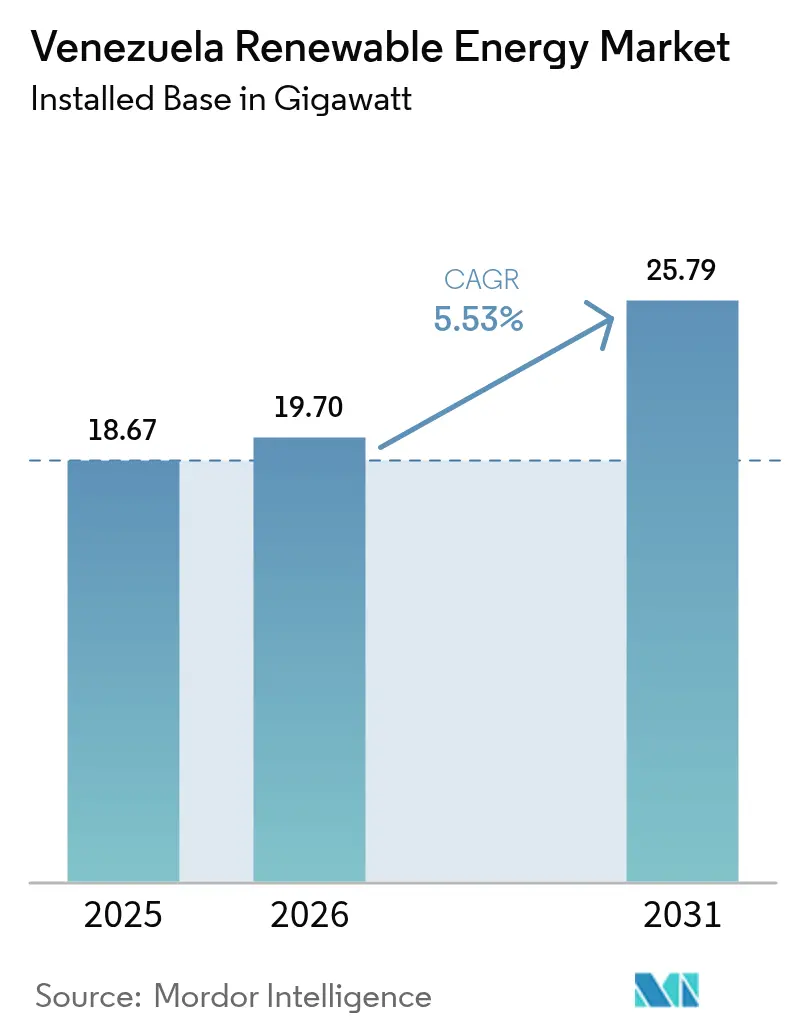
Venezuela Renewable Energy Market Analysis by Mordor Intelligence
Venezuela Renewable Energy Market size in 2026 is estimated at 19.7 gigawatt, growing from 2025 value of 18.67 gigawatt with 2031 projections showing 25.79 gigawatt, growing at 5.53% CAGR over 2026-2031.
This muted expansion reflects structural headwinds, political instability, sanctions, and tariff distortions, rather than resource scarcity, because the country’s solar-, wind-, and biomass-rich geography could theoretically supply 22 times its projected power demand by 2050. Over-reliance on hydroelectric generation exposes the grid to drought-linked blackouts; yet, pockets of growth are emerging in distributed solar, diaspora-financed rooftop systems, and crypto-mining-backed microgrids. Developers able to bypass conventional project-finance channels by tapping multilateral climate funds and remittance flows are carving out niche opportunities. Equipment suppliers offering hybrid solar-storage packages tailored for Venezuela’s weak transmission backbone are also gaining traction.
Key Report Takeaways
- By technology, hydropower captured 99.15% of installed capacity in 2025; solar volume is forecast to expand at a 133.7% CAGR through 2031, signaling the fastest growth path in the Venezuela renewable energy market.
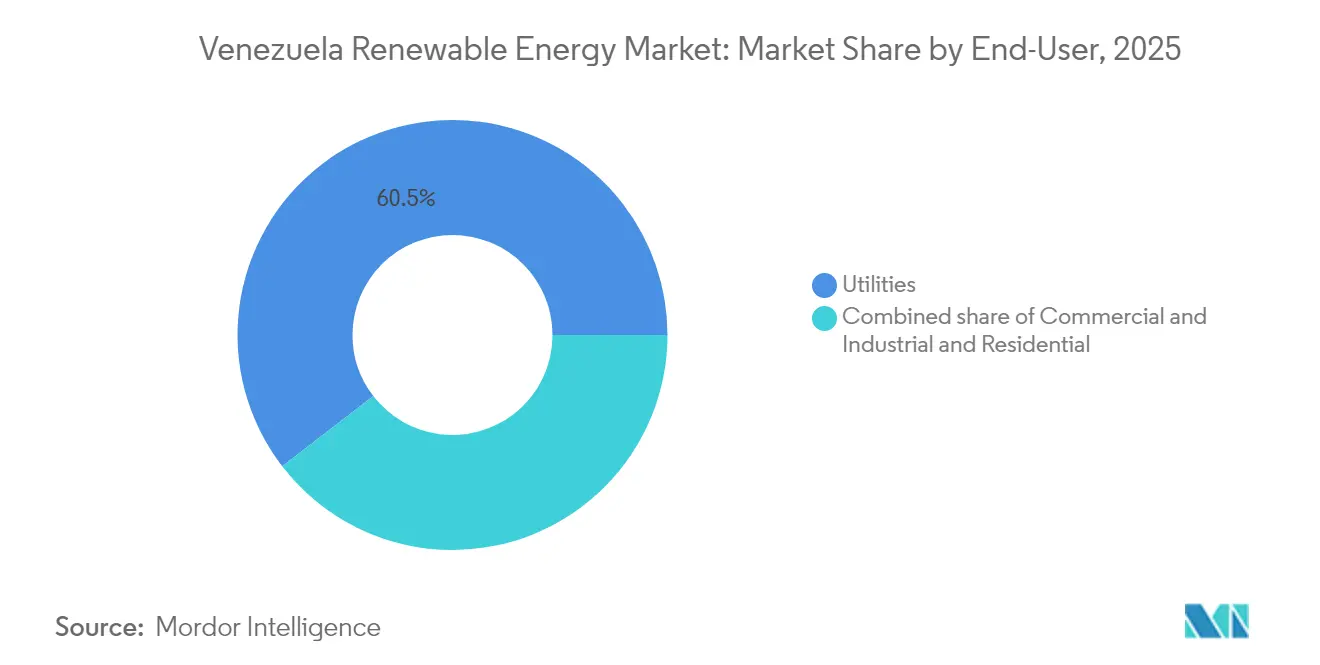
- By end-user, utilities accounted for 60.45% of capacity in 2025 and are projected to advance at an 8.55% CAGR to 2031, outpacing the overall Venezuela renewable energy market.
- By geography, the Andes region, led by Mérida, is set to host the first 50 MW phase of the 3 GW solar build-out, while the northwest retains 45 MW of newly commissioned wind assets.
Note: Market size and forecast figures in this report are generated using Mordor Intelligence’s proprietary estimation framework, updated with the latest available data and insights as of 2026.
Venezuela Renewable Energy Market Trends and Insights
Drivers Impact Analysis*
| Driver | (~) % Impact on CAGR Forecast | Geographic Relevance | Impact Timeline |
|---|---|---|---|
| Government 3 GW Andes solar plan | +1.8% | Mérida, Táchira, Trujillo | Medium term (2-4 years) |
| Declining solar and wind LCOE | +1.2% | Nationwide | Short term (≤ 2 years) |
| Diaspora-financed rooftop kits | +0.6% | Caracas, Maracaibo, Valencia | Short term (≤ 2 years) |
| Rural “Sembrando Luz” reboot | +0.5% | Andean & Orinoco hinterlands | Long term (≥ 4 years) |
| COP29 multilateral pledge | +0.4% | National | Medium term (2-4 years) |
| Crypto-mining microgrids | +0.3% | Low-tariff and off-grid zones | Short term (≤ 2 years) |
| Source: Mordor Intelligence | |||
Government Solar Build-out Plan (3 GW Andes Initiative)
The administration’s Andes roadmap targets 3 GW of photovoltaic capacity across Táchira, Mérida, and Trujillo, leveraging 5.5–6.2 kWh/m²/day of irradiation and natural panel cooling at high altitude.[1]BNamericas Editors, “Venezuela Approves 3 GW Andes Solar Parks,” bnamericas.comTwo Santo Domingo solar parks have obtained construction clearance, marking the first concrete step toward reducing dependency on hydroelectric power. Locational advantages include lower transmission losses to the Maracaibo and Barquisimeto industrial corridors and reduced flooding risk relative to lowland hydro dams. Execution risk remains material given the country’s track record of stalled wind assets and unclear permitting rules. Accessing multilateral finance will hinge on carving out sanction-proof structures and rebuilding domestic engineering capacity, which has been drained by emigration.
Declining Levelized Cost of Energy (LCOE)
Global solar LCOE fell 88% over the past decade, while onshore wind dropped 68%, narrowing Venezuela’s competitiveness gap despite its subsidized USD 0.20/kWh retail tariff.[2]IRENA Staff, “Renewable Power Generation Costs 2024,” irena.org Feasibility studies for mini-hydro projects reported internal rates of return above 280% even under capital scarcity, signaling similar upside for solar and wind when deployed in captive or export-linked formats. The most lucrative targets are remote mines and agro-industrial sites, which are now paying USD-denominated fuel premiums for diesel generators. Conversely, grid-connected utility plants struggle to recoup capital under fixed tariffs unless they secure soft loans or concessional climate funds. Aggregating projects under a pooled diaspora bond could cut financing costs and mitigate political risk premiums.
Diaspora-Financed Rooftop Kits
Venezuelans abroad remitted USD 5.4 billion in 2024, much of it routed through Zelle and Binance to purchase rooftop solar packages, which range from USD 1,000 for basic kits to USD 4,000 for full systems. Retailers offer turnkey delivery in USD or Bolivares, and the informal market for imported panels has proliferated in urban centers where extended power outages disrupt refrigeration, schooling, and telework. Households now represent the fastest-growing segment of the Venezuelan renewable energy market, although exact capacity additions remain outside any official dataset because energy statistics have not been published since 2016. The trend hinges on sustained remittance flows and continued access to duty-free Chinese hardware.[3]IPS News, “Grassroots Venezuelan Initiative Aims to Combat Electricity Crisis with Solar Energy,” ipsnews.net
Rural “Sembrando Luz” Reboot
First launched in 2005, the government’s flagship rural electrification scheme had only 60% of its solar kits operational by 2019, due to a scarcity of spare parts and training gaps. A 2022 relaunch by CORPOELEC Industrial aims for local assembly at the dormant Unerven plant, but no verifiable output figures have yet been reported. Success now depends on partnerships with community-level suppliers such as Ecosolaris and INGESOL, both of which have sales pipelines into remote Andes villages. If local manufacturing restarts, the initiative could increase renewable energy penetration in off-grid zones that currently rely on diesel generators trucked in at high costs.[4]CAF, “RED 2024,” scioteca.caf.com
Restraints Impact Analysis*
| Restraint | (~) % Impact on CAGR Forecast | Geographic Relevance | Impact Timeline |
|---|---|---|---|
| Grid unreliability & hydro dependency | -1.4% | Nationwide, acute in east and islands | Short term (≤ 2 years) |
| Price-controlled tariffs | -0.9% | Nationwide | Medium term (2-4 years) |
| U.S. sanctions on equipment finance | -0.7% | Nationwide | Long term (≥ 4 years) |
| Brain-drain in the power workforce | -0.5% | Caracas, Maracaibo | Medium term (2-4 years) |
| Source: Mordor Intelligence | |||
Grid Unreliability and Hydro Dependency
The 10,200 MW Guri Dam still supplies 73% of national electricity, making it a single-point vulnerability. Reservoirs reached their bottom limits in March 2024, forcing hydroelectric output to 47% capacity and leaving thermal units at just 6%. Average daily blackouts reached 200 events last year, with eastern Venezuela and Margarita Island facing the longest interruptions. Without major transmission upgrades or grid-scale storage, any surge in variable renewable energy sources will face curtailment risk. The Tocoma Dam’s 2,700 MW expansion, due in 2026, may stabilize baseload supply for a time, but it also deepens hydro dependence in the Venezuelan renewable energy market.
Price-Controlled Tariffs
Tariffs rose to USD 111.81/MWh in 2024, yet they remain disconnected from cost reality, providing little incentive for private capital. CORPOELEC retains generation exclusivity under legislation that requires at least 60% state ownership in joint ventures. Utility-scale investors, therefore, cannot secure predictable cash flows through feed-in tariffs or PPAs, and the draft renewable energy bill remains stalled in parliament. The result is a financing vacuum despite regional examples: Brazil’s 2024 solar auction cleared at USD 20.37/MWh, well below Venezuela’s regulated price ceiling.
*Our forecasts treat driver/restraint impacts as directional, not additive. The impact forecasts reflect baseline growth, mix effects, and variable interactions.
Segment Analysis
By Technology: Hydropower Dominates While Solar Accelerates
Hydropower supplied 99.15% of the installed capacity in 2025 and is expected to expand further when the 2,700 MW Tocoma plant comes online in 2026; however, it also perpetuates outage risk by concentrating generation in a single river basin. Solar’s exceptional 133.7% CAGR projection means that photovoltaic volume could surpass 600 MW by 2031, driven largely by the 3 GW Andes initiative and a retail wave of rooftop kits. The Venezuela renewable energy market share held by wind rose marginally in July 2024, when the 45 MW Paraguaná farm began exporting power; however, grid bottlenecks in Falcón and Zulia keep additional wind pipelines dormant. Bioenergy, geothermal, and ocean technologies remain at the concept stage with no announced funding.
A widening gap in LCOE accelerates the shift. Solar modules now land duty-paid at USD 0.12/W, providing residential buyers with a payback period of less than four years when blackout avoidance is factored in. Hydropower, by contrast, faces rising maintenance costs and climate-driven inflow volatility. Even so, the Venezuela renewable energy market size tied to hydro could still add 200–300 MW of small run-of-river schemes if project finance emerges from Chinese or Andean development funds. Wind expansion hinges on a clear tariff pathway and new 230 kV transmission spurs, neither of which appears in the 2025 national budget. The technology mix, therefore, appears poised for a bifurcated profile: entrenched megadams in state hands and nimble solar installations on rooftops, farms, and microgrids.




By End-User: Utilities Rule, Households Leapfrog
Utilities controlled 60.45% of installed renewable capacity in 2025, and their holdings are forecast to grow at an 8.55% CAGR by 2031 as the state accelerates the Andes solar portfolio and completes the Tocoma dam. Commercial and industrial consumers remain hesitant; restrictive joint-venture rules and opaque permitting for self-generation exceeding 2 MW keep the C&I pipeline thin. By contrast, households relying on remittances are embracing rooftop PV as a means of survival against potential grid collapse. Retailers report year-on-year unit sales growth above 90% in 2024, enough to lift residential systems to roughly 4% of the Venezuela renewable energy market size by the decade’s close.
The utilities’ advantage rests on scale and sovereign credit, yet they must modernize controls and integrate battery storage to manage higher solar penetration. C&I players will likely stay on the sidelines until the Renewable and Alternative Energy Bill passes and clarifies PPA rules. For now, residential kits bypass all formal channels: installers accept payment in Bolivares, USD, or stablecoins, and no grid connection permit is required for systems under 5 kW. This informal surge poses a revenue challenge to CORPOELEC but simultaneously injects resilience into urban load centers.
Geography Analysis
Development patterns follow both natural resource gradients and administrative priorities. The Andean corridor, including Táchira, Mérida, and Trujillo, enjoys an average global horizontal irradiation of 2,300 kWh/m²/year and thus anchors the 3 GW solar plan. Proximity to Colombia’s Norte de Santander unlocks cross-border wheeling options that can fetch unsubsidized tariffs up to USD 0.10/kWh, improving project economics. Falcón State’s Paraguaná Peninsula offers class-II wind speeds approaching 8 m/s, yet its 100 MW farm languishes due to spare parts shortages. Rehabilitation would only require USD 45 million, less than half the cost of new-build steel, making it a prime candidate for climate-bond refinancing. Zulia, Táchira, and Mérida also host the densest cluster of Sembrando Luz microgrids, underscoring rural demand for decentralized supply.
Hydro capacity remains geographically concentrated along the Caroní River in Bolívar state, exposing national supply to localized drought risk. Transmission lines traverse 1,000 km to Caracas, losing an estimated 14% of their energy through technical and non-technical factors; therefore, any incremental Andes solar cuts those losses markedly. Caracas, Valencia, and Maracaibo metropolitan areas experience the highest outage rates, prompting factories to adopt rooftop arrays sized at 15–50 kW. Lithium battery storage gains traction in these cities because payback accelerates when blackouts exceed eight hours per week.
The Amazon Territory hosts small demonstration solar villages dating to 1981; scaling them has proven challenging because river transport raises logistics costs by 30%. Yet the region’s clear-sky index tops 0.83, suggesting that modern thin-film modules could outperform conventional panels by 4–6 percentage points. Coastal Isla de Margarita limits solar build-out due to tourism-driven land-use conflicts, though floating PV on Laguna de La Restinga is under prefeasibility review. Overall, geospatial diversification can simultaneously bolster resilience, unlock export routes, and spread investment across neglected provinces, if finance and skills migrate alongside modules and turbines.
Regulatory Landscape
Venezuela's power sector remains governed by the Ley Organica del Sistema y Servicio Electrico, under which the state retains control over core electricity activities and CORPOELEC dominates dispatch and system operations. Oversight sits with the Ministerio del Poder Popular para la Energia Electrica (MPPEE), shaping permitting, grid access, and operational rules in a market where regulated tariffs and state ownership constraints have limited bankable private renewable projects.
In May 2026, the Asamblea Nacional signaled progress on a proposed Organic Law for Electric Service intended to incorporate alternative energy sources and diversify generation, indicating an active legislative track to widen participation beyond the state-led model. The reform direction is clearer, but detailed secondary regulation for tariffs, technical standards, and renewable-specific commercial frameworks is still being developed, so execution and bankability will depend on how the measures are operationalized.
Competitive Landscape
Competitive intensity is shaped more by policy and sanctions than by pure technology race. State-owned CORPOELEC controls generation dispatch and owns most of the hydro assets, effectively granting it a 60-65% share of the overall installed capacity. Siemens Gamesa, Andritz, ABB, and Huawei supply turbines, control systems, and inverters, but must structure contracts around sanctions-compliant intermediaries. Delayed payments and logistics hurdles prompt vendors to demand higher advance deposits, which can inflate project costs by 8 to 12%. Local EPC firms, including Ingelectra, CANARAGUA, and Elecven, specialize in balance-of-plant works and often partner with Cuban or Chinese technical crews because domestic labor pools have become depleted.
Strategic moves focus on niches that are immune to tariff caps. In June 2024, Zelestra announced a EUR 5 billion regional expansion plan anchored in photovoltaic, storage, and green hydrogen ventures, earmarking 200 MW for Venezuelan industrial off-takers. In August 2024, Scala Data Centers invested in wind self-supply to power its modular server farm outside Caracas, signaling a foreign appetite for projects that combine energy with digital infrastructure. On the public side, the January 2025 approval of a run-of-river hydroelectric project on the Guayuriba River diversifies hydroelectric power away from the Caroní basin and invites small-turbine manufacturers into the supply chain.
Competitive differentiation is increasingly hinging on financing ingenuity rather than hardware specifications. Firms that assemble diaspora crowdfunding, carbon credits, and multilateral guarantees can unlock blended rates below 6%, compared to 12-15% for fully commercial loans. Storage integrators that guarantee a four-hour duration within tropical temperature limits secure premium margins because they directly address the blackout pain point. Hybrid EPC-O&M players bundle long-term maintenance under peso-indexed contracts, mitigating currency mismatch. As regulatory clarity improves, incumbents will need to pivot from pure equipment leasing toward service-oriented models that embed performance guarantees.
Venezuela Renewable Energy Industry Leaders
SOLINAL C.A.
INGESOL C.A.
Siemens Gamesa Renewable Energy, S.A.
Andritz AG
Corpoelec (National Electric Corporation)
- *Disclaimer: Major Players sorted in no particular order

Market Opportunities and Future Outlook
Utility-scale solar execution in the Andes and western states creates near-term whitespace for EPC, BOS suppliers, and storage integrators that can work within Venezuela's logistics and grid constraints. The available project signals are specific: in January 2026, national authorities inspected progress on the 50 MW El Vigia solar farm in Merida, and in April 2026, government reporting in Zulia indicated the Machango photovoltaic solar park in Valmore Rodriguez reached 70% construction progress. These builds support demand for inverters, mounting structures, transformers, SCADA, and O&M services, especially in locations where weak transmission favors hybrid solar plus batteries and localized control.
A second opportunity track centers on market formalization and investment structures tied to legislative reform. In June 2026, the National Assembly preliminarily approved a reform to the Organic Law of the National Electricity System and Service to incorporate private participation across generation, transmission, distribution, and commercialization. Public reporting on the draft framework includes a concession approach and an option of tax exemptions for renewable-focused projects. If implemented with grid-access and tariff methodologies that can be banked, the change would support captive C&I microgrids, retrofit and rehabilitation of stalled wind assets in Falcón and Zulia, and offshore wind prospecting (with widely cited national potential), building on existing coastal industrial capabilities, while distributed solar demand remains reinforced by outages and USD-linked purchasing channels.
Recent Industry Developments
- June 2026: Venezuela's National Assembly preliminarily approved a reform to the Organic Law of the National Electricity System and Service to allow private sector participation across generation, transmission, distribution, and commercialization. The draft framework discussed in public reporting includes a shift toward tariff-setting aligned to real costs and allows tax exemptions for renewable-focused projects, signaling a potential change in how projects are contracted and financed.
- July 2025: Zelestra pledged a EUR 5 billion regional investment program across Latin America spanning photovoltaics, storage, and green hydrogen, and indicated an allocation for microgrid-related initiatives in Venezuela. The commitment helps validate a commercial lane for distributed and behind-the-meter renewables where grid reliability and conventional project finance remain constrained.
- July 2024: BP and Trinidad and Tobago's National Gas Company (NGC) secured a 20-year license for the Cocuina-Manakin cross-border gas field from the governments of Trinidad and Tobago and Venezuela. While gas is not a renewable source, the move influences Venezuela's power balance and investment attention, shaping the near-term context for renewables competing against or complementing gas-backed supply in reliability-focused projects.


Research Methodology Framework and Report Scope
Market Definition and Coverage
For this market, we size Venezuela's renewable energy sector using installed renewable power capacity that is operating in the country, measured in gigawatts (GW). The scope covers renewable technologies used to generate electricity and is treated as a capacity market, not a revenue market.
Scope exclusions: It excludes fossil-based generation, transmission and distribution networks, and general power trading revenues that are not directly tied to renewable capacity.
Segmentation Overview
- By Technology
- Solar Energy (PV and CSP)
- Wind Energy (Onshore and Offshore)
- Hydropower (Small, Large, PSH)
- Bioenergy
- Geothermal
- Ocean Energy (Tidal and Wave)
- By End-User
- Utilities
- Commercial and Industrial
- Residential
Data Sources, Market Sizing, and Validation
Desk Research
Desk research set the factual base for capacity build and the demand signals that explain why additions happen. We used public energy statistics and planning references such as IRENA renewable capacity data, International Energy Agency country energy balances, and World Bank macro indicators to anchor the scale and the timing of investments.
To avoid relying on a single lens, we also read supply-side and policy signals from sources such as official government gazettes and energy ministry releases, and national utility and system operator publications where available. Open academic papers helped with hydropower availability and renewable integration constraints. In parallel, company filings, investor presentations, reputable press, and paid subscriptions for company financials and news were used to confirm project milestones, ownership changes, and commissioning timelines. These examples are illustrative, and we checked many other public sources for data collection, validation, and clarification.
Primary Interviews and Surveys
We consult Venezuelan utilities, project developers, equipment distributors, regulators, and large energy users through expert interviews and surveys. Respondents help clarify capacity additions, operating status, project timing, and cost assumptions in Venezuela, while their input helps fill gaps in public records and reconcile differences.
Distribution of primary research fieldwork respondents
| Company type | Respondent position |
|---|---|
| Top tier: 27% | CXOs: 15% |
| Mid tier: 48% | Functional/Unit leaders: 29% |
| Smaller Players: 25% | Managers: 56% |
Market-Sizing & Forecasting
Sizing followed a top-down and bottom-up workflow so the approach stays consistent and repeatable. First, national renewable capacity totals were reconstructed by technology using publicly visible capacity series and project commissioning notes. The totals were then checked using a bottom-up approximation built from a sampled project list and typical capacity additions by year.
Inputs that moved the model were selected because they show up consistently in Venezuela's power context. Hydropower availability and reservoir constraints were treated as a swing factor, since they influence how urgently non-hydro additions are pursued. We also tracked the pipeline of announced solar and wind projects, filtered by permitting readiness and grid connection feasibility before counting them. In addition, we monitored indicative capex trends for utility-scale solar and wind, grid stability constraints that can slow new intermittent capacity, and the split of additions expected to be utility-led versus C&I and residential (where growth can be lumpy).
For forecasting, scenario analysis was used because timing risk is high and project movement often happens in steps rather than smoothly. Base, conservative, and accelerated paths were built around commissioning probability, hydrology stress periods, and policy execution signals, and then the final path was selected after expert feedback confirmed which assumptions were realistic for the next five years. Where bottom-up project information was incomplete, gaps were handled through technology-level addition rates tied to historic build patterns and adjusted for current pipeline quality.
Data Validation & Update Cycle
Validation was done through cross-checks that compare the model output against independent signals, and then any variance was investigated before the numbers were locked. Capacity totals by technology were checked against multiple public series, and unusual jumps were traced back to specific project events, reclassification, or timing shifts.
Before sign-off, the build and forecast logic goes through a multi-step analyst review, including reasonableness checks on annual additions and technology shares. If a major variance appears, or if a new project is commissioned, delayed, or canceled, we trigger a re-contact with sources and update the assumptions. Reports are refreshed annually, and material events can lead to interim updates, followed by a final pre-delivery review so clients receive the latest view.
Mordor Intelligence's Venezuela Renewable Energy Market Size Versus Other Published Estimates
It is normal to see different market sizes for Venezuela renewable energy because publishers do not always measure the same thing. Some report capacity, others report revenues, and a few use electricity generation, which naturally pushes the numbers in different directions.
Installed capacity series, technology-level capacity shares, and project commissioning checks are the evidence points that keep Mordor Intelligence's estimate tied to operating renewable assets in gigawatts, rather than mixing in equipment revenues or electricity output proxies.
Benchmark comparison
| Source | Market Size | Gaps in Research Methodology |
|---|---|---|
| Mordor Intelligence | USD 18.67 B (2025) | |
| Global Consultancy A | USD 1.23 B (2024) | This figure is value-based in USD and tends to reflect spend or revenue pools across applications, so it will not align with a capacity-in-GW definition and can compress the apparent market size in early build years. |
| Trade Journal B | USD 0.02 B (2028) | This estimate is built on renewable electricity generation in TWh, which is an output metric influenced by hydrology and utilization, so it should not be read as installed capacity or investment value. |
The spread in published numbers mainly comes from mixing units rather than a small rounding difference. Once the scope is kept consistent and each technology is counted only when it is operating capacity, the market size becomes easier to trace and to update when new commissioning events occur.


Key Questions Answered in the Report
How large will installed renewable capacity be in Venezuela by 2031?
The Venezuela renewable energy market is forecast to reach 25.79 GW of installed capacity by 2031, up from 18.67 GW in 2025.
Which renewable technology is expanding the fastest?
Solar photovoltaics are projected to grow at a 133.7% CAGR between 2026 and 2031, far outpacing hydropower and wind additions.
Why are rooftop solar systems spreading so quickly?
Frequent blackouts and diaspora-financed remittances allow households to buy turnkey kits priced at USD 1,0004,000, giving them reliable power without depending on the state grid.
What is the government's main utility-scale solar project?
The 3 GW Andes initiative, beginning with a 50 MW farm in Mérida contracted to a Chinese EPC in January 2025, is the flagship program.
How do U.S. sanctions affect renewable growth?
Sanctions limit access to Western export finance and multilateral loans, so most large projects now rely on Chinese suppliers and RMB-linked credit lines.
Which regions see the heaviest renewable build-out?
The Andes region leads utility-scale solar, while the northwest hosts Venezuela's only wind farm; major cities drive rooftop adoption.
Page last updated on:





