Vehicle Emission Standards And Impact Analysis Market Size and Share
Market Overview
| Study Period | 2019 - 2030 |
|---|---|
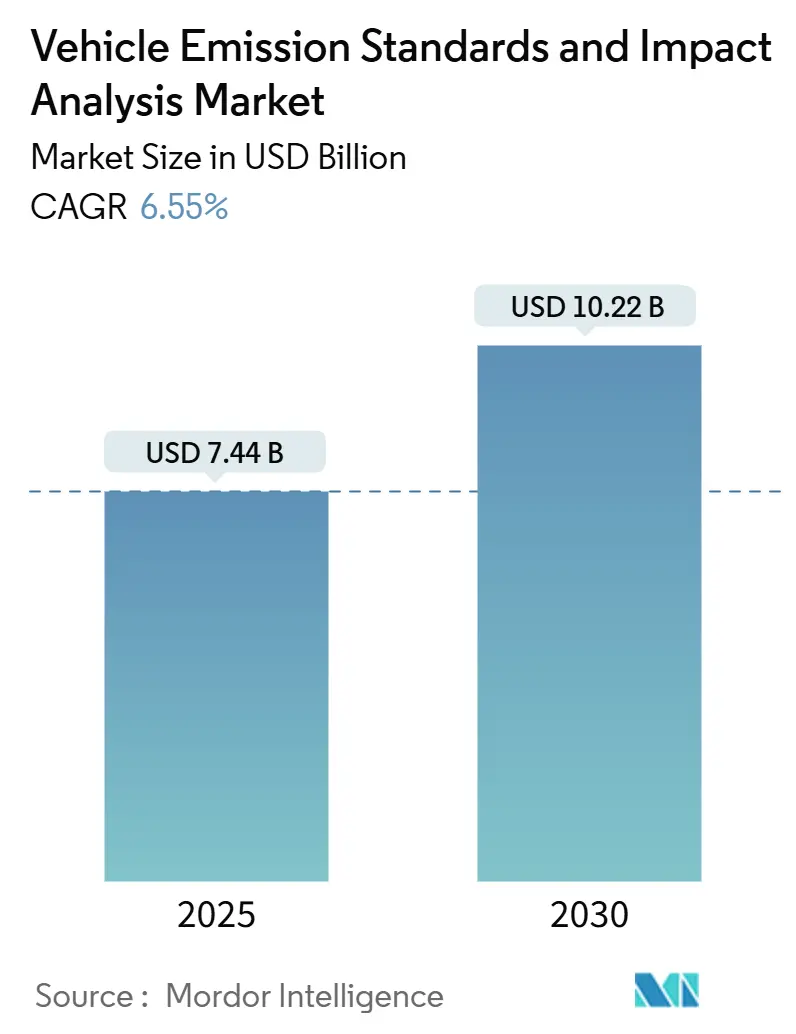
| Market Size (2025) | USD 7.44 Billion |
| Market Size (2030) | USD 10.22 Billion |
| Growth Rate (2025 - 2030) | 6.55% CAGR |
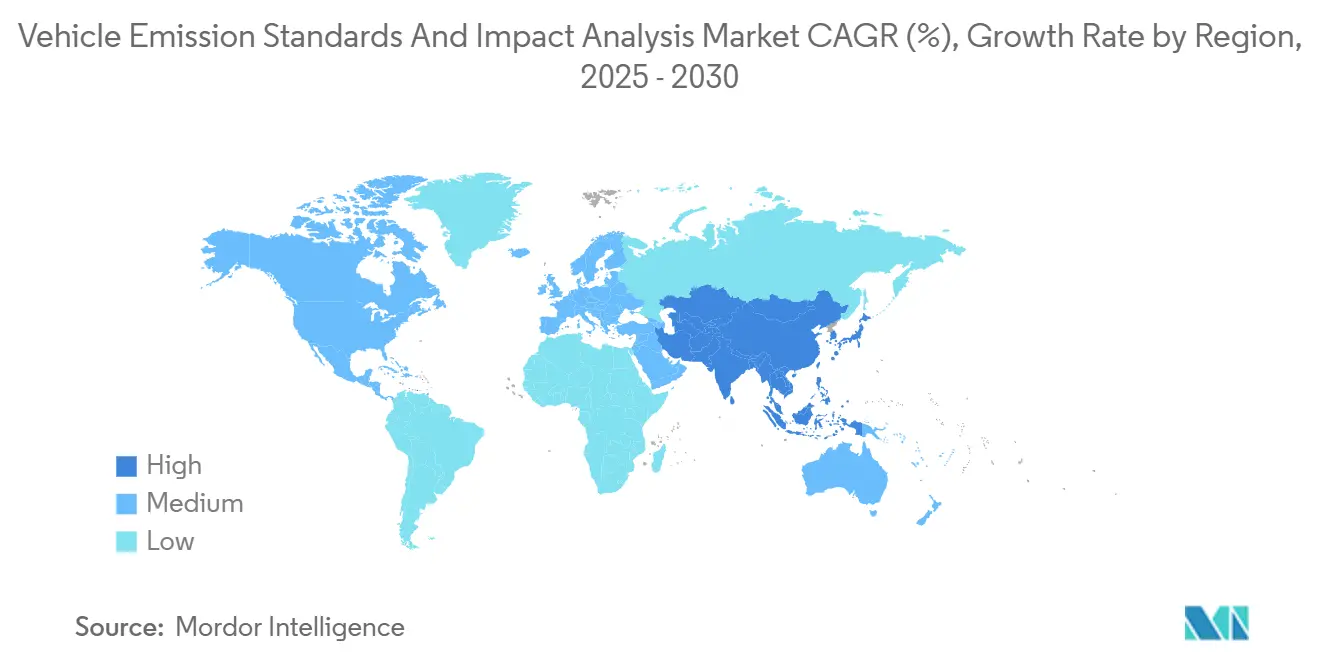
| Fastest Growing Market | Asia Pacific |
| Largest Market | Europe |
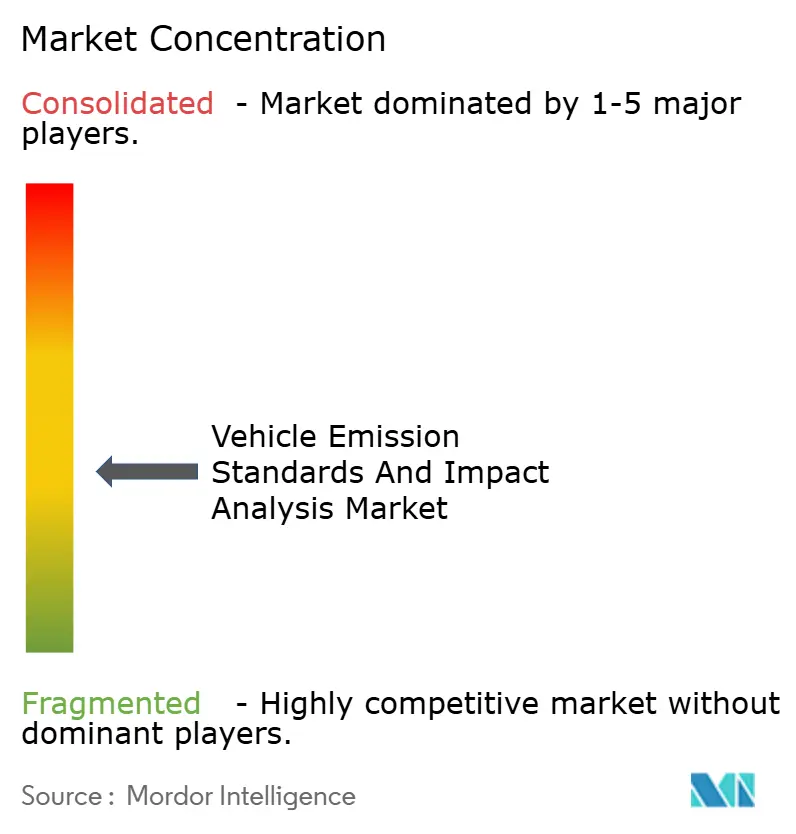
| Market Concentration | Medium |
Major Players *Disclaimer: Major Players sorted in no particular order Image © Mordor Intelligence. Reuse requires attribution under CC BY 4.0. | |
Vehicle Emission Standards And Impact Analysis Market Analysis by Mordor Intelligence
The Vehicle Emission Standards and Impact Analysis market size is USD 7.44 billion in 2025 and it is forecast to reach USD 10.22 billion in 2030, advancing at a 6.55% CAGR over the period. Regulatory convergence across the European Union, China, North America and Australia is tightening compliance thresholds, forcing manufacturers to overhaul testing protocols and fuelling sustained demand for outsourced inspection and certification services. The Vehicle Emission Standards and Impact Analysis market also benefits from the rapid electrification of vehicle fleets, which requires new battery-durability and electromagnetic-compatibility assessments alongside conventional exhaust tests. Asia-Pacific is on track to be the fastest-growing region as India’s electric three-wheeler boom deepens and China rolls out China 7 limits. Competitive differentiation is shifting toward providers that can combine portable emissions measurement systems with real-time, AI-enabled analytics. At the same time, capital-intensive laboratories remain essential for certifying heavy-duty and particulate emissions.
Key Report Takeaways
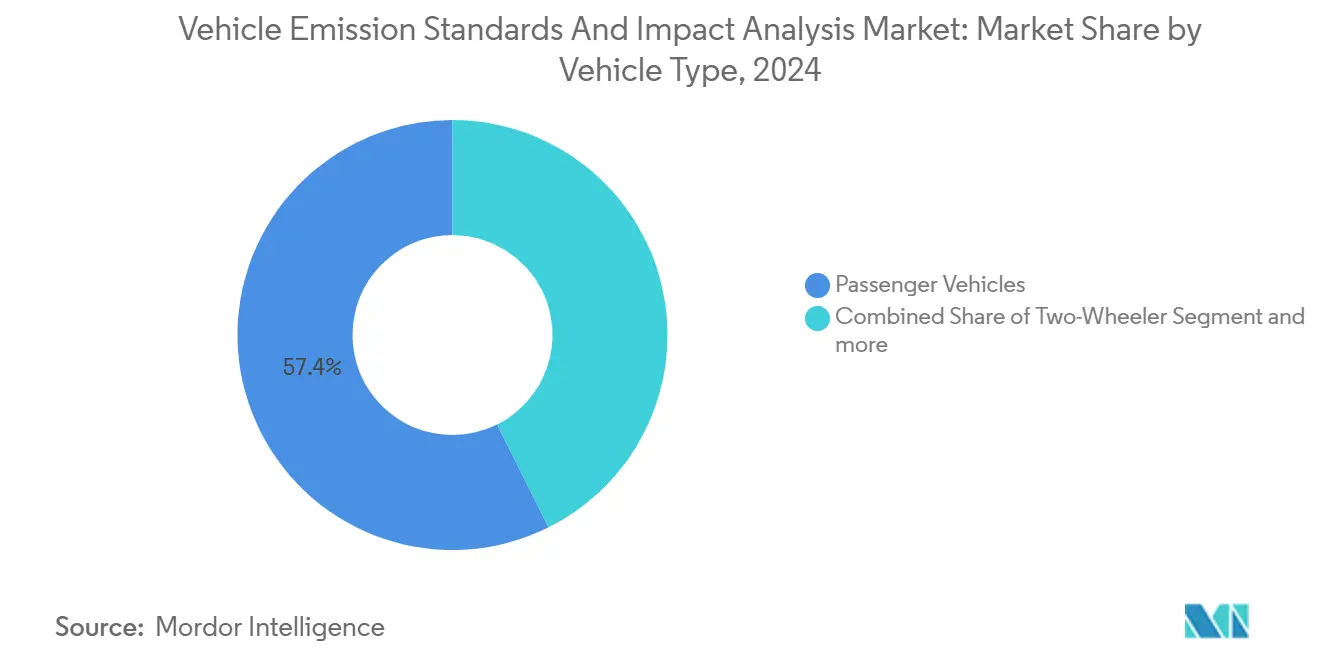
- By vehicle type, passenger cars held 57.42% of the Vehicle Emission Standards and Impact Analysis market share in 2024, while three-wheelers posted the highest projected CAGR at 7.37% through 2030.
- By propulsion type, internal-combustion vehicles retained 73.47% of the Vehicle Emission Standards and Impact Analysis market size in 2024 and battery-electric vehicles are poised to expand at an 8.48% CAGR to 2030.
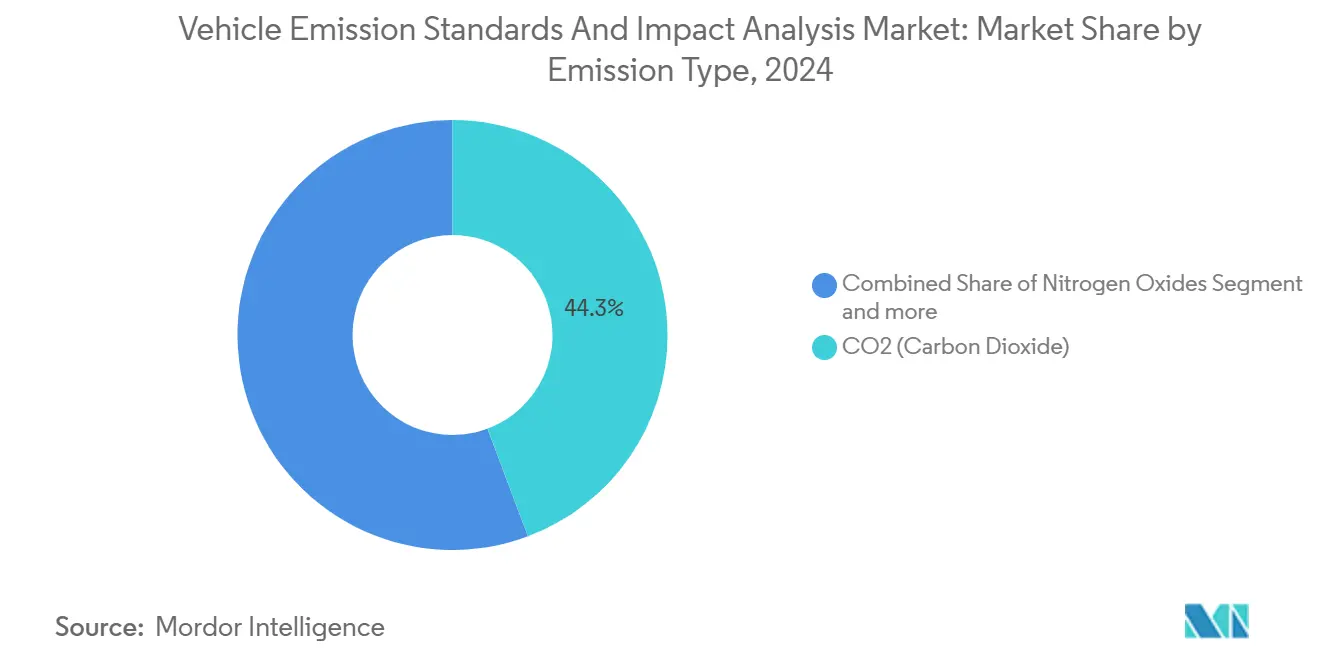
- By emission type, CO₂ testing dominated, with a 44.29% share of the Vehicle Emission Standards and Impact Analysis market in 2024; hydrocarbon testing is forecast to grow the fastest, at a 9.35% CAGR.
- By end-user, OEMs accounted for 46.37% of the Vehicle Emission Standards and Impact Analysis market share in 2024, whereas independent laboratories are projected to record the strongest growth at 8.83% CAGR.
- By geography, Europe led with 34.28% of the Vehicle Emission Standards and Impact Analysis market share in 2024; Asia-Pacific shows the highest regional CAGR at 9.28% through 2030.
Global Vehicle Emission Standards And Impact Analysis Market Trends and Insights
Drivers Impact Analysis*
| Driver | (~) % Impact on CAGR Forecast | Geographic Relevance | Impact Timeline |
|---|---|---|---|
| Stricter Global Emission Standards | +1.8% | EU, China, North America | Medium term (2-4 years) |
| Electric & Hybrid Vehicle Surge | +1.2% | APAC, North America | Long term (≥ 4 years) |
| Government Incentives | +0.9% | North America, EU, APAC | Short term (≤ 2 years) |
| Outsourcing of TIC Services | +0.7% | Global manufacturing hubs | Medium term (2-4 years) |
| AI-Driven Remote Sensing | +0.6% | Initially developed markets | Long term (≥ 4 years) |
| Expansion of Low-Emission Zones | +0.5% | EU core cities | Medium term (2-4 years) |
| Source: Mordor Intelligence | |||
Stricter Global Emission Standards Drive Market Transformation
Euro 7, effective November 2026, extends durability verification to 8 years/160,000 km and introduces brake- and tire-particle limits, intensifying demand for full-spectrum testing [1]“Euro 7 Impact Assessment,” Publications Office of the European Union, europa.eu. China 7 mirrors this trajectory by building on the hydrocarbon-cutting success of China 6 [2]“China 6 and Beyond,” Lubrizol Corporation, lubrizol.com. The synchronized policy push compels OEMs to invest in unified protocols, sustaining long-term spending on specialist laboratories within the Vehicle Emission Standards and Impact Analysis market. Real-world testing with portable systems is now compulsory in most major jurisdictions, boosting equipment orders for PEMS suppliers. Providers with multi-pollutant capabilities are positioned to secure multi-year framework contracts from regulators and manufacturers.
Outsourcing Trends Reshape Competitive Dynamics
OEMs are trimming in-house labs to cut capital costs and mitigate multi-jurisdiction complexity. SGS has expanded multi-lane vehicle inspection stations across Europe and Latin America to absorb overflow testing. The outsourcing model allows service providers to amortize a USD 3-5 million dynamometer over higher utilization, translating to competitive pricing. As the Vehicle Emission Standards and Impact Analysis market matures, specialized labs are forging long-term master service agreements that secure volume visibility and underpin further capacity investments.
AI Integration Transforms Emissions Monitoring Capabilities
Machine-learning algorithms embedded in satellite platforms such as MethaneSAT improve methane detection accuracy by almost 2X in comparison to legacy systems. On-road sensors now pair with AI models to correct for ambient variables, narrowing laboratory-to-road gaps. Early adopters inside the Vehicle Emission Standards and Impact Analysis market leverage AI dashboards to offer regulators rapid violation identification and compliance analytics, creating high-margin revenue streams.
Low-Emission Zones Expansion Creates Testing Demand
More than 300 European cities enforce or plan LEZs, cutting urban NO₂ by up to 45%[3]“LEZ Database,” Transport & Environment, transportenvironment.org. France added 42 zones in 2025 with bans on older diesel and petrol vehicles trans.info. Each LEZ requires periodic compliance proof, elevating demand for mass remote-sensing campaigns and roadside checks. Service providers able to mobilize mobile laboratories and PEMS fleets are scaling fastest within the Vehicle Emission Standards and Impact Analysis market.
Restraints Impact Analysis*
| Restraint | (~) % Impact on CAGR Forecast | Geographic Relevance | Impact Timeline |
|---|---|---|---|
| High Capital Cost of Equipment | -0.8% | Emerging markets hardest hit | Short term (≤ 2 years) |
| Complexity of Real-World Measurements | -0.6% | Global | Medium term (2-4 years) |
| Fragmented Data-Access Rules | -0.4% | EU, North America | Medium term (2-4 years) |
| Duplicate Tests from Non-Harmonized Rules | -0.3% | Multinational OEMs | Long term (≥ 4 years) |
| Source: Mordor Intelligence | |||
High Capital Investment Requirements Limit Market Entry
A compliant PEMS kit exceeds USD 200,000, while a full climatic chassis dyno surpasses USD 5 million, burdening small labs[4]“Portable Emissions Measurement Systems Fact Sheet,” U.S. Environmental Protection Agency, epa.gov. Large incumbents in the Vehicle Emission Standards and Impact Analysis market capitalize on scale, depreciating assets over vast testing volumes. New entrants struggle to secure financing in emerging markets where lending rates are high, slowing regional capacity build-out.
PEMS Technology Complexity Constrains Widespread Adoption
Scientific comparisons reveal particulate-matter variance above 20% between mini-PEMS and reference systems, mainly from calibration drift. This technical barrier forces many regulators to maintain dual lab- and road-based certification, inflating compliance costs and dampening service-provider margins. Therefore, the Vehicle Emission Standards and Impact Analysis market faces a learning curve before PEMS precision meets universal acceptance.
*Our forecasts treat driver/restraint impacts as directional, not additive. The impact forecasts reflect baseline growth, mix effects, and variable interactions.
Segment Analysis
By Vehicle Type: Passenger Cars Retain Dominance Amid Three-Wheeler Upswing
Passenger cars controlled 57.42% of the Vehicle Emission Standards and Impact Analysis market share in 2024, reflecting the high production volume subject to Euro 7, China 7 and EPA standards. Three-wheelers are the fastest-growing niche at a 7.37% CAGR, propelled by ~700,000 electric units sold in India in 2024. This electrification wave is compelling labs to adopt battery-test protocols alongside conventional exhaust analysis.
The Vehicle Emission Standards and Impact Analysis market size attached to passenger-car compliance remains the backbone revenue stream, yet specialty providers are now launching low-capacity dynamometers tailored to the lighter, three-wheeler class. Component suppliers for urban mobility fleets increasingly outsource validation to Indian and Southeast Asian labs, widening regional opportunity.


By Propulsion Type: ICE Volume Persists While BEV Growth Accelerates
Internal-combustion vehicles comprised 73.47% of the Vehicle Emission Standards and Impact Analysis market size in 2024, as global fleets remain largely gasoline or diesel. Battery-electric vehicles register the highest 8.48% CAGR as regulators set electrification targets. Hybrid models serve as a transitional category, requiring dual-mode evaluation.
Service providers are augmenting climate chambers and HV battery cyclers to address BEV and PHEV endurance mandates under Euro 7. At the same time, they cannot shutter combustion labs prematurely, because emerging markets continue to certify ICE models. Dual-infrastructure strategies are a commercial imperative in the Vehicle Emission Standards and Impact Analysis market.
By Emission Type: CO₂ Testing Dominates, Hydrocarbons Grow Fastest
Due to universal greenhouse-gas caps, CO₂ analysis commanded 44.29% of revenue in 2024. Hydrocarbon metrics are forecast at 9.35% CAGR as regulators tighten NMOG+NOx thresholds. The Vehicle Emission Standards and Impact Analysis industry must now incorporate brake- and tire-particle counters under Euro 7, expanding particulate-matter lab capacity.
Providers with multiplex analyzers that simultaneously capture CO₂, HC, NOx and PN achieve higher throughput and win bundled contracts. Labs without HC speciation capability risk marginalization as OEMs demand single-source solutions.
By End-Users: OEMs Lead Spending, Independent Labs Scale Fast
OEMs represented 46.37% of the Vehicle Emission Standards and Impact Analysis market share in 2024, outsourcing peak-load tests during model launches. Independent laboratories are projected at 8.83% CAGR as they absorb complex, multi-region homologation work. Regulatory agencies also contract third parties for enforcement audits, widening the client base.
The rise of master service agreements between Tier-1 labs and global automakers stabilizes revenue flows and encourages investments in AI analytics. Smaller regional labs target niche segments such as electric two-wheeler validation, diversifying the service ecosystem within the Vehicle Emission Standards and Impact Analysis market.
Geography Analysis
Europe retained 34.28% of global revenue in 2024, owing to the EU’s stringent Euro 7 framework and a network of more than 300 Low-Emission Zones that mandate continuous compliance verification. In 2025, France enforced new LEZ bans on older diesel and petrol cars across 42 cities, spurring incremental test demand. Providers such as DEKRA leveraged their established laboratory base and 32 million annual inspections to upsell particulate-number analytics, cementing regional leadership.
Asia-Pacific delivered the fastest 9.28% CAGR, fueled by India’s 700,000 electric three-wheelers sold in 2024 and China’s phased China 7 rollout economictimes.indiatimes.com. Bharat Stage VI compliance led to widespread adoption of PEMS audits, while government subsidies accelerated EV penetration, compelling labs to add battery-life simulation rigs. Multinational providers are partnering with local institutes in Thailand and Indonesia to bridge capacity gaps, expanding the Vehicle Emission Standards and Impact Analysis market footprint.
North America sustains demand through EPA multi-pollutant rules and California’s Heavy-Duty Omnibus regulation that slashes NOx by 90% for 2024-2026 engines arb.ca.gov. Canada’s CAD 5,000 rebates and several state-level ZEV mandates underpin electric-vehicle validation workloads, prompting test-chamber expansions in Ontario and Michigan. The region’s robust regulatory pipeline secures a stable revenue outlook for the Vehicle Emission Standards and Impact Analysis market over the forecast horizon.
Mordor Intelligence provides coverage of the vehicle emission standards and impact analysis market across other key regional markets, including Europe, each with their regulatory frameworks and demand patterns. Detailed country-level analysis extends to Japan and China incorporating local coverage and market participation, as required.

Competitive Landscape
The Vehicle Emission Standards and Impact Analysis market is moderately consolidated. SGS, Bureau Veritas, and DEKRA hold strong global positions, leveraging extensive laboratory networks and integrated inspection software to secure multi-year OEM contracts. Thirty-two million inspections underpin DEKRA’s growth, exemplifying scale economies. Mid-tier contenders such as TÜV SÜD cross-sell hydrogen-fuel testing and BlueHydrogen certification, diversifying revenue streams.
Technology leadership is emerging as a differentiator. Early adopters are integrating AI-enhanced remote sensing and satellite analytics for high-emitter detection, offering regulators real-time dashboards that shrink enforcement cycles. Partnerships like TÜV SÜD with SEGULA Technologies blend testing expertise and engineering design to provide turnkey market-entry packages for new EV models.
Capital intensity remains a barrier to new entrants; however, niche PEMS and battery-test equipment suppliers are carving opportunities by leasing gear to independent labs. Market incumbents continue to acquire regional specialists to augment capacity in high-growth areas like Southeast Asia, reinforcing competitive moats within the Vehicle Emission Standards and Impact Analysis market.
Vehicle Emission Standards And Impact Analysis Industry Leaders
SGS SA
Bureau Veritas
DEKRA SE
TÜV SÜD
TÜV Rheinland
- *Disclaimer: Major Players sorted in no particular order

Recent Industry Developments
- April 2025: The European Commission proposed mandatory hot-idle particle-number tests during periodic inspections and required remote sensing to flag high emitters.
- August 2024: Australia adopted Euro 6d-equivalent standards for light vehicles, aligning test cycles and lab procedures.


Global Vehicle Emission Standards And Impact Analysis Market Report Scope
| Two-Wheeler | |
| Three-Wheeler | |
| Passenger Cars | Hatchbacks |
| Sedans | |
| SUV & MUVs | |
| Commercial Vehicles | Light Commercial Vehicles |
| Medium & Heavy Commercial Vehicles | |
| Buses & Coaches |
| Internal-Combustion Engine Vehicles |
| Hybrid Electric Vehicles |
| Battery Electric Vehicles |
| CO2 (Carbon Dioxide) |
| NOx (Nitrogen Oxides) |
| PM (Particulate Matter) |
| HC (Hydrocarbons) |
| Others (CO, etc.) |
| Government Regulating Agencies |
| OEMs |
| Independent Testing Labs |
| North America | United States |
| Canada | |
| Rest of North America | |
| South America | Brazil |
| Argentina | |
| Rest of South America | |
| Europe | Germany |
| United Kingdom | |
| Spain | |
| Italy | |
| France | |
| Netherlands | |
| Rest of Europe | |
| Asia-Pacific | India |
| China | |
| Japan | |
| South Korea | |
| Indonesia | |
| Rest of Asia-Pacific | |
| Middle East & Africa | United Arab Emirates |
| Saudi Arabia | |
| Turkey | |
| Egypt | |
| South Africa | |
| Rest of Middle East & Africa |
| By Vehicle Type | Two-Wheeler | |
| Three-Wheeler | ||
| Passenger Cars | Hatchbacks | |
| Sedans | ||
| SUV & MUVs | ||
| Commercial Vehicles | Light Commercial Vehicles | |
| Medium & Heavy Commercial Vehicles | ||
| Buses & Coaches | ||
| By Propulsion Type | Internal-Combustion Engine Vehicles | |
| Hybrid Electric Vehicles | ||
| Battery Electric Vehicles | ||
| By Emission Type | CO2 (Carbon Dioxide) | |
| NOx (Nitrogen Oxides) | ||
| PM (Particulate Matter) | ||
| HC (Hydrocarbons) | ||
| Others (CO, etc.) | ||
| By End-Users | Government Regulating Agencies | |
| OEMs | ||
| Independent Testing Labs | ||
| By Geography | North America | United States |
| Canada | ||
| Rest of North America | ||
| South America | Brazil | |
| Argentina | ||
| Rest of South America | ||
| Europe | Germany | |
| United Kingdom | ||
| Spain | ||
| Italy | ||
| France | ||
| Netherlands | ||
| Rest of Europe | ||
| Asia-Pacific | India | |
| China | ||
| Japan | ||
| South Korea | ||
| Indonesia | ||
| Rest of Asia-Pacific | ||
| Middle East & Africa | United Arab Emirates | |
| Saudi Arabia | ||
| Turkey | ||
| Egypt | ||
| South Africa | ||
| Rest of Middle East & Africa | ||


Key Questions Answered in the Report
What is the projected value of the Vehicle Emission Standards and Impact Analysis market in 2030?
The market is forecast to reach USD 10.22 billion by 2030, reflecting a 6.55% CAGR.
Which region is expanding the fastest for emissions-testing services?
Asia-Pacific leads with a 9.28% CAGR, driven by India’s electric three-wheelers and China 7 standards.
Which vehicle segment shows the highest growth in testing demand?
Three-wheelers exhibit the steepest rise, registering a 7.37% CAGR through 2030.
How do Euro 7 standards influence testing requirements?
Euro 7 extends durability to 8 years/160,000 km and adds brake and tire particle limits, increasing full-spectrum lab workload.
Why are OEMs outsourcing more testing work?
Multi-jurisdiction complexity and the capital cost of advanced labs make external providers more cost-effective and flexible.
Page last updated on:


