Market Overview
| Study Period | 2020 - 2031 |
|---|---|
| Market Size (2026) | USD 8.07 Billion |
| Market Size (2031) | USD 11.23 Billion |
| Growth Rate (2026 - 2031) | 6.83% CAGR |
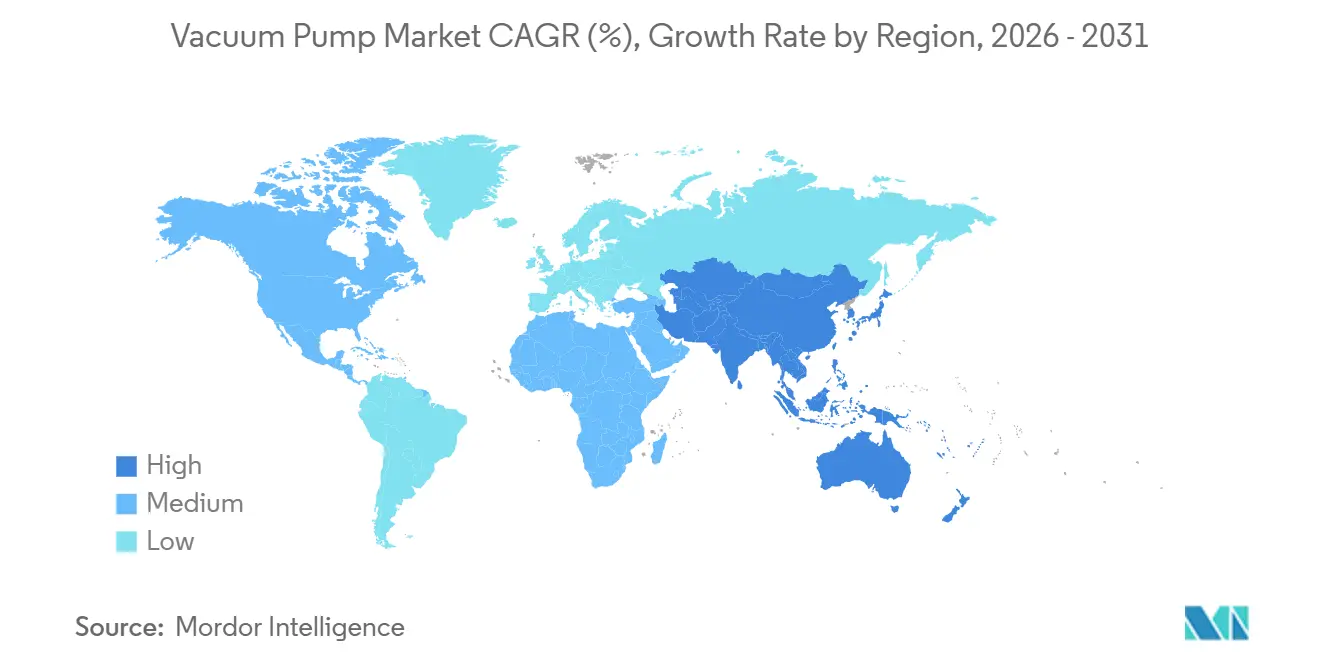
| Fastest Growing Market | Middle East |
| Largest Market | Asia Pacific |
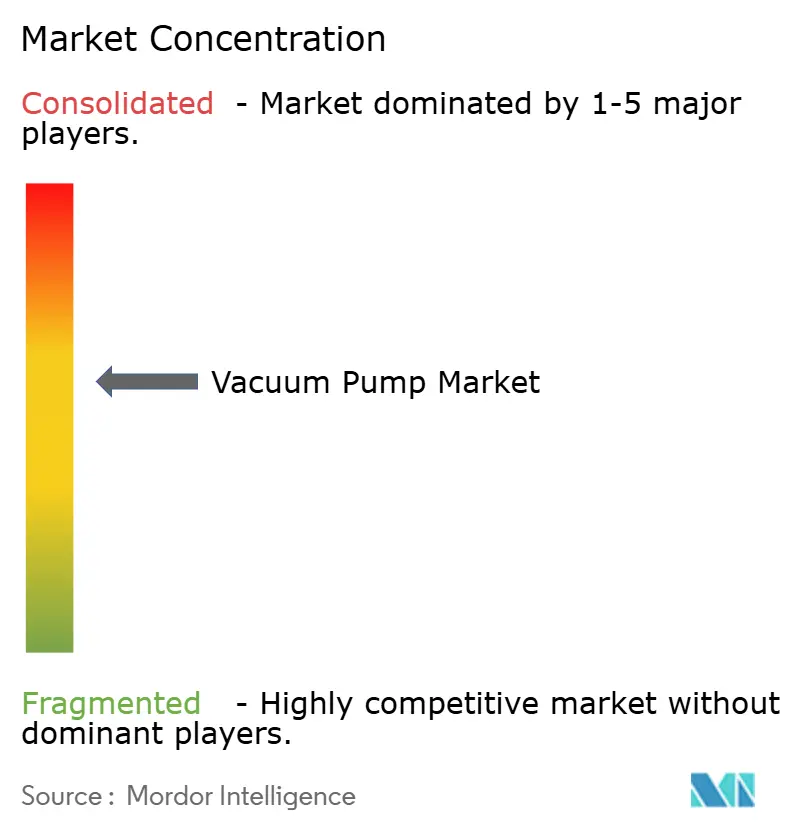
| Market Concentration | Medium |
Major Players *Disclaimer: Major Players sorted in no particular order Image © Mordor Intelligence. Reuse requires attribution under CC BY 4.0. | |
Vacuum Pump Market Analysis by Mordor Intelligence
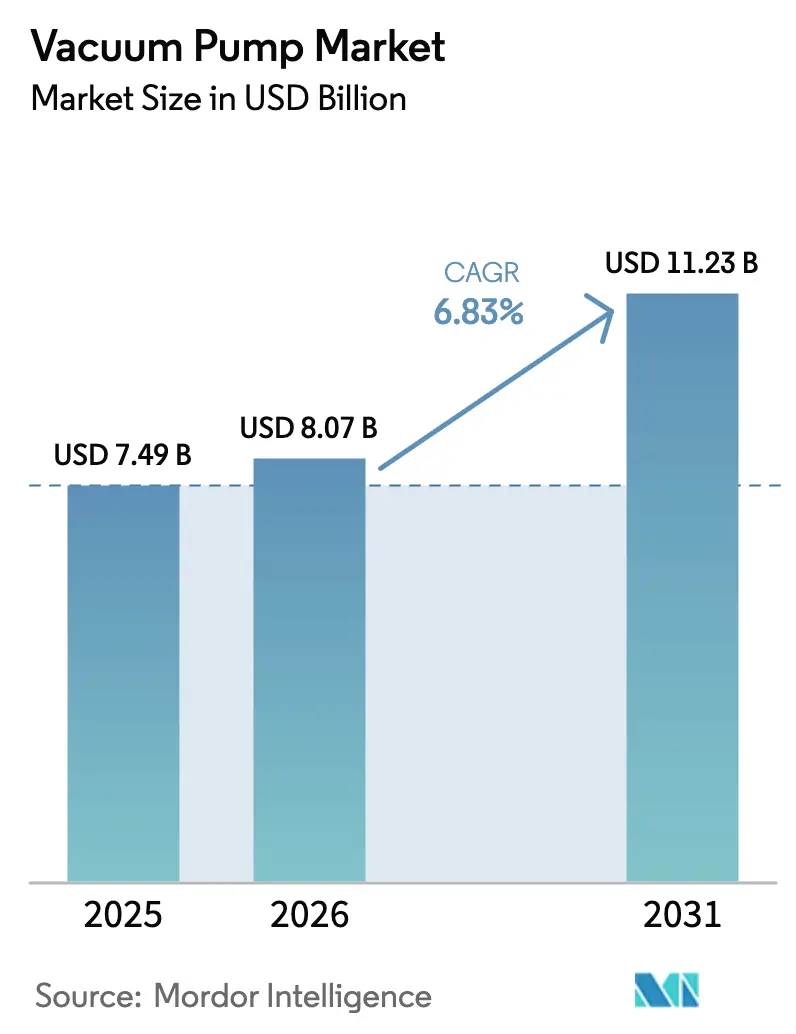
The vacuum pump market size is expected to grow from USD 7.49 billion in 2025 to USD 8.07 billion in 2026 and is forecast to reach USD 11.23 billion by 2031 at 6.83% CAGR over 2026-2031. Strong order momentum from semiconductor fabs, expanding liquefied natural gas (LNG) trains, and battery electrode coating lines underpins this growth trajectory. Mechanical architectures still dominate, but entrapment technologies are scaling quickly to support extreme-ultraviolet (EUV) lithography, quantum research, and fusion prototypes. Dry designs are displacing oil-sealed variants as per- and polyfluoroalkyl substances (PFAS) rules tighten in North America and Europe. Regionally, Asia Pacific retains leadership, yet the Middle East posts the fastest growth on the back of LNG megaprojects. Competitive focus centers on domestic manufacturing, predictive-maintenance software, and hydrogen-ready materials as buyers seek lower lifetime ownership costs.
Key Report Takeaways
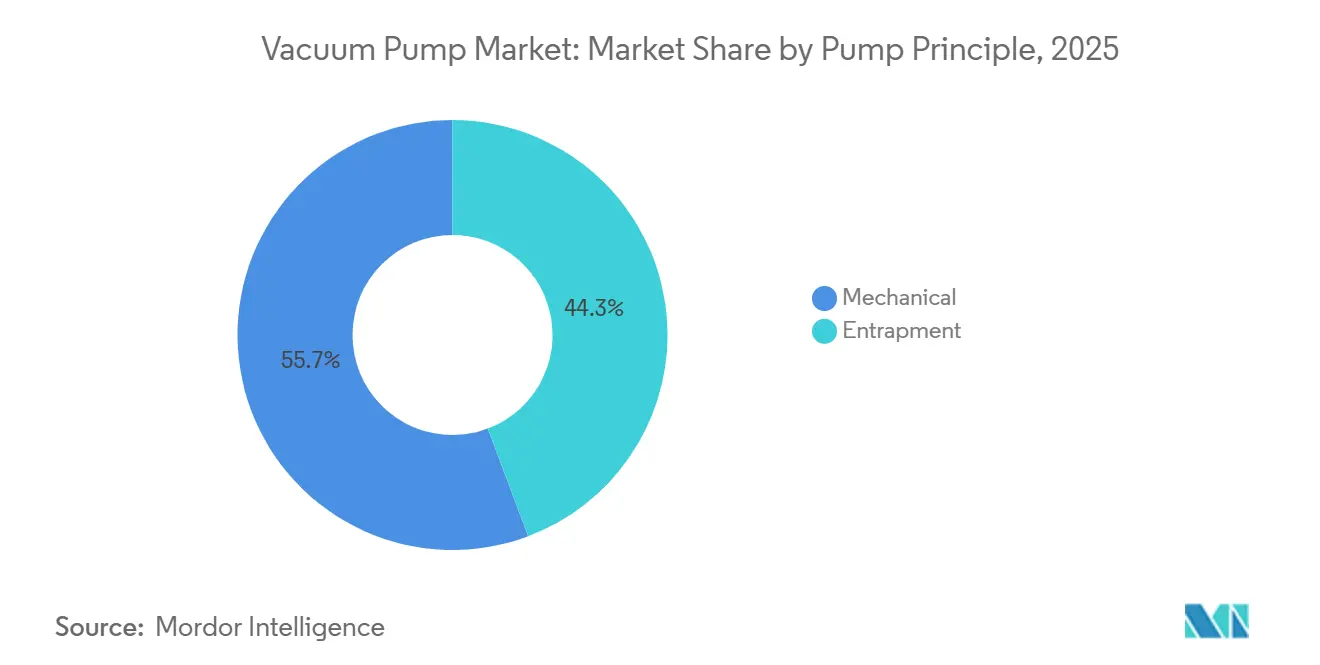
- By pump principle, mechanical designs held 55.74% of the vacuum pump market share in 2025, while entrapment architectures are forecast to expand at a 7.29% CAGR through 2031.
- By lubrication, dry vacuum pumps accounted for 64.89% of the vacuum pump market size in 2025 and are rising at a 7.23% CAGR to 2031.
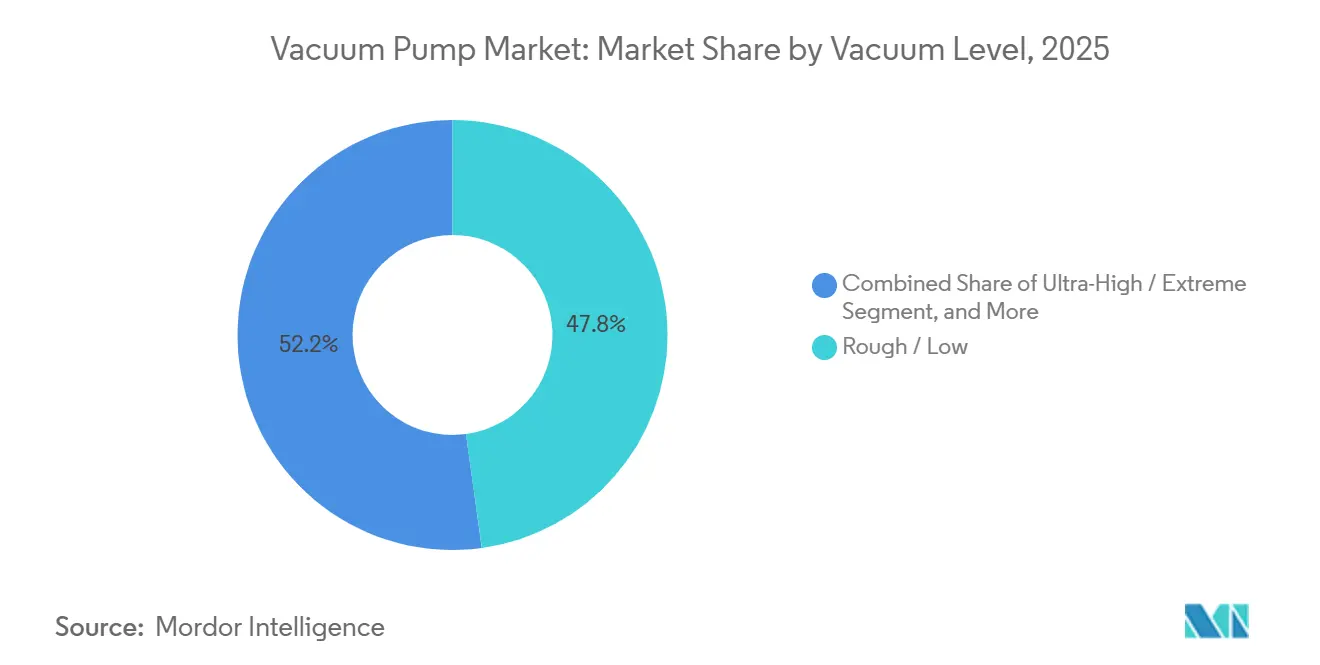
- By vacuum level, the rough and low ranges captured 47.83% of revenue in 2025, whereas the ultra-high and extreme ranges are advancing at a 6.61% CAGR.
- By end-user industry, semiconductor and electronics led demand with 32.44% revenue in 2025; battery manufacturing is projected to record the highest CAGR at 8.67% through 2031.
- By geography, Asia Pacific generated 39.72% of 2025 global sales, while the Middle East is set to deliver the fastest 7.89% CAGR through 2031.
Note: Market size and forecast figures in this report are generated using Mordor Intelligence’s proprietary estimation framework, updated with the latest available data and insights as of January 2026.
Global Vacuum Pump Market Trends and Insights
Drivers Impact Analysis*
| Driver | (~) % Impact on CAGR Forecast | Geographic Relevance | Impact Timeline |
|---|---|---|---|
| Semiconductor-grade vacuum in EUV lithography | +1.2% | Asia Pacific, North America, Europe | Medium term (2-4 years) |
| Accelerated LNG capacity additions post-2025 | +1.0% | Middle East, Asia Pacific, North America | Long term (≥ 4 years) |
| Rapid uptake of Industry 4.0 smart pumps | +0.9% | Global | Medium term (2-4 years) |
| Growth of global biologics fill-finish lines | +0.7% | North America, Europe, Asia Pacific | Medium term (2-4 years) |
| Battery-grade graphite anode production boom | +1.1% | Asia Pacific, Europe, North America | Short term (≤ 2 years) |
| Green-hydrogen electrolyzer build-out | +0.8% | Europe, Middle East, North America | Long term (≥ 4 years) |
| Source: Mordor Intelligence | |||
Semiconductor-Grade Vacuum in EUV Lithography
EUV scanners run below 10⁻⁶ pascal to prevent 13.5-nanometer photons from scattering, driving a step change in turbomolecular and cryogenic specifications. ASML’s Twinscan NXE platforms integrate multistage turbomolecular arrays that evacuate 1 m³ chambers in under 30 minutes.[1]ASML, “Annual Report 2024,” asml.com Fab expansion in Arizona, Texas, and Ohio collectively exceeds USD 200 billion, each site requiring 40-60 pumps per EUV tool and 200-300 pumps elsewhere in the fab. Transition from 7-nm to 3-nm nodes increases the etch and deposition steps by almost 30%, boosting pump content per wafer start. Refurbishment contracts for the installed base present an attractive aftermarket annuity as operators demand sub-10-nm particulate control.
Accelerated LNG Capacity Additions Post-2025
Global LNG liquefaction capacity is poised to climb 45% between 2024 and 2030, adding nearly 250 million tonnes per annum in Qatar, the U.S. Gulf Coast, and Australia.[2]International Energy Agency, “Gas 2025,” iea.org Each train employs 10-15 large rotary vane or liquid-ring pumps rated at 500-2,000 kW for dehydration, mercury removal, and refrigerant seal gas. Qatar Energy’s North Field projects alone represent vacuum equipment contracts over USD 100 million. Stricter International Maritime Organization carbon-intensity rules are accelerating the deployment of floating storage and regasification units, each of which adds 6-8 ballast and cargo containment pumps.
Rapid Uptake of Industry 4.0 Smart Pumps
Internet-of-things (IoT) controllers now stream bearing temperatures, vibration spectra, and current signature data to cloud platforms, cutting unplanned downtime by up to one-third in fabs and fill-finish suites.[3]Atlas Copco, “Sustainability Report 2024,” atlascopcogroup.com Pfeiffer Vacuum+Fab Solutions’ HiScroll 46 auto-modulates gas ballast to manage 530 g h-¹ water vapor, delivering 50% energy savings versus multistage roots designs. Remote monitoring contracts now contribute about one-fifth of aftermarket revenue for major OEMs, reflecting a pivot toward service-led business models.
Growth of Global Biologics Fill-Finish Lines
Monoclonal antibody and mRNA vaccine producers operate lyophilizers at 10-100 pascal, typically pairing each chamber with a 200-500 m³ h-¹ rotary vane or dry claw unit. Forty-seven WHO-prequalified biologics plants have installed two to four freeze-dryers each since 2024. Pfizer’s Kalamazoo and Moderna’s Marlborough sites collectively ordered 12 chambers in 2025, driving pump procurement worth nearly USD 16 million. Single-use formats have paradoxically raised vacuum demand, as bag evacuation and sterile connector sealing require portable dry scroll pumps with validated cleaning protocols.
Restraints Impact Analysis*
| Restraint | (~) % Impact on CAGR Forecast | Geographic Relevance | Impact Timeline |
|---|---|---|---|
| Volatile rare-earth prices (NdFeB motors) | -0.6% | Global | Short term (≤ 2 years) |
| Stricter PFAS lubricant regulations | -0.5% | North America, Europe | Medium term (2-4 years) |
| High TCO in ultra-high-vacuum ranges | -0.4% | Global | Long term (≥ 4 years) |
| Skilled-labor shortage for pump servicing | -0.3% | North America, Europe, Asia Pacific | Medium term (2-4 years) |
| Source: Mordor Intelligence | |||
Volatile Rare-Earth Prices (NdFeB Motors)
Neodymium-iron-boron magnets power about three-quarters of turbomolecular pumps, yet neodymium oxide climbed from USD 68 kg-¹ in January 2024 to USD 94 kg-¹ by December 2025 after China tightened export quotas. Resulting material cost inflation added USD 800-1,200 per high-end pump, eroding gross margins where multi-year OEM supply deals cap price pass-through. Alternatives such as ferrite or switched-reluctance drives sacrifice 15-20% energy efficiency and enlarge motor housings by up to 40%, complicating installation in compact semiconductor tools.
Stricter PFAS Lubricant Regulations
The United States Environmental Protection Agency’s proposal to list PFOA and PFOS as hazardous under CERCLA, coupled with European REACH Annex XVII limits of 25 ppb, forces reformulation of perfluoropolyether-based fluids. Operators face retrofit costs of USD 15,000-40,000 per pump to transition from oil-sealed to dry architectures. While hydrocarbon substitutes avoid liability, they require 40% shorter service intervals in high-temperature bake-outs, inflating maintenance budgets.
*Our forecasts treat driver/restraint impacts as directional, not additive. The impact forecasts reflect baseline growth, mix effects, and variable interactions.
Segment Analysis
By Pump Principle: Entrapment Technologies Address Quantum and Fusion Needs
Mechanical pumps generated 55.74% of the vacuum pump market in 2025, dominated by rotary vane, screw, claw, and roots designs used in food, wood, and LNG processing. Entrapment solutions, cryogenic, getter, and ion pumps account for a smaller base but are forecast to grow at a 7.29% CAGR. The shift stems from quantum-computing dilution refrigerators and fusion-energy tokamaks that demand vibration-free operation below 10⁻⁸ pascal. ULVAC’s LS Series integrates cryogenic stages into screw housings, eliminating electromagnetic interference while delivering base pressures an order of magnitude lower than those of mechanical peers. Meanwhile, the United Kingdom’s Industrial Fusion Solutions awarded a GBP 225,000 contract for a compound cryogenic prototype in 2025, highlighting nascent demand in the fusion sector.
Entrapment adoption is tempered by higher acquisition costs and specialized maintenance skills, yet total ownership savings accrue through oil-free operation, zero backstreaming, and extended mean time between service intervals. As extreme ultraviolet lithography migrates toward gate-all-around transistors, getter pumping arrays increasingly supplement turbomolecular forelines to achieve hydrocarbon-free vacuums. Mechanical suppliers respond with hybrid screw-plus-cryopanel offerings, but the complexity of component integration inflates procurement lead times.


By Lubrication: Dry Designs Gain Share Amid PFAS phase-outs
Dry pumps accounted for 64.89% of revenue in 2025 and are projected to maintain a 7.23% CAGR through 2031. The transition is propelled by PFAS restrictions and cleanroom mandates that cap hydrocarbon backstreaming at 10⁻⁹ torr-liters s-¹ under SEMI S2 guidelines. Edwards Vacuum’s CHIPS-Act-funded New York plant aims to deliver domestically semiconductor-grade dry screw units within 4 weeks, compared with 12-16 weeks for Asian imports. Agilent’s IDP-45 and Ebara’s EV-X launches further underscore the suppliers' focus on oil-free technologies tuned for corrosive etch chemistries and low-noise laboratory settings.
Oil-sealed variants retain footholds in chemical distillation, power, and legacy pharma lines where capital budgets or corrosive gas loads complicate the adoption of dry systems. Yet even conservative operators are reevaluating lifecycle economics as waste-oil disposal fees, lubricant compliance audits, and unexpected maintenance stoppages surface in total cost models. The vacuum pump market size for dry architectures is therefore set to expand faster than that of oil-sealed peers, despite a 40-60% upfront premium.
By Vacuum Level: Ultra-High Vacuum Extends Beyond Research
Rough and low ranges captured 47.83% of revenue in 2025, whereas the ultra-high and extreme ranges are advancing at a 6.61% CAGR. Rough and low-vacuum pumps operate between 1 kPa and 100 Pa, serving bulk-handling applications such as modified-atmosphere food packaging and wood-kiln drying. Medium ranges cater to lyophilization and metal heat-treating, while high vacuums (10⁻³-1 Pa) underpin analytical instrumentation and thin-film deposition. Ultra-high vacuums below 10⁻⁶ Pa are scaling outside national labs as EUV lithography, molecular beam epitaxy, and emerging solid-state battery deposition migrate to commercial fabs.
Solid-state electrolyte lines now specify high-vacuum ovens at below 10⁻² Pa to prevent lithium nitride and garnet films from hydrolyzing during sintering. Quantum computing racks use multistage cryopumps to maintain millikelvin environments at helium-3 flow rates of ~2 mmol s-¹. As a result, the vacuum pump market size in ultra-high segments is projected to grow steadily, although heightened requirements for material purity, sealing, and vibration control are raising prices.

By End-User Industry: Battery Lines Deliver Highest Growth
Semiconductor and electronics retained a 32.44% share in 2025, but battery manufacturing is anticipated to post the top 8.67% CAGR through 2031. Europe’s gigafactory pipeline, targeting 800 GWh by 2030, alongside North American incentives of USD 45 kWh-¹ under the Inflation Reduction Act, is fueling orders for 300-800 m³ h-¹ rotary and dry screw units per drying oven. Each gigawatt-hour of capacity commands USD 15-25 million in vacuum equipment, lifting the vacuum pump market across electrode lines.
Oil and gas, including LNG dehydration and vapor recovery, maintains a steady mid-teens share of demand, while pharmaceutical fill-finish lines and chemical distillation collectively account for roughly one-fifth. Food and beverage industries, mainly for packaging and freeze-drying, account for a significant share in the high single digits. Meanwhile, power generation, through turbine seal systems, adds a modest contribution in the low single digits.
Geography Analysis
Asia Pacific accounted for 39.72% of global revenue in 2025, making it the region with the largest vacuum pump market share. This leadership reflects China’s drive to localize equipment, South Korea’s expansion of memory chip production, and Japan’s entrenched supplier base. Domestic makers such as Wintek and Kashiyama are winning orders in mature-node semiconductor and photovoltaic lines as United States export controls restrict the import of advanced tools. Samsung and SK Hynix together accounted for one-fifth of regional demand by adding pumps for high-bandwidth memory and 3D NAND stacks with more than 200 layers. Ebara’s second overhaul plant in South Korea further strengthens local service capacity.
The Middle East is the fastest-growing region, with a forecast CAGR of 7.89% through 2031. Qatar Energy’s North Field East and South projects each deploy up to 15 large rotary vane or liquid-ring units, driving contracts worth more than USD 100 million. Saudi Arabia’s Vision 2030 petrochemical build-out and the United Arab Emirates’ hydrogen programs add demand for hydrogen-compatible turbomolecular pumps. Announced LNG, petrochemical, and desalination investments across the region exceed USD 300 billion, a pipeline expected to double the vacuum pump market size there over the forecast window. Rising adoption of predictive-maintenance platforms should also broaden aftermarket revenue streams.
North America generated about 11% of 2025 global sales, and this share will climb as Edwards Vacuum’s Genesee County plant and Intel’s USD 100 billion Ohio complex reach volume, cutting lead times to four weeks and meeting CHIPS Act domestic content rules. Europe, holding roughly 3%, should see incremental gains from battery gigafactories and REPowerEU electrolyzer lines that need high-vacuum drying and leak-testing systems. South America and Africa together account for a mid-single-digit share, with Brazil’s pulp sector and South Africa’s petrochemical plants anchoring orders while mining and infrastructure projects create additional opportunities.

Competitive Landscape
Busch Group, Atlas Copco, Pfeiffer Vacuum+Fab Solutions, Ingersoll Rand, and ULVAC together controlled roughly 45-50% of global revenue in 2025, signaling a moderately consolidated vacuum pump market. Busch strengthened its position by folding Centrotherm Clean Solutions into Pfeiffer Vacuum+Fab Solutions, creating a single brand that spans turbomolecular pumps, dry screw compressors, and semiconductor exhaust abatement systems. Atlas Copco continues to leverage Edwards Vacuum as its semiconductor arm, while Pfeiffer’s rebranding highlights a deliberate pivot toward turnkey fab offerings. These moves aim to secure multi-year tool-of-record slots with chipmakers and capture higher-margin aftermarket contracts. As a result, the top tier is widening the capability gap against mid-sized rivals.
Edwards Vacuum secured a USD 18 million CHIPS Act award and committed USD 300 million to build the first United States dry-pump factory, a step that shortens delivery cycles from 12-16 weeks to about 4 weeks for domestic fabs. Ebara opened a second overhaul plant in South Korea and launched the EV-X dry line with ceramic-coated rotors to meet corrosive etch chemistries. Graham Corporation expanded into space-launch turbomachinery, with a USD 22 million order book supporting cryogenic test investment. These capital commitments highlight a broader trend toward regional manufacturing and diversification into specialty applications. They also underscore how government incentives and end-market shifts are reshaping competitive priorities.
Kashiyama, Becker, Wintek, and other mid-tier suppliers target battery and food clients with modular dry claw and screw designs that cost 20-30% less than tier-1 equivalents but lack global service footprints. Digitalization is an emerging battleground, as Pfeiffer Vacuum+Fab Solutions’ multilingual e-commerce portal bundles Busch and Pfeiffer catalogs into a single interface, reducing quote times and capturing aftermarket parts sales. Several start-ups are experimenting with 3D-printed titanium pump housings that cut custom lead times from 12 weeks to three, although American Society of Mechanical Engineers code certification still limits broader uptake. Taken together, these dynamics suggest a landscape in which service capabilities, digital tools, and material innovations will increasingly influence share shifts away from traditional hardware differentiation.
Vacuum Pump Industry Leaders
Atlas Copco AB
ULVAC Inc.
Flowserve Corporation
Agilent Technologies
Shimadzu Corporation
- *Disclaimer: Major Players sorted in no particular order

Recent Industry Developments
- November 2025: Graham Corporation landed USD 22 million in turbomachinery orders from six space-launch clients and broke ground on a cryogenic test facility in Jupiter, Florida.
- November 2025: Ebara opened a second South Korean overhaul plant and debuted the EV-X dry pump line with ceramic-coated rotors for advanced etch chemistries.
- July 2025: Pfeiffer Vacuum+Fab Solutions launched a global website offering a consolidated product finder and online shop for the European Economic Area.
- May 2025: Busch Group folded centrotherm clean solutions into Pfeiffer Vacuum+Fab Solutions, retaining all 350 employees and the Blaubeuren production site.


Research Methodology Framework and Report Scope
Market Definitions and Key Coverage
Our study defines the global vacuum pump market as the annual revenue generated from sales of new mechanical, kinetic, or entrapment pumps engineered to evacuate gases from sealed volumes across industrial, scientific, and commercial settings. Units integrated within broader systems are included only when priced as discrete pump assemblies measurable in US-dollar terms.
Scope Exclusions: Refurbished pumps, aftermarket parts, rental fleets, and field-maintenance services are outside this scope.
Segmentation Overview
- By Pump Principle
- Mechanical
- Rotary
- Reciprocating
- Kinetic
- Dynamic
- Entrapment
- Cryogenic
- Getter
- Ion
- Mechanical
- By Lubrication
- Dry Vacuum Pumps
- Oil-Sealed / Wet Vacuum Pumps
- By Vacuum Level
- Rough / Low
- Medium
- High
- Ultra-High / Extreme
- By End-User Industry
- Oil and Gas
- Semiconductor and Electronics
- Pharmaceutical and Biotechnology
- Chemical Processing
- Food and Beverage
- Power Generation
- Battery Manufacturing
- Wood, Paper and Pulp
- Other End-User Industries
- By Geography
- North America
- United States
- Canada
- Mexico
- Europe
- Germany
- United Kingdom
- France
- Russia
- Rest of Europe
- Asia-Pacific
- China
- Japan
- India
- South Korea
- Australia
- Rest of Asia-Pacific
- Middle East and Africa
- Middle East
- Saudi Arabia
- United Arab Emirates
- Rest of Middle East
- Africa
- South Africa
- Egypt
- Rest of Africa
- Middle East
- South America
- Brazil
- Argentina
- Rest of South America
- North America
Detailed Research Methodology and Data Validation
Primary Research
Interviews with plant engineers, semiconductor tool buyers, chemical-process integrators, and regional distributors across North America, Europe, China, Japan, and India helped validate utilization rates, average selling prices, and emerging design-in preferences, filling data gaps flagged during desk work and anchoring scenario ranges.
Desk Research
We gathered foundational statistics from tier-1 public sources such as UN Comtrade shipment codes, Eurostat PRODCOM output tables, the US Census Bureau's Current Industrial Reports, Semiconductor Industry Association fab-capex releases, and International Energy Agency downstream refinery throughput updates. Company 10-Ks, investor decks, and reputable trade journals supplemented demand signals, while D&B Hoovers and Dow Jones Factiva furnished hard-to-find revenue splits. These sources shaped baseline volumes, pricing corridors, and end-market mix; many other references supported interim checks and clarifications.
Market-Sizing & Forecasting
Top-down reconstruction starts with production and trade data for rough/medium-vacuum equipment, which are then aligned to capital-spending ratios in semiconductors, refined-chemical output, pharmaceutical sterile-pack lines, and wafer-fab floor-space additions. Supplier roll-ups on sampled ASP × volume provide a bottom-up reasonableness check before figures are finalized. Key variables like global wafer starts, refinery turnaround schedules, pharmaceutical sterile-fill vials, PMI-linked machinery orders, and average pump replacement cycles feed a multivariate regression model; scenario analysis adjusts for cyclical capex swings.
Data Validation & Update Cycle
Mordor analysts run variance tests against external trade values, customs duty collections, and publicly reported vendor revenues. Anomalies trigger re-contacts with interviewees, followed by peer review before sign-off. The model refreshes annually, with mid-cycle updates if material events shift demand outlooks.
Why Mordor's Industrial Vacuum Pumps Baseline Commands Reliability
Estimates published by different firms often diverge because each chooses its own scope borders, variable sets, and refresh cadence.
Key gap drivers include selective exclusion of ultra-high-vacuum tiers, omission of electronics brownfield retrofits, differing ASP progression logic, and less frequent updates that miss currency and inflation resets. Mordor's disciplined inclusion rules and yearly recalibration narrow these gaps convincingly.
Benchmark comparison
| Market Size | Anonymized source | Primary gap driver |
|---|---|---|
| USD 7.56 B (2025) | Mordor Intelligence | - |
| USD 6.50 B (2025) | Global Consultancy A | Excludes ultra-high-vacuum pumps; relies on static ASP ladder |
| USD 6.90 B (2025†) | Industry Journal B | Limits scope to process industries; updates every three years |
| USD 5.97 B (2025) | Research Boutique C | Omits semiconductor clean-room demand and uses conservative currency conversion |
Across sources, our value sits mid-range yet is underpinned by transparent variables, live primary inputs, and yearly reviews, giving decision-makers a balanced, repeatable baseline they can trust.


Key Questions Answered in the Report
What CAGR is forecast for the vacuum pump market through 2031?
The vacuum pump market is expected to expand at a 6.83% CAGR from 2026 to 2031.
Which pump principle is growing fastest?
Entrapment architectures, including cryogenic and getter designs, are projected to rise at a 7.29% CAGR as ultra-high-vacuum needs escalate.
Why are dry vacuum pumps gaining popularity?
Dry designs avoid PFAS lubricant restrictions, minimize hydrocarbon backstreaming, and lower total ownership costs despite higher upfront prices.
Which region will grow quickest?
The Middle East is slated for the fastest growth, at about 7.89% CAGR, fueled by LNG and green-hydrogen investments.
How will battery gigafactories influence demand?
Each gigawatt-hour of battery capacity requires USD 15-25 million in vacuum equipment, driving the highest 8.67% CAGR among end-user segments.
What impact do rare-earth prices have on pump costs?
Neodymium price spikes have added up to USD 1,200 per turbomolecular unit, pressuring margins and encouraging exploration of motor alternatives.
Page last updated on:


