
Vaccine Delivery Devices Market Size and Share
Market Overview
| Study Period | 2020 - 2031 |
|---|---|
| Market Size (2026) | USD 6.63 Billion |
| Market Size (2031) | USD 9.22 Billion |
| Growth Rate (2026 - 2031) | 6.82 % |
| Fastest Growing Market | Asia-Pacific |
| Largest Market | North America |
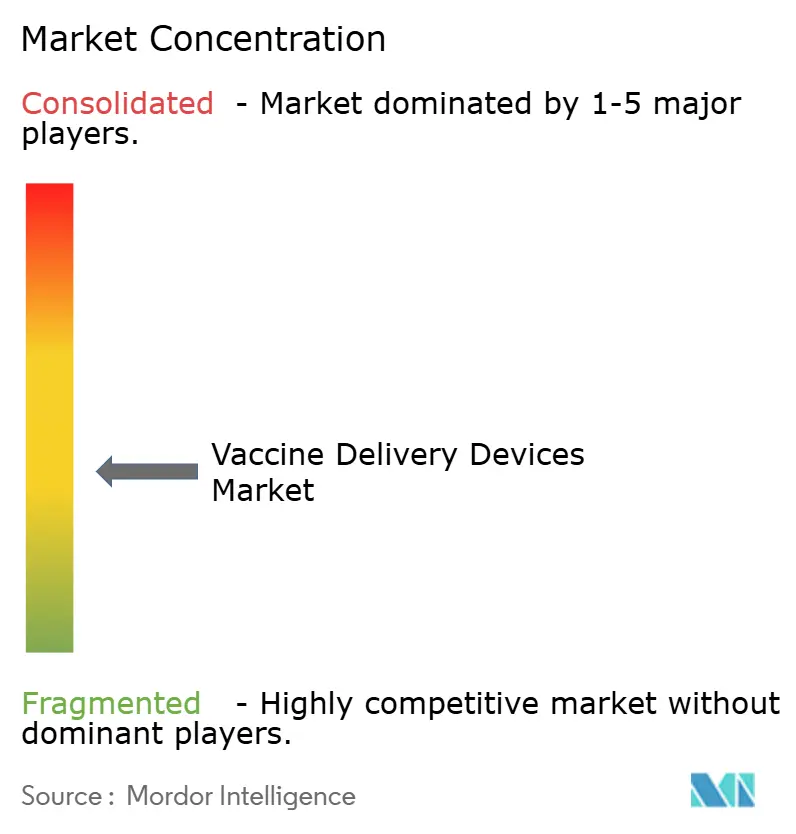
| Market Concentration | Medium |
Major Players *Disclaimer: Major Players sorted in no particular order Image © Mordor Intelligence. Reuse requires attribution under CC BY 4.0. | |
Vaccine Delivery Devices Market Analysis by Mordor Intelligence
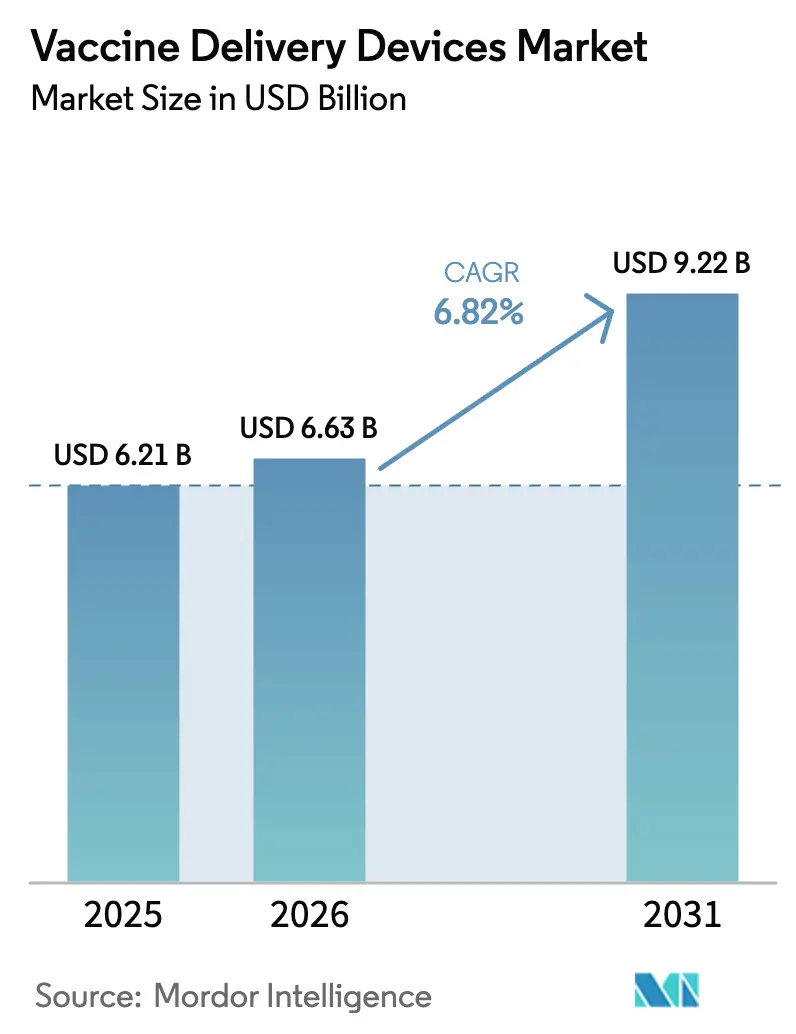
The vaccine delivery devices market size is expected to grow from USD 6.21 billion in 2025 to USD 6.63 billion in 2026 and is forecast to reach USD 9.22 billion by 2031 at 6.82% CAGR over 2026-2031. Growth is anchored in a steady transition from conventional syringes toward needle-free platforms, microneedle patches and intranasal sprays that align with pandemic-preparedness objectives and reduce cold-chain dependence. Large federal outlays—exemplified by the USD 5 billion Project NextGen initiative—are steering research teams and manufacturers toward devices that simplify mass immunization logistics while lowering occupational hazards [1]U.S. Department of Health and Human Services, “Project NextGen Initiative,” hhs.gov . At the same time, OSHA’s Needlestick Safety and Prevention Act is prompting health-care providers to replace legacy needles with engineered safety controls, further stimulating demand for advanced injectors. Regionally, the United States, the European Union, and Japan continue to dominate early adoption cycles, yet procurement momentum in India, Indonesia, and the Philippines is rising as multilateral lenders underwrite cold-chain and data-tracking infrastructure.
Key Report Takeaways
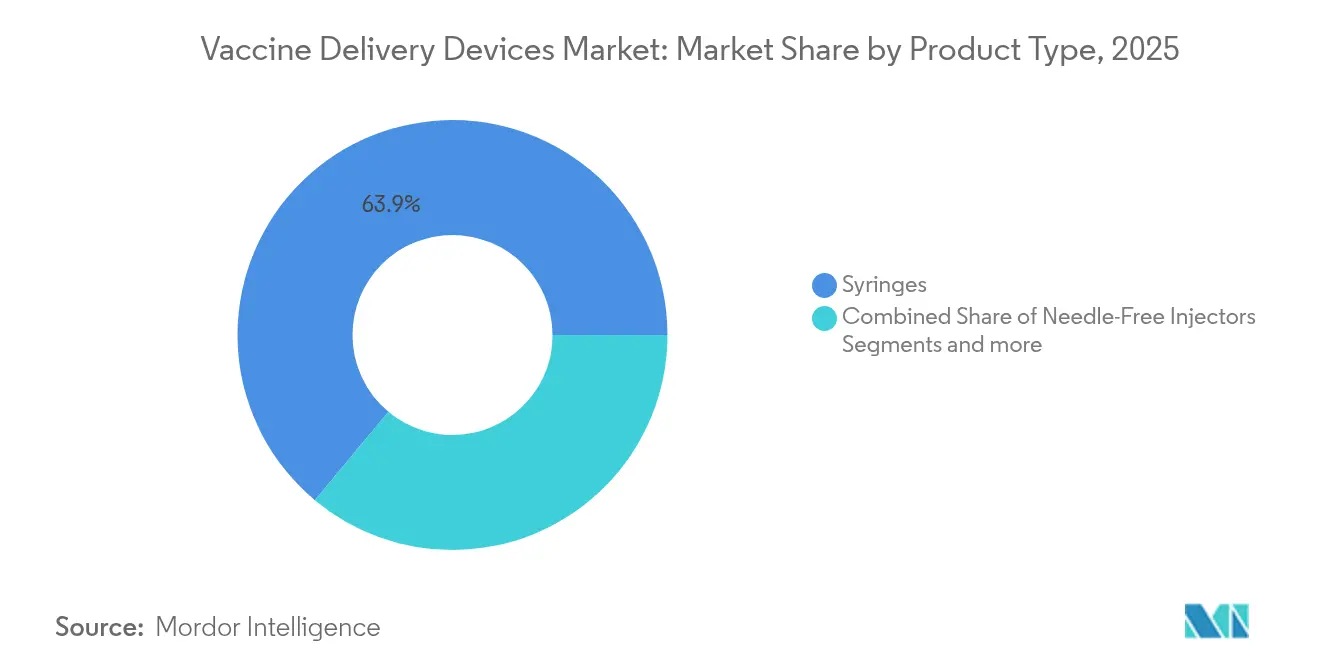
- By product type, syringes led the vaccine delivery devices market with 63.94% revenue share in 2025, while needle-free injectors are forecast to expand at a 7.49% CAGR to 2031.
- By route of administration, intramuscular delivery accounted for 52.74% of the vaccine delivery devices market share in 2025 and intradermal systems are advancing at a 7.12% CAGR through 2031.
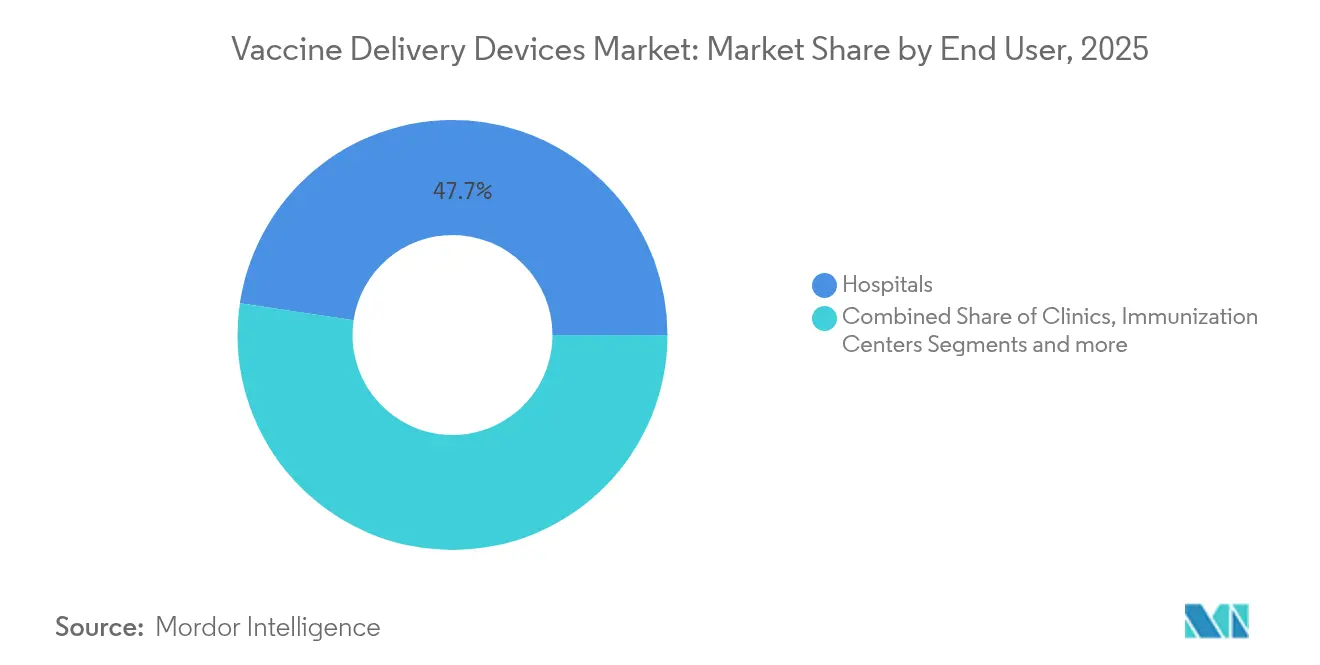
- By end user, hospitals held 47.65% of the vaccine delivery devices market in 2025, whereas immunization centers record the highest projected 7.43% CAGR for the same period.
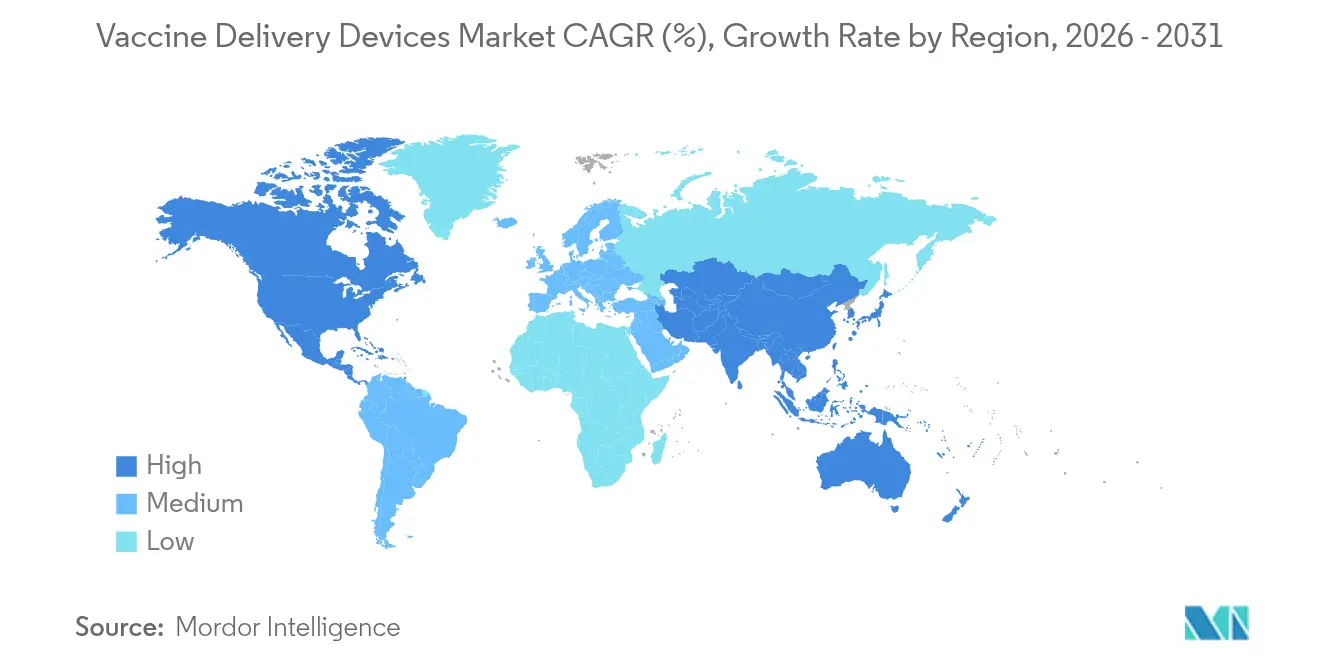
- By geography, North America captured 37.88% of the global revenue base in 2025, but Asia-Pacific is poised for the fastest 7.61% CAGR between 2026 and 2031.
Note: Market size and forecast figures in this report are generated using Mordor Intelligence’s proprietary estimation framework, updated with the latest available data and insights as of 2026.
Market Trends and Insights
Drivers Impact Analysis of Vaccine Delivery Devices Market*
| Driver | (~) % Impact on CAGR Forecast | Geographic Relevance | Impact Timeline |
|---|---|---|---|
| Growing global immunization funding | +1.2% | Global, with concentration in North America and Europe | Medium term (2-4 years) |
| Rapid uptake of needle-free injectors | +1.8% | North America & EU leading, APAC following | Short term (≤ 2 years) |
| Pandemic-preparedness stockpiles | +0.9% | Global, with emphasis on developed markets | Long term (≥ 4 years) |
| Safety-syringe regulations (NSIs) | +1.1% | North America & EU primary, expanding globally | Medium term (2-4 years) |
| Outsourced fill-finish boosts pre-filled vaccine devices | +0.7% | Global, concentrated in manufacturing hubs | Medium term (2-4 years) |
| Wearable injector patches in field trials | +0.3% | North America & EU initially, global expansion | Long term (≥ 4 years) |
| Source: Mordor Intelligence | |||


Growing Global Immunization Funding
Intensified public-sector financing is reshaping the vaccine delivery devices market by coupling pathogen-specific R&D awards with infrastructure grants that explicitly reference device innovation. In January 2025 the U.S. Department of Health and Human Services allocated USD 590 million to Moderna to refine mRNA pandemic influenza vaccines, and the agreement earmarked a portion for novel intradermal and intranasal administration formats. BARDA’s parallel Project NextGen has set aside USD 240 million for cold-chain automation and real-time genomic surveillance, ensuring that emerging formulations can be paired with delivery devices able to remain stable in transit. Comparable strategies are visible in the European Health Emergency Preparedness and Response Authority, which offers milestone payments to firms bundling thermostable patches with prototype vaccines. These capital flows smooth development risk, accelerate regulatory submissions and assure manufacturers of baseline purchase volumes once clinical milestones are crossed. Over the medium term the financing wave is expected to keep annual R&D spend on vaccine delivery devices above USD 1 billion, supporting sustained device launch pipelines across at least three administration routes [2]U.S. Department of Health and Human Services, “BARDA Pharmaceutical Countermeasures Infrastructure,” medicalcountermeasures.gov .
Rapid Uptake of Needle-Free Injectors
The appeal of needle-free platforms increasingly rests on clinical-trial data showing equal or superior immunogenicity and better patient acceptance. At the 2024 BIO International Convention, PharmaJet disclosed partner trials in which intradermal needle-free delivery elicited higher neutralizing-antibody titers for both rabies and influenza vaccines when compared with 0.5-milliliter intramuscular syringes. Regulatory clarity strengthened in 2025 when the FDA re-classified nonelectrically powered fluid injectors as Class II devices, thereby streamlining 510(k) pathways that had previously deterred small entrants. Incentives and clearer labeling guidance have already shortened U.S. commercialization timelines from an average 32 months to 22 months, magnifying first-mover advantages. Europe mirrors this trend; a July 2024 French grant enabled Crossject to expand its z-jet auto-injector line, signaling state-level support for safer outpatient vaccination tools. The cumulative effect is an accelerating equipment turnover cycle inside hospitals, public immunization centers and military channels.
Pandemic-Preparedness Stockpiles
Governments now structure strategic stockpiles around formulations that remain potent outside frozen supply chains, a policy that elevates demand for microneedle patches and dual-chamber pre-filled syringes able to house freeze-dried antigens. The U.S. National Pre-Pandemic Influenza Vaccine Stockpile keeps bulk antigen, adjuvant and matched devices ready for rapid fill-finish; requirements stipulate validated release within 12 hours of an EUA declaration. Laboratory evidence shows that trivalent influenza vaccine embedded in dissolving microprojections preserves potency for 24 months at 25 °C, widening the geographic window for last-mile deployment. With the Public Health Emergency Medical Countermeasures Enterprise budgeting USD 79.5 billion in device-inclusive projects through 2027, OEMs have multi-year purchase visibility that encourages investment in automated array-patch fabrication lines. As similar frameworks emerge in Canada, Japan and Australia, long-term pull-through volumes are likely to remain resilient even if annual routine-immunization cycles fluctuate.
Safety-Syringe Regulations (NSIs)
Needlestick injury risk continues to shape institutional purchasing criteria. OSHA obliges employers to embed employees in device-selection committees, maintain sharps-injury logs and adopt needle-shielded or needleless alternatives where feasible. The rule covers surgical kits, vaccination carts and emergency stockpiles, forcing health-care systems to validate safety features at the procurement stage. Compliance cost alone has propelled many facilities to phase out traditional open-hub syringes, especially as insurers adjust occupational liability premiums. European regulators apply analogous directives via the EU Sharp Injuries Directive, amplifying cross-regional convergence and reducing supplier portfolio fragmentation. Device makers that cannot document passive needle-retraction or secure-guard designs now face shrinking tender eligibility, accelerating revenue migration toward integrated safety or needle-free solutions.
Restraints Impact Analysis of Vaccine Delivery Devices Market*
| Restraint | (~) % Impact on CAGR Forecast | Geographic Relevance | Impact Timeline |
|---|---|---|---|
| High microneedle-patch production cost | -0.8% | Global, with higher impact in cost-sensitive markets | Medium term (2-4 years) |
| Sterility hurdles for re-usable systems | -0.5% | Global, particularly in regulatory-strict regions | Long term (≥ 4 years) |
| COP polymer supply bottlenecks | -0.3% | Global, concentrated in manufacturing hubs | Short term (≤ 2 years) |
| Cold-chain packaging gaps for micro-array patches | -0.2% | APAC and MEA primarily, with spill-over to rural areas globally | Medium term (2-4 years) |
| Source: Mordor Intelligence | |||
High Microneedle-Patch Production Cost
Despite robust clinical promise, large-scale microneedle manufacture remains capital-intensive because laser ablation, MEMS etching and biopolymer molding each require distinct clean-room classes and in-line metrology. A 2023 PATH readiness study documented that fewer than five commercial lines worldwide are certified for Good Manufacturing Practice microarrays at volumes above 10 million patches annually, far below projected pandemic demand ceilings. Unit-cost premiums range from 1.4-times to 3.2-times the delivered price of a standard syringe-plus-vial set, restricting uptake in cost-sensitive national immunization programs. Investors are hesitant to fund green-field plants until long-term purchase agreements crystallize, creating a capital-access bottleneck. Over the next two years, economies of scale could improve as BARDA, CEPI and the Bill & Melinda Gates Foundation underwrite demonstration plants, yet initial per-dose pricing parity with syringes is unlikely before 2028.
Sterility Hurdles for Reusable Systems
Reusable jet injectors promise lower environmental impact, but regulators require proof that inter-patient contamination risk approaches zero across multiple microbial species. Thermal or chemical re-processing cycles often degrade elastomeric seals or alter plunger dynamics, jeopardizing dose accuracy. Health-care organizations must purchase dedicated autoclave or vaporized hydrogen peroxide units, hire trained technicians and institute traceable process records, adding hidden operating costs [3]U.S. Food and Drug Administration, “Essential Drug Delivery Outputs Draft Guidance,” fda.gov . In lower-income settings, limited sterilization infrastructure forces a choice between off-label reuse and forced adoption of single-use disposables. The risk calculus tilts procurement teams toward pre-sterilized, individually packaged devices even when per-unit plastic waste rises, dampening the global TAM for reusable platforms.
*Our forecasts treat driver/restraint impacts as directional, not additive. The impact forecasts reflect baseline growth, mix effects, and variable interactions.
Vaccine Delivery Devices Market Segment Analysis
By Product Type:
Syringes Dominate Despite Needle-Free InnovationSyringes commanded 63.94% of the vaccine delivery devices market in 2025, translating to a vaccine delivery devices market size contribution of roughly USD 3.97 billion at current prices. Heightened safety-syringe mandates and the entrenched global distribution footprint of top manufacturers keep baseline volumes robust, while bulk tender contracts from UNICEF and Gavi guarantee throughput for 0.5-milliliter auto-disable formats. Needle-free injectors, however, are scaling faster than any other product class, registering a 7.49% CAGR that rides on occupational-safety policies and patient-centric vaccination campaigns that highlight pain reduction. Microneedle patches occupy a nascent yet strategically important niche; early trials have achieved patient preference rates approaching 70%, suggesting a strong behavioral pull once cost curves descend. Nasal spray dispensers also enjoy renewed attention as intranasal influenza and COVID-19 candidates move through Phase II pipelines under Project NextGen grant funding. Competitive dynamics revolve around portfolio breadth: Becton Dickinson is spending USD 10 million to lift U.S. output of safety-engineered injectors by 40%, yet it simultaneously collaborates with Ypsomed on high-viscosity auto-injectors to hedge against needle-free penetration.
Second-generation jet injectors and wearable patches round out the “Others” category, and although their absolute dollar share remains small, investors view them as gateway technologies for at-home immunization models. Micron Biomedical’s USD 33 million Series A extension underscores rising venture appetite for dissolvable microarray devices that eliminate cold-chain obligations and empower self-administration. The competitive narrative increasingly rewards firms able to re-purpose syringe filling lines for patch or jet formats, thereby shortening time-to-scale when public-health emergencies arise.


By Route of Administration:
Intradermal Gains MomentumIntramuscular delivery retained a dominant 52.74% slice of the vaccine delivery devices market share in 2025, supported by decades-old product labeling and clinician familiarity. Still, intradermal administration is rising at a 7.12% CAGR as studies confirm stronger antigen-presenting-cell engagement and dose-sparing advantages that can stretch constrained antigen supply during pandemics. Manufacturers responding to this shift are redesigning device tip geometries to achieve consistent 1 millimeter penetration depths, thereby avoiding the high failure rates that historically plagued Mantoux-style injections. Subcutaneous routes hold a steady foothold for adjuvanted formulations that exhibit local reactogenicity when delivered intradermally, while intranasal sprays are rebounding on the back of mucosal-immunity targets for respiratory pathogens.
Technology convergence is evident: Vaxxas demonstrated that its silicon Nanopatch produced equivalent hemagglutination-inhibition titers to intramuscular injection at one-fifth the antigen dose, raising hopes for rapid-scale outbreak responses. Regulatory frameworks now feature route-specific annexes, allowing simultaneous 510(k) submissions for intradermal microneedles and intranasal spray pumps under unified master files.
By End User:
Immunization Centers Drive GrowthHospitals generated 47.65% of global revenue in 2025 but are ceding momentum to specialized immunization centers that enjoy lean staffing models and purpose-built data systems. The vaccine delivery devices market size attributable to these centers is forecast to rise at a 7.43% clip as mass-campaign learnings from COVID-19 translate into permanent brick-and-mortar or mobile facilities. Clinics maintain steadier single-digit expansion by absorbing routine pediatric and geriatric schedules, yet their capacity constraints limit throughput during outbreak surges.
Retail pharmacies and pop-up sites fall under “Other” end users, and their collective share is enlarging thanks to telehealth scheduling platforms and extended weekend hours. Multilateral financing is pivotal: the Asian Development Bank’s USD 9 billion APVAX program subsidizes solar-powered cold rooms and bar-code scanners, redefining technical standards for rural immunization hubs. Digital innovations buttress this shift; India’s eVIN and Indonesia’s SMILE systems processed billions of doses and now form the backbone for predictive resupply algorithms, further heightening the device-tracking requirements that modern delivery hardware must meet.
Geography Analysis
North America Vaccine Delivery Devices Market
North America retained the leading 37.88% revenue share in 2025 due to multi-billion-dollar federal programs, favorable reimbursement and a mature GxP manufacturing base. Government procurement schedules often bundle syringes, vial stoppers and safety devices, assuring OEMs of volume commitments that de-risk capex. FDA draft guidances on device-drug combination products have further lowered the regulatory ambiguity that once discouraged platform experimentation. Moreover, OSHA compliance audits compel hospitals to replace non-shielded needles, channeling predictable demand toward newer engineered solutions.
APAC Vaccine Delivery Devices Market
Asia-Pacific is the fastest-growing region with a 7.61% CAGR to 2031, propelled by rapid urbanization, rising middle-class vaccination awareness and infrastructure build-outs funded through APVAX. China and India now host several fill-finish hubs that shorten regional lead times for pre-filled syringes, while Southeast Asian economies pilot microneedle feasibility studies in hard-to-reach islands. Regulatory pathways are also harmonizing: Indonesia’s BPOM has adopted ASEAN Common Submission Dossiers, and India’s CDSCO provides accelerated review windows for WHO prequalified devices, slowly reducing market entry friction for foreign OEMs.
Europe Vaccine Delivery Devices Market
Europe exhibits mid-single-digit growth as occupational-safety directives and environmental legislation influence purchasing hierarchies. National health services prioritize needle-free injectors to lower sharps waste, yet they demand fully recyclable packaging that complicates supply-chain design. Investment in sterile fill-finish capacity—Aenova’s EUR 16 million Italian expansion stands out—underlines the region’s intent to localize advanced-device manufacturing. Eastern European nations, meanwhile, are tapping EU Cohesion Funds to modernize cold-chain logistics, ensuring that new device types remain viable across cross-border vaccination drives.

Regulatory Landscape
Vaccine delivery devices are governed by a blend of medical-device rules and drug-device combination product requirements. In the United States, delivery platforms used with vaccines typically follow FDA device controls while also meeting combination-product quality requirements under 21 CFR Part 4, and the FDA Quality Management System Regulation (QMSR) became effective on February 2, 2026 by incorporating ISO 13485:2016 into the device quality framework. This update raises expectations for design controls, supplier qualification, and post-market quality systems across syringe, injector, and ancillary-device manufacturers.
Internationally, market access for immunization devices is shaped by WHO prequalification (PQ) for immunization devices, which many procurement channels use to qualify suppliers for large tenders. Technical compliance anchors increasingly reference updated ISO benchmarks: ISO published ISO 11608-1:2022/Amd 1:2026 in April 2026 for needle-based injection systems and ISO 11040-8:2026 in June 2026 for finished prefilled syringes. These publications tighten expectations around functional performance, safety, and test methods for ready-to-fill and prefilled formats used in mass vaccination programs.
Value Chain Analysis
The value chain covers raw materials such as borosilicate glass, cyclic olefin polymers, and elastomers including bromobutyl rubber, plus precision components like needles, plungers, nozzles, springs, and safety shields. It also includes regulated processing steps, including cleanroom molding, aseptic assembly, and terminal sterilization using ethylene oxide or radiation. Downstream, devices are integrated through fill-finish and combination-product pathways for prefilled syringes and device-enabled presentations, and they move into procurement channels such as government tenders and multilateral buyers where WHO prequalification status and tender eligibility for safety features influence supplier selection.
Recent moves show how firms are localizing capabilities to reduce supply risk. PharmaJet signed distribution and manufacturing agreements with EVA Pharma and its affiliate ATR in 2025 to support Tropis needle-free systems and localize manufacturing in the Middle East and Africa. The Serum Institute of India also took a 20% stake in IntegriMedical in May 2024 to advance needle-free injection technology. Cold-chain and last-mile readiness further affect device throughput in immunization settings; in Gavi-supported countries, cold-chain functionality improved markedly by end-2025, and Gavi’s African Vaccine Manufacturing Accelerator (AVMA), launched in June 2024, adds pull-financing mechanisms that can support downstream readiness for device-enabled vaccine presentations alongside local vaccine manufacturing.
Competitive Landscape
Established conglomerates such as Becton Dickinson, Terumo and Gerresheimer leverage global distribution footprints, vertically integrated glass and polymer molding, and extensive regulatory dossiers to defend market prime positions. BD alone supplies more than 8 billion syringes annually and is enlarging U.S. output by over 40% following a USD 10 million investment that adds safety-engineered capacity across Connecticut and Nebraska plants. Terumo continues to scale its SmartShot™ safety platform, pairing sterile syringes with passive re-shield mechanisms that satisfy OSHA and EU sharps mandates. These incumbents are progressively channeling R&D toward hybrid portfolios that blend conventional needles with needle-free accessories to hedge against technology disruption.
Innovation specialists—including PharmaJet, Vaxxas and Micron Biomedical—garner attention via targeted clinical collaborations and strategic equity rounds. Micron Biomedical’s dissolving microarray patch is co-funded by BARDA and CEPI, ensuring alignment with global pandemic-preparedness agendas. Vaxxas, meanwhile, progresses toward a 50-million-dose annual patch line backed by Australian government grants, signaling a possible first-to-market advantage in high-density micro-projection arrays. Competitive intensity rises as large syringe makers partner with smaller firms—BD’s pact with Ypsomed on high-viscosity auto-injectors exemplifies portfolio-gap filling through alliance rather than outright acquisition.
Supply-chain fragility remains a cross-company concern, particularly in cyclic olefin polymer resin for syringe barrels and specialized fluoropolymers for jet-injector seals. Firms combat risk via dual-sourcing, advanced-purchase agreements and vertical integration into resin compounding. Digital traceability enters the battlefield; Aptar and SHL Medical are prototyping connected caps and auto-injectors that feed adherence data directly into population-level immunization dashboards. Ultimately, competitive advantage accrues to manufacturers that marry high-volume GMP production with nimble device-format evolution, ensuring readiness for both routine and emergency campaigns.
Vaccine Delivery Devices Industry Leaders
Terumo
B. Braun Melsungen AG
Becton, Dickinson and Company
Gerresheimer AG
PharmaJet Inc.
- *Disclaimer: Major Players sorted in no particular order
Vaccine Delivery Devices Market Companies Covered in this Report
- Becton Dickinson & Co.
- B. Braun
- Terumo
- Zhejiang Longde Pharma
- Vaxxas Pty Ltd
- Hindustan Syringes & Medical Devices
- Gerresheimer
- SCHOTT
- Enesi Pharma
- PharmaJet
- Mystic Pharmaceuticals
- Bioject Medical Technologies
- West Pharmaceutical Services
- Stevanato Group
- Nipro
- AptarGroup Inc.
- Catalent
- Rommelag Engineering
- Solventum
- Star Syringe Ltd

Market Opportunities and Future Outlook
A growing opportunity centers on scaling thermostable, needle-free formats that reduce dependence on highly controlled cold-chain distribution and make mass immunization logistics easier to execute. In May 2026, Micron Biomedical opened a 26,000 square foot commercial-scale manufacturing facility in Alpharetta, Georgia for dissolvable microarray vaccine patches, which provides a clearer signal of progress from clinical-stage development to industrial-scale output. WHO delivery-technology priorities and broader pandemic-preparedness programs also reinforce demand for delivery platforms built for rapid deployment, dose-sparing, and safer administration in high-throughput settings.
Near-term whitespace remains in (i) intradermal and needle-free systems that can work across routine programs and outbreak campaigns, and (ii) component innovation to address packaging and material constraints. In May 2026, PharmaJet reported that its Tropis intradermal needle-free system was selected to deliver 1.4 million polio vaccine doses in Nigeria, which functions as a scale proof point for public-immunization use. On the enabling-components side, NuGen Medical Devices filed a patent in March 2026 for a ready-to-fill COP/COC needle-free injection nozzle concept, reflecting continued efforts to align advanced delivery formats with high-volume, manufacturable primary-packaging and fluid-path designs.
Recent Industry Developments in Vaccine Delivery Devices Market
- May 2026: Micron Biomedical opened a 26,000 square foot commercial-scale manufacturing facility in Alpharetta, Georgia for dissolvable microarray vaccine patches. The site strengthens the company’s ability to supply patches beyond pilot quantities and supports broader qualification activities tied to GMP-scale production. Expanded MAP capacity also helps validate patch-based delivery as a practical alternative where cold-chain and trained-injector availability constrain immunization throughput.
- October 2025: Gerresheimer started construction on a new production facility in Wertheim, Germany for ready-to-fill vials using its EZ-fill Smart packaging platform, supported by a EUR 30 million investment. The build-out adds capacity and automation for sterile primary packaging that commonly pairs with prefilled and safety-enhanced vaccine delivery formats. Increased European RTF output reduces dependence on long-distance shipments of critical container components and can shorten lead times for campaign-scale fill-finish.
- May 2024: Gerresheimer commenced a two-stage USD 180 million expansion of its medical systems production site in Peachtree City, Georgia, adding cleanroom space and automated warehouse capabilities for products including autoinjectors. The expansion strengthens North American manufacturing depth for device platforms that can be adapted to vaccine and broader injectable-use cases. Greater automation and cleanroom footprint also support consistent quality and higher-volume output for regulated delivery systems.


Vaccine Delivery Devices Market Report Scope and Research Methodology
Market Definition and Coverage
This market tracks the revenue generated from devices used to administer vaccines across healthcare and immunization settings, including conventional injection formats and newer needle-free and intranasal delivery options.
Scope exclusions: vaccine drug value, cold chain logistics services, and general consumables that are not part of a vaccine delivery device are not counted.
Segments Covered in This Report
- By Product Type
- Syringes
- Needle-Free Injectors
- Microneedle Patches
- Nasal Spray Devices
- Others
- By Route of Administration
- Intramuscular
- Intradermal
- Subcutaneous
- Intranasal
- By End User
- Hospitals
- Clinics
- Immunization Centers
- Others
- By Geography
- North America
- United States
- Canada
- Mexico
- Europe
- Germany
- United Kingdom
- France
- Italy
- Spain
- Rest of Europe
- Asia-Pacific
- China
- Japan
- India
- Australia
- South Korea
- Rest of Asia-Pacific
- Middle East and Africa
- GCC
- South Africa
- Rest of Middle East and Africa
- South America
- Brazil
- Argentina
- Rest of South America
- North America
Data Sources, Market Sizing, and Validation
Desk Research
Desk research was used to build the first structure of the market and set guardrails on what should and should not be included. To anchor the scope, we referenced public health and immunization context from sources such as the World Health Organization, the US CDC, and UNICEF, then checked device safety and use patterns using FDA pages and peer-reviewed clinical literature.
To ground the market in commercial signals, we reviewed public company filings and investor presentations for device manufacturers and component suppliers, along with reputed press coverage and association websites tied to syringes, injection safety, and medtech. Where available, paid database subscriptions were used selectively for company financials and intelligence, patent searches, and relevant trade and shipment indicators for devices and components. These sources are illustrative rather than exhaustive, and additional references were used during the study for data collection, validation, and clarification.
Primary Interviews and Surveys
Primary interviews and surveys were used to validate what is actually purchased for vaccination programs, and how device mix changes by setting and route of administration. We spoke with device manufacturers, distributors, vaccine program stakeholders, hospital and clinic staff, and subject experts across major regions, which helped us pressure-test adoption assumptions for needle-free options and intranasal devices before finalizing the model.
Distribution of primary research fieldwork respondents
| Company type | Respondent position | Region |
|---|---|---|
| Top tier: 38% | CXOs: 12% | APAC: 48% |
| Mid tier: 42% | Functional/Unit leaders: 41% | EMEA: 33% |
| Smaller Players: 20% | Managers: 47% | Americas: 19% |
Market-Sizing & Forecasting
Our sizing starts with a top-down build where immunization activity and delivery route mix are converted into device demand, then valued using typical device pricing by type. After forming the market total, we corroborate it with selective bottom-up checks, including sampled revenue roll-ups for key device categories, channel checks with distributors, and volume times ASP spot checks for high-share products.
Key inputs in the model include vaccination volumes by geography, the share of doses delivered through intramuscular versus intradermal, subcutaneous, and intranasal routes, adoption rates of safety syringes and needle-free systems, the pace of new platform introductions (such as microneedle patches and nasal devices), and average selling price progression driven by mix changes and procurement patterns. For emerging formats where direct volume signals were not clean, we filled gaps using proxy indicators from expert feedback and adjacent device uptake, then applied conservative adjustments so totals stayed realistic.
For forecasting, we used scenario analysis because demand is shaped by policy cycles, catch-up campaigns, and outbreak-driven surges that do not always follow a smooth trend. The forward view was then aligned to the most consistent drivers that experts agreed on, including routine immunization continuity, safety compliance pressure, and the time needed for new formats to scale in public programs.
Data Validation & Update Cycle
Validation is performed through cross-checks between the modeled output and independent signals, such as procurement behavior, expectations for route-of-administration mix, and implied revenue per vaccination activity in major regions. When outliers show up, we re-check assumptions, re-read source notes, and, if needed, re-contact primary respondents to confirm whether a change is local or global.
Before sign-off, the model and write-up go through multi-step analyst reviews to keep unit logic, price assumptions, and coverage boundaries consistent across sections. Reports are refreshed annually, and interim updates are added when material events occur, including major policy shifts, new safety guidance, or meaningful platform launches. Right before delivery, an analyst performs an additional review pass so clients receive the latest updated view.
Mordor Intelligence's Vaccine Delivery Devices Market Size Compared With Other Published Estimates
Published market numbers for vaccine delivery devices can vary widely even when similar device labels are used, since counting rules differ by product inclusion and by what is treated as vaccine-only demand. Differences also come from how pricing is averaged across public tenders versus private channels, and from whether estimates are updated after immunization and preparedness announcements.
The table reflects a spread that is mostly explained by the scope included in the totals and how quickly underlying assumptions get refreshed. In Mordor Intelligence's model, value is counted for vaccine-specific delivery devices across syringes, needle-free injectors, microneedle patches, and nasal delivery formats, while excluding the vaccine drug itself and service layers outside the device sale. Some published figures also fold in broader drug delivery use, or they apply a faster ASP ramp for newer formats without checking how quickly immunization programs qualify and procure them in practice.
Benchmark comparison
| Source | Market Size | Gaps in Research Methodology |
|---|---|---|
| Mordor Intelligence | USD 6.63 B (2026) | |
| Industry Report A | USD 7.92 B (2025) | Uses a different base year and may blend vaccine delivery devices with adjacent administration devices, which can lift totals when non-vaccine use is not separated cleanly. |
| Trade Journal B | USD 6.39 B (2024) | Works off an earlier base year and a shorter forecast lens, with limited detail on how route mix and procurement-led ASPs are normalized across regions. |
Reading the three figures together, the main lesson is that market size depends heavily on device-only scope and on how route mix and pricing are translated into value. By keeping the counting rule tied to vaccination delivery formats and then checking outputs against channel and adoption reality, the estimate stays traceable to clear inputs that can be reviewed and repeated.


Key Questions Answered in the Report
What is the current vaccine delivery devices market size?
The vaccine delivery devices market size stood at USD 6.63 billion in 2026 and is forecast to rise to USD 9.22 billion by 2031.
Which product segment is growing the fastest?
Needle-free injectors are the fastest-expanding product class with a projected 7.49% CAGR through 2031.
Why are intradermal devices gaining popularity?
Intradermal delivery sparks stronger immune responses at lower antigen doses, enabling dose-sparing strategies during pandemics.
Which region will post the highest growth?
Asia-Pacific is expected to record the quickest 7.61% CAGR due to large-scale infrastructure programs such as ADB’s APVAX facility.
How are safety regulations shaping procurement?
OSHA’s Needlestick Safety and Prevention Act and parallel EU directives obligate hospitals to adopt engineered sharps controls, driving demand for safety-syringes and needle-free systems.
What is the main supply-chain bottleneck?
Limited availability of high-grade cyclic olefin polymer for syringe barrels and vial alternatives remains a critical constraint for manufacturers.
Page last updated on:


 Your data is secure and never sold or shared.


