Market Overview
| Study Period | 2020 - 2031 |
|---|---|
| Forecast Data Period | 2026 - 2031 |
| Historical Data Period | 2020 - 2024 |
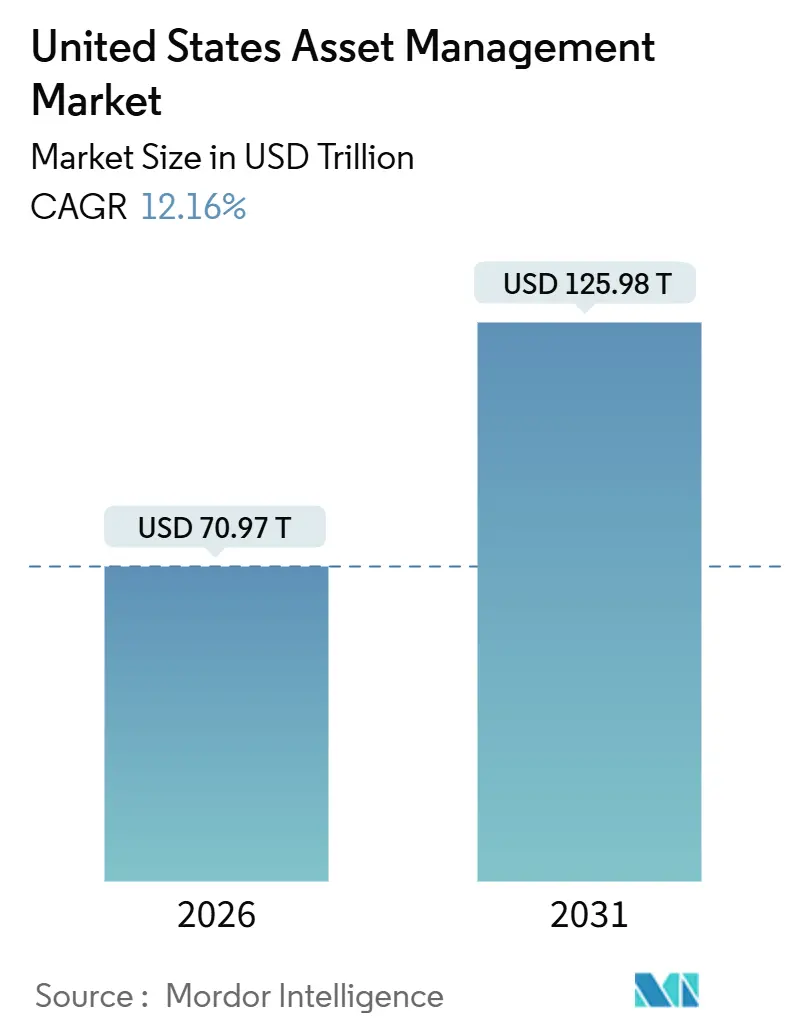
| Market Size (2026) | USD 70.97 Trillion |
| Market Size (2031) | USD 125.98 Trillion |
| Growth Rate (2026 - 2031) | 12.16% CAGR |
| Market Concentration | Medium |
Major Players *Disclaimer: Major Players sorted in no particular order Image © Mordor Intelligence. Reuse requires attribution under CC BY 4.0. | |
United States Asset Management Market Analysis by Mordor Intelligence
The United States asset management market size is projected at USD 70.97 trillion in 2026 and forecast to reach USD 125.98 trillion by 2031, reflecting a 12.16% CAGR. Expanding AI adoption is shifting the operating model from workflow efficiency to decision automation, which is accelerating product innovation and enabling new fee constructs across public and private strategies. Rising capital expenditure by large U.S. technology firms into AI infrastructure is reinforcing a feedback loop of data-driven investing, analytics, and liquidity that benefits scaled managers with distribution leverage. Managers are also leaning into active ETF wrappers and multi-share class structures to capture tax-efficient flows as platform acceptance grows across wealth channels. The convergence of workplace emergency-savings programs and liquidity-focused ETFs is broadening the retail on-ramp and strengthening the funding base for cash and short-duration strategies[1]J.P. Morgan, “OUTLOOK 2026 Promise and Pressure,” JPMorgan Chase, jpmorgan.com.
Key Report Takeaways
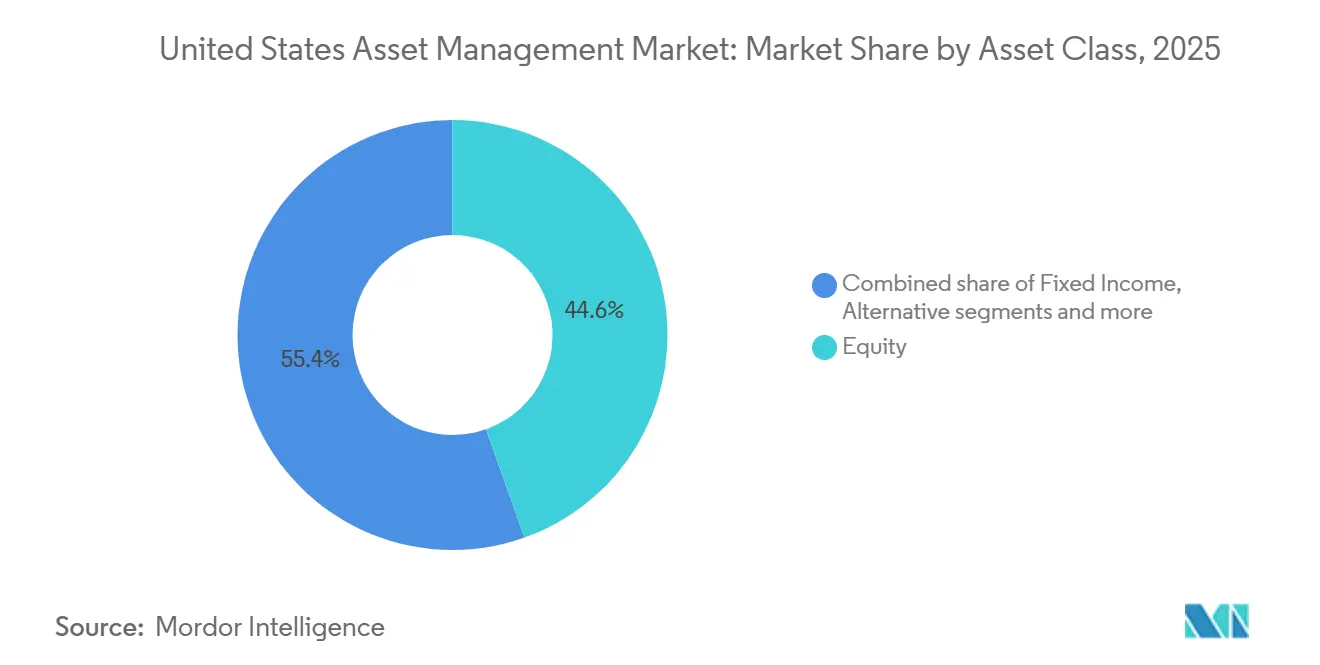
- By asset class, equity led with 44.56% of the United States asset management market share in 2025. Alternative assets are projected to expand at a 14.62% CAGR through 2031.
- By firm type, wealth advisory firms commanded a 33.48% share in 2025. Wealth advisory firms are also forecasted to grow the fastest at a 13.88% CAGR through 2031.
- By mode of advisory, human advisory held 92.65% share in 2025. Robo-advisory is set to grow at a 19.33% CAGR from 2026 to 2031.
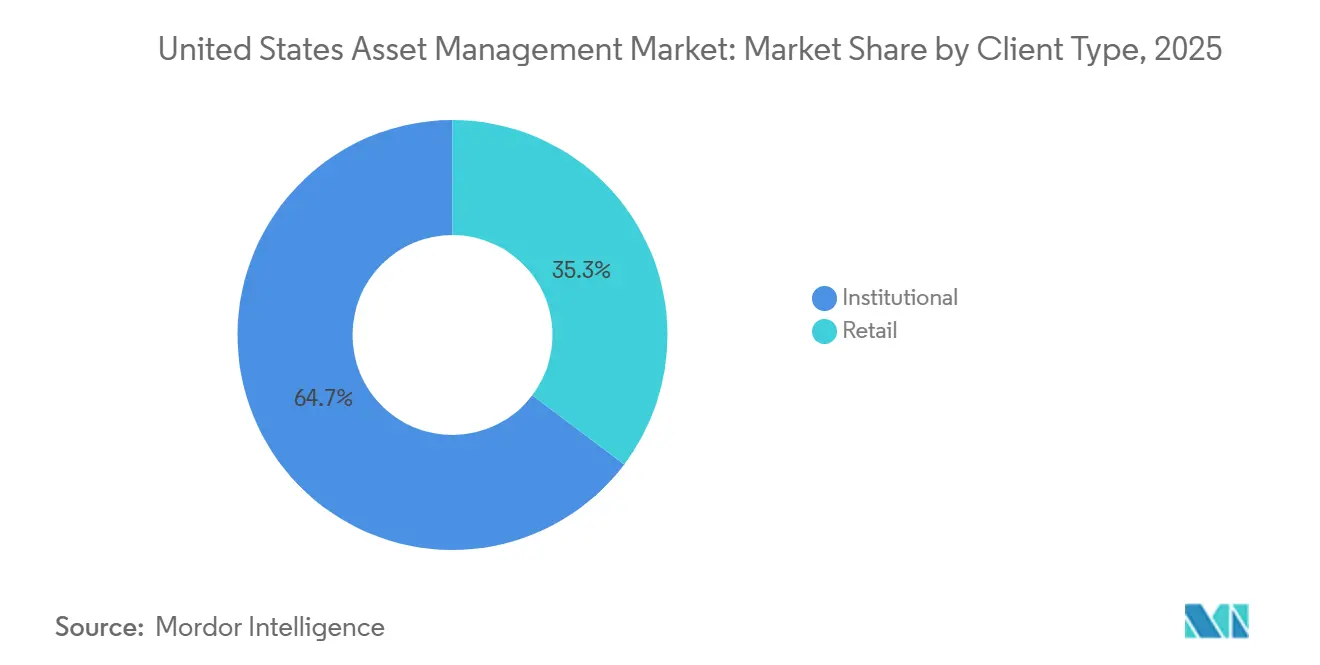
- By client type, institutional clients held a 64.72% share in 2025. Retail is expected to grow at a 15.49% CAGR through 2031.
- By management source, onshore-managed assets accounted for 87.61% share in 2025. Offshore-delegated assets are set to advance at a 17.76% CAGR from 2026 to 2031.
Note: Market size and forecast figures in this report are generated using Mordor Intelligence’s proprietary estimation framework, updated with the latest available data and insights as of January 2026.
United States Asset Management Market Trends and Insights
Drivers Impact Analysis*
| Driver | (~) % Impact on CAGR Forecast | Geographic Relevance | Impact Timeline |
|---|---|---|---|
| AI-driven portfolio automation and real-time analytics adoption | +2.8% | National, with concentration in major financial centers and wealth hubs | Medium term (2-4 years) |
| Expansion of HNW and mass-affluent investable assets | +2.1% | National, with early gains in coastal states and Texas wealth corridors | Long term (≥ 4 years) |
| Democratization of private markets via tokenized and interval funds | +1.9% | National institutional and wealth channels with spillover to retail platforms in major metros | Medium term (2-4 years) |
| Corporate pension surplus redeployment to OCIO mandates | +1.5% | National, concentrated among S&P 500 sponsors with surplus-funded DB plans | Short term (≤ 2 years) |
| Active-ETF wrapper migration unlocking tax-efficient flows | +1.7% | National, particularly in high-tax states | Short term (≤ 2 years) |
| Workplace emergency-savings programs boosting cash AUM | +1.2% | National rollout via DC plan sponsors, faster among large enterprises | Medium term (2-4 years) |
| Source: Mordor Intelligence | |||
AI-Driven Portfolio Automation and Real-Time Analytics Adoption
Generative and agentic AI are moving from operational support to decision engines that assemble data, identify signals, and simulate outcomes for investment teams, which is compressing research cycles and expanding coverage across asset classes. Large United States technology firms' AI capital expenditure is on track to exceed USD 500 billion in 2026, accounting for nearly 25% of total United States market capex, and hyperscalers are generating an estimated USD 25 billion in incremental quarterly revenue from AI activity, growing at a 200% year-over-year pace. Managers are applying AI to ingest filings, transcripts, and alternative data to produce near real-time analytics and risk views that used to require weeks of manual effort, which is lifting throughput at a lower marginal cost per insight. The same techniques are enabling the electronification of less-liquid markets as language models parse credit and derivatives documents to accelerate price discovery and liquidity formation across OTC workflows[2]Citi Research, “AI in Investment Management: Beyond Efficiency Gains,” Citigroup, citigroup.com. At the product layer, AI is improving portfolio personalization and tax-aware trading inside active ETF wrappers and direct indexing programs that are now gaining broader platform acceptance. The overall effect is a widening gap between firms that modernize data and model infrastructure at scale and firms that cannot move beyond pilot deployments.
Expansion of HNW and Mass-Affluent Investable Assets
High-net-worth households now anchor growth strategies as wealth continues to consolidate and advisors expand their offering beyond portfolio construction to tax planning, estate coordination, and family services. Retail investors hold a significant portion of global assets, and their allocation to alternatives is expected to grow faster than institutional allocations in the coming decade, which is driving product and distribution innovation to serve this channel at scale. Private market firms are targeting this segment aggressively: retail investors hold nearly half of global AUM totaling USD 295 trillion, and alternative investment allocations from individual capital are projected to rise 12% annually over the next decade compared to 8% from institutional capital. Managers and platforms see meaningful revenue potential from retail participation in alternative strategies, so they are building education, simplified onboarding, and guardrails for liquidity and suitability to reduce friction for advisors. Asset managers are responding by expanding service models beyond traditional investment management: 98% of HNW practices now offer estate planning, 90% provide charitable planning, and 75% deliver family counseling services[3]BlackRock, “Corporate pensions,” BlackRock, blackrock.com. The net result is a larger addressable pool for alternatives and custom indexing, with wealth teams positioned as key gatekeepers for flows into private and hybrid exposures.
Democratization of Private Markets via Tokenized and Interval Funds
Policy and product changes are gradually lowering barriers to access in private markets, which is pulling retail and wealth channels into structures that balance return potential with periodic liquidity. Interval and tender-offer funds have become popular vehicles for private strategies in registered formats, and managers report a rising share of allocations being routed through these ’40 Act wrappers as advisor education improves. Secondary markets have expanded in depth and turnover, which supports price discovery and facilitates portfolio rebalancing in strategies that manage liquidity within policy ranges. Blockchain-enabled issuance and settlement are also gaining traction as large platforms demonstrate scale with cross-border transaction volumes that ease onboarding, KYC, and transfer agency workstreams for institutions and wealth platforms. Large alternative managers continue to set ambitious retail targets that depend on simplified distribution and education, with product engineering tuned to interval mechanics, cash flow management, and fee transparency. As the toolchain matures, tokenization and permissioned ledgers can reduce issuance and servicing costs, which can improve net returns for end investors when deployed with strong governance.
Corporate Pension Surplus Redeployment to OCIO Mandates
The aggregate funded status of United States corporate defined benefit plans among S&P 500 companies rose to an estimated 106% by December 2024, up from 101% at the end of 2023, driven by robust United States equity returns and GAAP accounting discount rates around 5.7%—the highest since 2009. Sponsors with surpluses are exploring OCIO models to access specialist teams and technology that align assets to liabilities, incorporate downside hedges, and oversee manager selection and fee negotiations across multi-asset portfolios. Demand for pension risk transfer solutions has remained firm, and plan stakeholders have used favorable rates and pricing dynamics to move obligations to insurers when governance objectives are met. The platform advantage is material where OCIO providers combine risk engines with alternatives origination and sourcing to support income and diversification. The trend is also reshaping consultant and manager relationships as plans request unified reporting and scenario analysis that compresses decision cycles[4]Goldman Sachs Asset Management, “Exploring Alternative Dimensions Across Private Markets in 2026,” GSAM, am.gs.com.
Restraints Impact Analysis*
| Restraint | (~) % Impact on CAGR Forecast | Geographic Relevance | Impact Timeline |
|---|---|---|---|
| Rising regulatory and cybersecurity compliance costs | -0.8% | National, intensified in major and regional financial centers under FINRA and SEC oversight | Medium term (2-4 years) |
| Ongoing fee compression from passive and robo propositions | -0.6% | National, most acute for mid-tier managers with commodity beta strategies | Long term (≥ 4 years) |
| Distribution-platform concentration is squeezing mid-size firms | -0.5% | National, strongest for managers without direct custodial access | Medium term (2-4 years) |
| Limited AI and technology adoption capacity among smaller firms | -0.4% | National, concentrated among firms with AUM below USD 10 billion, lacking scale | Medium term (2-4 years) |
| Source: Mordor Intelligence | |||
Rising Regulatory and Cyber-Security Compliance Costs
FINRA’s 2026 oversight report highlights how generative AI enables deepfakes, voice cloning, synthetic IDs, and adaptive malware that raise the bar for identity verification, monitoring, and incident response. Broker-dealers face mandatory daily customer reserve computations beginning June 30, 2026, which will force changes to funding processes, contingency plans, and liquidity stress testing across operations and treasury functions. Amendments to Regulation S-P heighten expectations for safeguarding customer information and notification protocols, with compliance dates in late 2025 and mid-2026, depending on firm size. The SEC’s examination priorities for 2026 elevate scrutiny on complex products, custody, and conflicts, which will require more robust documentation and testing across marketing, operations, and supervision. Enforcement actions have emphasized that weak controls can trigger penalties even without identified investor losses, which makes preventative security and governance investments non-negotiable. By January 2026, a growing patchwork of state privacy laws will increase the complexity of data inventories, vendor oversight, and automated decision-making disclosures that intersect with AI use cases.
Ongoing Fee Compression from Passive and Robo Propositions
Expense ratios in index equity funds have fallen dramatically over two decades while active fees have moderated at a slower pace, widening the relative pricing gap and pressuring revenues where differentiation is limited. Large passive providers benefit from scale economies and distribution reach that reinforce winner-take-most dynamics for flows, a pattern that has persisted across market cycles. Active ETFs carry a fee premium over passive ETFs, but competitive pressure is likely to test spread durability as more active managers convert or launch strategies in ETF wrappers. Scale leaders have used pricing moves to reinforce share gains, as seen in 2025 with large, multi-fund expense reductions that saved investors hundreds of millions of dollars. Wealth platforms and robo solutions are offering low or zero-advisory fee propositions, which shifts the burden of proof to advisors and active managers to show measurable value in planning, tax, and outcomes. This dynamic amplifies dispersion across managers, with scale and specialization emerging as the two durable competitive positions.
*Our forecasts treat driver/restraint impacts as directional, not additive. The impact forecasts reflect baseline growth, mix effects, and variable interactions.
Segment Analysis
By Asset Class: Alternative Assets Accelerate as Institutions Rebalance Beyond Liquid Beta
Equity commanded the largest share at 44.56% in 2025 within the United States asset management market share, while alternative assets are set to register the fastest growth at 14.62% CAGR from 2026 to 2031. Private markets have scaled as companies stay private longer and investors target illiquidity premia to diversify return sources beyond traditional beta. The United States asset management market benefits as managers distribute interval and tender-offer funds to wealth channels and add secondary solutions to improve liquidity profiles for clients. The United States asset management market also sees broadening adoption of active ETF wrappers that improve tax efficiency and speed time to market for systematic and fundamental strategies.
Within alternatives, private credit continues to gain share as direct lending and asset-based finance offer senior secured exposures with attractive spreads versus broadly syndicated loans and high yield benchmarks. Infrastructure demand is rising as data center growth, grid modernization, and energy transition spur capital formation in power generation and transmission, which supports long-dated, inflation-linked cash flows. Real estate has shown early signs of stabilization as net absorption trends improve and distress creates entry points for flexible credit solutions and hybrid capital. Other asset classes, including digital assets, have gained new distribution channels after regulatory approvals for spot crypto ETPs in early 2024, which catalyzed significant net inflows and created new options for exposure management. The United States asset management market is expected to maintain this multi-asset expansion as managers tailor structures to advisor workflows and household objectives.


By Firm Type: Wealth Advisory Firms Consolidate Distribution and Alpha-Generation Capabilities
Wealth advisory firms captured the largest share at 33.48% in 2025 and are also forecasted to be the fastest-growing cohort at 13.88% CAGR through 2031. The United States asset management market is increasingly intermediated by advisors who bundle planning, tax optimization, and access to alternatives for HNW families that are raising allocations to private strategies. Registered investment advisers have broadened services beyond investment management to include estate planning, charitable giving, and family governance, which helps defend pricing and deepen relationships. Banks leverage trust and custody capabilities to cross-sell asset management, but they face constraints tied to capital requirements and oversight that narrow proprietary risk-taking. The United States asset management market is also influenced by platform aggregators that provide technology, model portfolios, and capital support for M&A and succession, which helps independents compete with wirehouse networks.
Broker-dealers face increasing scrutiny under Regulation Best Interest as supervisors evaluate share class selection, complex products, and disclosures around conflicts and costs. This scrutiny pushes more firms to standardize due diligence and fee benchmarking, which can favor low-cost ETFs and model-based advice in core allocations. Other firm types, including pension consultants and family offices, are winning mandates for specialized alternative strategies and OCIO services as sponsors pursue risk alignment and operational scale. The United States asset management industry is therefore polarizing around scaled platforms and specialist boutiques, with mid-sized managers needing distribution partnerships and cost discipline to maintain competitiveness. Over the forecast horizon, advisory-led distribution is likely to remain the primary gatekeeper of flows into both public and private strategies.
By Mode of Advisory: Robo-Advisory Platforms Deploy Agentic AI to Compete on Customization
Human advisory maintained dominance with a 92.65% share in 2025, while robo-advisory is projected to grow at a 19.33% CAGR through 2031. Hybridization is advancing as incumbents equip advisors with generative AI tools for client summaries, meeting preparation, and portfolio diagnostics that boost capacity and consistency in advice delivery. Platform economics and conflicts of interest on certain digital platforms have drawn regulatory attention, which encourages greater transparency on sweep programs and affiliated fund selection. The United States asset management market size also gains from robo innovation, where agentic AI models synthesize spending data, life events, and risk tolerance to automate portfolio rebalancing within defined guardrails. In retirement channels, employees express growing demand for personalization and portability of savings features, which supports the adoption of model portfolios and plan-level advice tools.
Human advisory remains resilient where advisors deliver behavioral coaching, tax planning, and complex coordination across estates and businesses that automated engines cannot fully replicate. As AI reduces the cost of analysis and reporting, advisors can focus on synthesis, scenario planning, and implementation that tie investments to goals and cash flow needs. The United States asset management industry will therefore feature both low-cost automated solutions for simpler needs and high-touch models for complex households, with hybrid advice acting as the connective tissue between the two. Over time, pricing will align more closely with measurable outcomes and scope rather than asset-based fees alone. Managers who harmonize models, technology, and human insight are positioned to capture share as client expectations evolve.
By Client Type: Retail Demand Surges as Private Markets Access Democratizes
Institutional clients held a 64.72% share in 2025, while retail is expected to expand at a 15.49% CAGR through 2031 as high-net-worth households raise allocations to alternatives and custom indexing. The United States asset management market is being reshaped by retail participation in alternative strategies distributed through interval funds, evergreen vehicles, and secondaries that offer periodic liquidity and simplified onboarding. Private equity vehicles targeting wealth channels have grown, and allocation intentions suggest continued momentum over the next one to two years among existing HNW users. Recordkeepers and asset managers are also piloting structures to incorporate private market sleeves into defined contribution plans within prudent limits and fiduciary frameworks. The result is a broader range of exposures for retail investors, with education and advice serving as critical enablers of suitability and allocation pacing.
Institutional clients continue to dominate by asset value due to long-dated horizons and capacity for illiquidity, though growth is steadier as many portfolios operate within mature policy ranges. The United States asset management market will still see steady institutional demand for OCIO, private credit, infrastructure, and hedging programs that align assets to liabilities and regulatory capital considerations. Retail momentum is likely to remain above trend as personalization, tax-aware strategies, and access to alternatives expand through advisor-led distribution. Education, transparency, and risk controls will determine the durability of retail flows into complex strategies. Managers who calibrate liquidity, fees, and disclosures to household needs will be better placed to sustain growth.
By Management Source: Offshore-Delegated Assets Surge Amid Specialized Capability Gaps
Onshore-managed assets accounted for 87.61% share in 2025, while offshore-delegated assets are projected to grow at a 17.76% CAGR from 2026 to 2031 as institutions access specialized capabilities overseas. The United States asset management market is increasingly global in sourcing, with mandates delegated to non-U.S. managers for niche strategies such as distressed European credit, emerging market sovereigns, and frontier equities where local insights matter. Some investors use offshore vehicles for structural reasons while maintaining U.S.-based fiduciary oversight, reporting, and risk control. Managers also rely on cross-border blockchain-based settlement systems that streamline custody, FX conversion, and reconciliation for complex portfolios. EU-domiciled USD money market funds continue to reflect global demand for high-quality liquid assets, and non-EU investors hold a large share of these vehicles, which underscores the cross-border nature of cash management.
Onshore managers maintain advantages in U.S. tax, municipal bonds, and estate planning, which continue to anchor core wealth offerings and direct indexing solutions. Offshore delegation will expand where U.S. capacity is limited and where specialist managers can add alpha net of fees, currency, and transaction costs. The United States asset management market will likely balance onshore control with targeted offshore execution as governance models mature for complex portfolios. Technology that standardizes data and reporting across domiciles can reduce friction for allocators and auditors. The resulting mix should support both diversification and operational discipline across large pools of capital.
Geography Analysis
Regional growth patterns inside the United States reflect wealth concentration, advisor density, and differing tax regimes that shape product demand and wrapper selection. Coastal financial centers anchor institutional mandates and alternative expertise, while fast-growing wealth corridors in Texas, Florida, and the Carolinas are expanding advisor-led distribution that pulls through ETFs, SMAs, and private strategies. High-tax states exhibit strong demand for tax-aware direct indexing and municipal bond strategies, in parallel with active ETFs that deliver tax efficiency through in-kind transfers. Active ETFs drew a large share of 2025 flows relative to assets, and active fixed income ETFs gathered USD 146 billion as investors sought yield and liquidity with tax benefits. The United States asset management market will continue to experience growth along RIA hubs and retirement centers where demographic and tax factors amplify advice demand.
Midwest and Southeast regions with concentrations of corporate pension plans are adopting OCIO solutions to align assets with liabilities after improved funded status in 2025. As sponsors de-risk, they rely on governance, analytics, and diversified alternatives to manage funded ratio volatility and contribution risk. Advisors in these regions also see steady take-up of model portfolios and fixed income ETFs that balance income needs with drawdown control in retirement accounts. The United States asset management market benefits from employer adoption of emergency-savings features that stabilize participant cash balances and improve engagement, which can support glidepath funding and liquidity sleeves in DC plans. Over time, regional dispersion will track advisor density and employer plan sophistication, which are both rising in Sunbelt states. This creates a favorable backdrop for planners and asset managers that can unify advice, investments, and tax optimization.
The digital asset segment is now represented on mainstream brokerage and RIA platforms following regulatory approvals for spot crypto ETPs in early 2024. Net inflows to crypto-related ETFs surged in 2024, and the United States asset management market has responded with expanded product shelves and model integrations to manage volatility and sizing within diversified portfolios. The largest products scaled quickly, which supported better trading spreads and primary market operations that facilitate liquidity management for advisors. As the regulatory framework evolves, platform acceptance and portfolio construction standards are expected to follow, especially where products meet tax and operational requirements for advisory workflows. Managers continue to emphasize education and risk disclosures to align client expectations with the profile of digital assets inside balanced allocations.
Competitive Landscape
The United States asset management industry exhibits high concentration with accelerating consolidation around scaled platforms with cost advantages and around specialist managers with distinct sourcing or technology, while mid-sized firms face fee pressure and distribution hurdles. Scale leaders can deploy pricing actions that draw flows and raise the threshold for rivals, as reflected in broad expense cuts across large fund families in 2025. Strategic investments in RIA ecosystems and advisor enablement tools are redefining how product manufacturers access end clients and how advisors source models and capital for growth. Technology deployment is now a differentiator as 2026 begins, with more firms investing in AI for research, risk, and client service, even as budget allocations remain small at many organizations. The United States asset management market is also seeing increased alignment between active ETF launches and model delivery, which compresses time from product concept to client usage. As consolidation proceeds, buyers seek alternative capabilities, private wealth reach, and technology that lowers per-unit costs at scale.
Large alternative managers are extending their use of hybrid capital and joint ventures to pursue complex transactions that require scale, sector expertise, and long-dated funding. A 2025 agreement by Apollo-managed funds and Brookfield with Japanese partners to acquire a large aircraft lessor signaled the depth of private capital available for specialized corporate assets. The United States asset management market benefits as investors diversify across private equity, infrastructure, and private credit, and as managers create evergreen and interval structures that fit wealth channels. Digital infrastructure is a prominent theme as data center demand and grid upgrades pull through financing across debt and equity structures, with managers competing on sourcing, operations, and risk control. Product innovation in active ETFs, including fixed income and multi-sector exposures, supports model-based solutions that respond quickly to rate and credit conditions. Managers using AI to compress research and reporting cycles are gaining speed advantages that compound over time and can translate into better client service and mandate retention.
Whitespace opportunities are visible in small and mid-cap private equity, private credit financing of commercial real estate transitions, and infrastructure aligned to the power needs of AI and electrification. CRE debt maturities into 2026 create demand for private credit and hybrid structures that can meet complex refinancing needs, which aligns with the sourcing strengths of alternative platforms. Power sector load growth projections suggest sustained capital formation in generation and grid, which supports infrastructure allocations for long-term investors. Blockchain-enabled cross-border settlement is reducing friction for institutional and wealth flows, and large-bank platforms have now processed large volumes that demonstrate production readiness. Alliances between index leaders and active managers are expanding access to institutional-caliber private exposures in multi-asset formats that are designed for outcome-oriented portfolios. The United States asset management market will continue to reward firms that align product design, distribution, and technology with evolving client needs and regulatory expectations.
United States Asset Management Industry Leaders
Vanguard Group
BlackRock Inc.
Fidelity Investments
State Street Global Advisors
J.P. Morgan Asset Management
- *Disclaimer: Major Players sorted in no particular order

Recent Industry Developments
- October 2025: Franklin Templeton closed its deal to acquire pan-European private credit firm Apera Asset Management, boosting its alternative credit AUM and expanding global private credit capabilities.
- September 2025: Apollo Global Management finalized its previously announced all-stock acquisition of Bridge Investment Group, adding Bridge as a platform company within Apollo’s asset management business while retaining its brand and leadership team.
- March 2025: BlackRock introduced a bitcoin ETP in Europe, listing on multiple European exchanges as part of its digital assets expansion following United States success.
- January 2024: The United States Securities and Exchange Commission approved multiple spot Bitcoin ETPs, including BlackRock’s iShares Bitcoin Trust, marking a historic step in regulated crypto investment access.


Research Methodology Framework and Report Scope
Market Definitions and Key Coverage
Our study defines the United States asset management market as the entire pool of client assets that are professionally invested, administered, or advised by SEC-regulated managers. This spans pooled vehicles, mutual funds, ETFs, CITs, hedge funds, private equity, real estate, and private credit, together with model-based SMAs, trust mandates, and robo portfolios, provided the manager exercises some discretionary or advisory authority. Assets are counted once at market value, whether managed on-shore or through U.S.-domiciled offshore master funds.
We leave out self-directed brokerage balances, insurer general-account reserves, corporate treasury cash, and assets that are only in custody without portfolio oversight.
Segmentation Overview
- By Asset Class
- Equity
- Fixed Income
- Alternative Assets
- Other Asset Classes
- By Firm Type
- Broker-Dealers
- Banks
- Wealth Advisory Firms
- Other Firm Types
- By Mode of Advisory
- Human Advisory
- Robo-Advisory
- By Client Type
- Retail
- Institutional
- By Management Source
- Offshore
- Onshore
Detailed Research Methodology and Data Validation
Primary Research
We interviewed senior portfolio strategists at wealth advisers, plan sponsors, and fund administrators across New York, Chicago, San Francisco, and Charlotte, then followed up with surveys of mid-tier RIAs. Their insights helped us stress-test fee-compression assumptions, validate robo-advice adoption rates, and benchmark average account sizes that are missing from public filings.
Desk Research
Mordor analysts gathered baseline data from tier-one public sources such as the Investment Adviser Association, Federal Reserve Flow of Funds, SEC Form ADV filings, and U.S. Census capital-market tables; these reveal adviser counts, product splits, and historical AUM growth. Trade associations, including the Investment Company Institute and the Alternative Investment Management Association, provided series on ETF inflows, mutual-fund share class shifts, and private-fund leverage. To enrich those datasets, we drew on Dow Jones Factiva for deal news and D&B Hoovers for manager revenue curves, while Questel patent searches flagged innovation intensity in tokenization tools. These sources illustrate trends yet remain illustrative, not exhaustive, of the wider body consulted.
Market-Sizing & Forecasting
The 2025 baseline was anchored with a top-down reconstruction of U.S. professionally-managed assets in public filings and Flow-of-Funds tables, which are then cross-checked with sampled bottom-up roll-ups of leading manager AUM disclosures and channel checks on average account sizes. Key variables include equity-market capitalization, ETF penetration, retirement-plan contribution flows, private-fund fundraising tallies, interest-rate paths, and advisory-fee compression. A multivariate-regression forecast ties those drivers to projected AUM, while scenario analysis captures upside from tokenized funds and downside from tighter fiduciary rules. Gaps in manager roll-ups are bridged by applying median asset-turnover ratios from interviewed RIAs.
Data Validation & Update Cycle
Outputs pass a three-layer review, analyst, senior analyst, and domain lead, before publication. We rerun anomaly checks against new ICI flow data each quarter, and the entire model refreshes annually or sooner if a material regulatory event occurs.
Why Our US Asset Management Baseline Inspires Confidence
Published estimates often diverge because firms track different asset pools, apply varied duplication adjustments, and refresh their models on dissimilar calendars.
Key gap drivers include whether sub-advised assets are double-counted, if Canadian pools are blended into a North America roll-up, the choice of revenue versus AUM as a metric, and the speed at which fee compression is embedded. Mordor's disciplined scope, annual refresh, and dual-layer asset verification yield the dependable baseline decision-makers need.
Benchmark comparison
| Market Size | Anonymized source | Primary gap driver |
|---|---|---|
| 63.28 trn (2025) | Mordor Intelligence | - |
| 144.6 trn (2024) | Global Consultancy A | Counts duplicated sub-advised assets and non-discretionary custody balances |
| 77.8 trn (2023) | Industry Association B | Covers only top 500 managers and includes Canada while omitting smaller RIAs |
| 165.02 bn (2024) | Trade Journal C | Reports fee revenue from investment banking and advisory, not client AUM |
In summary, the gaps arise from scope stretch, metric mismatch, and older base years. By selecting a clear asset universe, blending authoritative data with on-ground interviews, and updating on a fixed cadence, Mordor Intelligence delivers a balanced market baseline that investors and planners can trust.


Key Questions Answered in the Report
What is the United States asset management market growth outlook to 2031?
The United States asset management market size is projected at USD 70.97 trillion in 2026 and USD 125.98 trillion by 2031, reflecting a 12.16% CAGR.
Which segments will grow fastest between 2026 and 2031?
Alternative assets, robo-advisory, retail clients, and offshore-delegated mandates are expected to lead growth, with CAGRs of 14.62%, 19.33%, 15.49%, and 17.76% respectively.
What is driving the surge in active ETF adoption?
Tax efficiency from in-kind transfers, rapid product iteration, and the SEC’s multi-share class ETF approval are fueling flows into active ETF formats, especially in fixed income.
How are regulatory changes shaping manager priorities in 2026?
FINRA’s 2026 report, daily reserve computations, and tightened data protection standards are raising compliance costs and steering investment toward governance, cybersecurity, and documentation.
Where are the most attractive private market opportunities now?
Private credit tied to CRE transitions, small and mid-cap private equity, and infrastructure for power and data centers are key focus areas, supported by long-dated demand drivers.
How are advisors defending fees against robo and passive alternatives?
Advisors are leaning on holistic planning, tax-aware strategies, and access to alternatives, while hybrid AI-enabled tools improve personalization and productivity to sustain value delivery.
Page last updated on:


