
Technology, Media and Telecom
5th MayPricing Strategy for Semiconductor Components
3 Min Read
The US Automatic Content Recognition Market Report Segments the Industry Into by Component (Software and Services), Content Type (Audio, Video, Text, and Image), Platform (Smart TV, Linear TV, OTT / CTV Apps, and Other Platforms (set-Top Boxes, In-Car, Etc. )), Industry Vertical (Media and Entertainment, Information Technology and Telecommunications, and More), End-Use (Content Enhancement, Audience Measurement, and More).
Market Overview
| Study Period | 2020 - 2031 |
|---|---|
| Base Year For Estimation | 2025 |
| Forecast Data Period | 2026 - 2031 |
| Market Size (2026) | USD 1.29 Billion |
| Market Size (2031) | USD 2.24 Billion |
| Growth Rate (2026 - 2031) | 11.72 % CAGR |
| Market Concentration | Medium |
Major Players *Disclaimer: Major Players sorted in no particular order. Image © Mordor Intelligence. Reuse requires attribution under CC BY 4.0. |
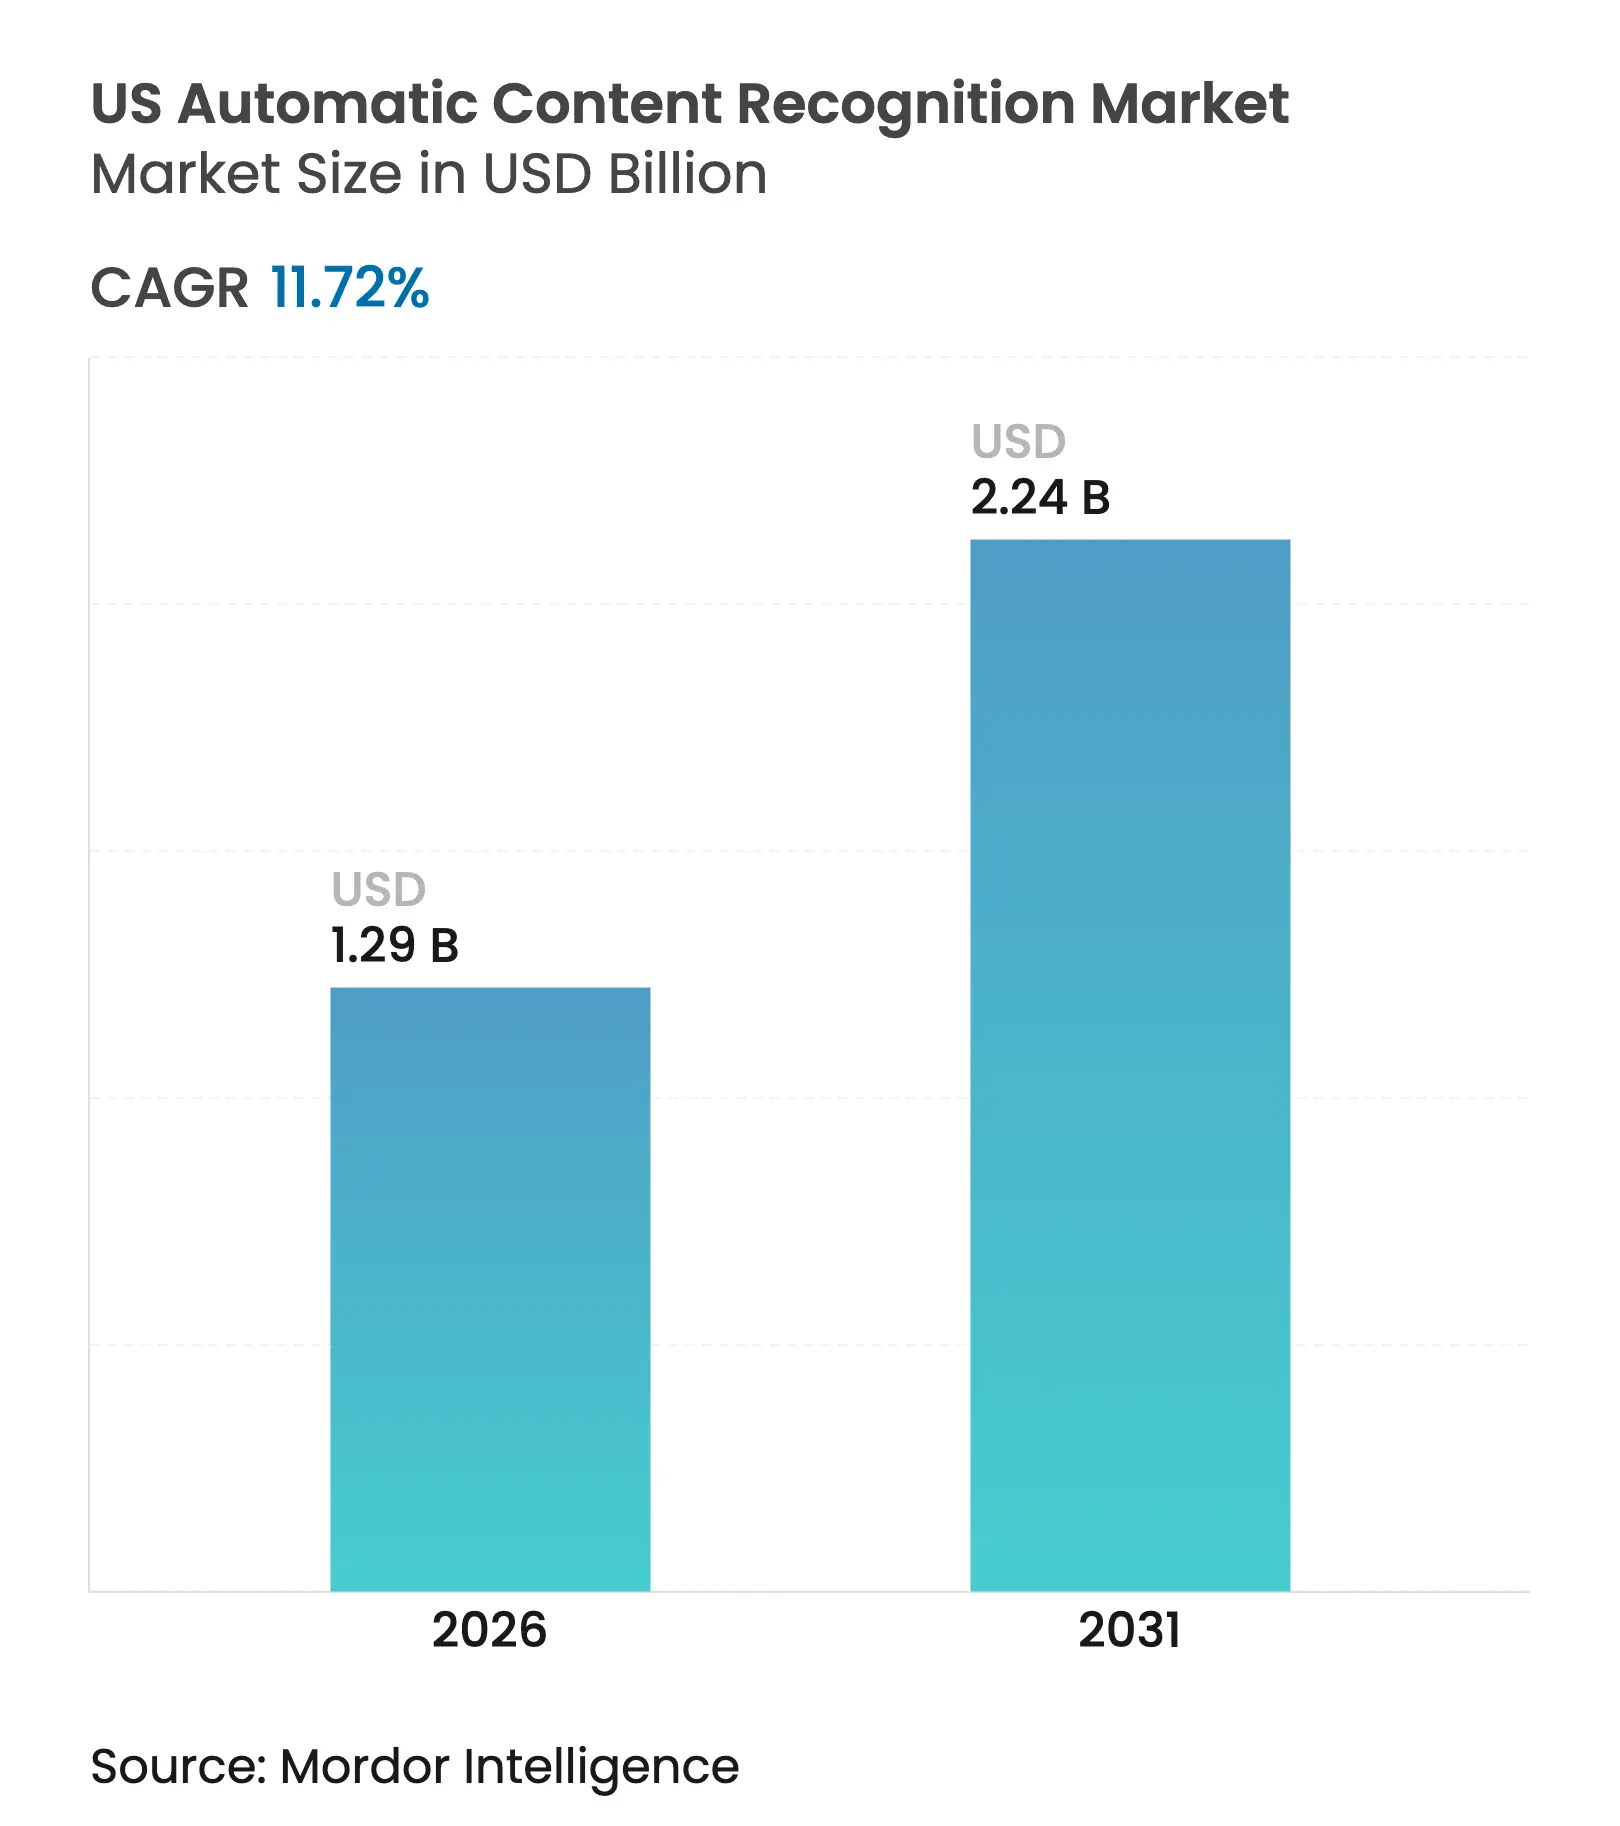
The US automatic content recognition market size was valued at USD 1.15 billion in 2025 and estimated to grow from USD 1.29 billion in 2026 to reach USD 2.24 billion by 2031, at a CAGR of 11.72% during the forecast period (2026-2031). Escalating smart-TV adoption, second-by-second audience measurement mandates, and the rapid migration of ad dollars from linear television to connected environments are expanding demand for image, audio, and video fingerprinting at scale. Streaming platforms now require unified cross-device attribution that legacy panel systems cannot deliver, while advertisers push for deterministic data sets that link exposure to purchase. At the same time, a patchwork of state privacy statutes rewards providers that invest in transparent consent flows and on-device processing. Patent settlements and rising GPU costs increase barriers to entry, keeping competitive intensity moderate even as new verticals such as automotive and retail media unlock incremental revenue streams.
Key Report Takeaways
Note: Market size and forecast figures in this report are generated using Mordor Intelligence's proprietary estimation framework, updated with the latest available data and insights as of 2026.
Drivers Impact Analysis
| Driver | ( ~ ) % Impact on CAGR Forecast | Geographic Relevance | Impact Timeline | |||
|---|---|---|---|---|---|---|
OTT boom catalysing data-driven ad spend OTT boom catalysing data-driven ad spend | +3.2% | National urban hubs | Medium term (2-4 years) | ( ~ ) % Impact on CAGR Forecast:+3.2% | Geographic Relevance:National urban hubs | Impact Timeline:Medium term (2-4 years) |
Smart-TV base crosses 80% of US households Smart-TV base crosses 80% of US households | +2.8% | Nationwide | Short term (≤ 2 years) | |||
Mandatory Nielsen alternative currency roll-out Mandatory Nielsen alternative currency roll-out | +1.9% | Nationwide | Medium term (2-4 years) | |||
Retail-media networks licensing ACR data sets Retail-media networks licensing ACR data sets | +1.5% | Nationwide retail hubs | Long term (≥ 4 years) | |||
Auto OEM pivot to in-car entertainment analytics Auto OEM pivot to in-car entertainment analytics | +0.8% | Premium vehicle segments | Long term (≥ 4 years) | |||
Granular consent clauses lift opt-in rates Granular consent clauses lift opt-in rates | +0.6% | California first | Medium term (2-4 years) | |||
| Source: Mordor Intelligence | ||||||
OTT Boom Catalysing Data-Driven Ad Spend
Connected-TV ad spend doubled between 2023 and 2025 as nearly half of all streaming subscriptions adopted advertising-supported tiers, redirecting budgets toward deterministic measurement environments that the US automatic content recognition market uniquely supports[1]Roku Inc., “Roku Announces Q4 2024 Financial Results,” roku.com. Roku generated USD 3.5 billion in advertising revenue in 2024, underscoring the commercial value of second-by-second viewing data. Disney’s ad-exchange now merges purchase signals from Walmart Connect with household-level viewing fingerprints, giving marketers closed-loop attribution previously unavailable in linear television. As agencies demand proof of incremental reach, ACR suppliers that tie exposure to outcomes secure premium CPMs, reinforcing a virtuous cycle of investment in recognition accuracy.
Smart-TV Base Crosses 80% of US Households
More than 80% of US homes owned a smart-TV by early 2025, turning televisions into always-on sensors that feed the US automatic content recognition market with continuous data streams. LG reported record Q1 2025 revenue of KRW 22.7 trillion (USD 17.2 billion) with platform-media revenue outpacing hardware sales, driven by ACR-enabled advertising on its webOS units. Samsung’s 2024 OLED range embedded Arm Cortex-A78 CPUs to run on-device fingerprinting, lowering cloud fees and latency. While Apple TV refrains from ACR in favor of a privacy-led value proposition, competing OEMs monetize data to subsidize hardware pricing, reinforcing adoption.
Mandatory Nielsen Alternative Currency Roll-Out
The Joint Industry Committee certified Comscore and VideoAmp as transactional currencies in 2024, ending Nielsen’s monopoly and making big-data panels backed by ACR indispensable to national TV deals. Broadcast networks now sell inventory on second-by-second impressions, driving integration of VIZIO Inscape and LG Ad Solutions datasets into automated buying platforms. Yahoo’s DSP integration with iSpot.tv further normalizes multi-currency settlements, fueling sustained growth in the US automatic content recognition market as advertisers seek cross-publisher consistency.
Retail-Media Networks Licensing ACR Datasets
Retailers from Amazon to Walmart license smart-TV viewing logs to correlate on-screen exposure with in-store and e-commerce purchases, elevating ACR from media metric to commerce signal. LG Ad Solutions now enriches 200 million smart-TVs with Experian household data, enabling SKU-level addressability. Amazon and Roku’s June 2025 pact created an authenticated CTV footprint covering 80% of households, giving retail-media buyers unmatched reach. Such integrations enlarge the usable data pool and lift the long-term growth curve for the US automatic content recognition market.
Restraint Impact Analysis
| Restraint | ( ~ ) % Impact on CAGR Forecast | Geographic Relevance | Impact Timeline | |||
|---|---|---|---|---|---|---|
Patchwork state privacy laws raise compliance costs Patchwork state privacy laws raise compliance costs | -2.1% | California first | Short term (≤ 2 years) | ( ~ ) % Impact on CAGR Forecast:-2.1% | Geographic Relevance:California first | Impact Timeline:Short term (≤ 2 years) |
Degrading third-party cookie signals slow cross-device graphing Degrading third-party cookie signals slow cross-device graphing | -1.8% | Nationwide | Medium term (2-4 years) | |||
Patent-licensing disputes over video fingerprinting Patent-licensing disputes over video fingerprinting | -1.2% | Tech hubs | Long term (≥ 4 years) | |||
GPU-compute inflation squeezes real-time ACR margins GPU-compute inflation squeezes real-time ACR margins | -0.9% | Global hardware chains | Medium term (2-4 years) | |||
| Source: Mordor Intelligence | ||||||
Patchwork State Privacy Laws Raise Compliance Costs
California’s Consumer Privacy Rights Act amendments require detailed disclosures for automated decision systems, forcing every ACR supplier to rebuild consent layers and audits. Because each state drafts divergent rules, firms must segment datasets by jurisdiction, driving up operational expenses and elongating sales cycles. LG’s 27-step opt-out flow typifies how OEMs technically comply while deterring mass opt-outs, yet smaller vendors lack such engineering resources. Investment in privacy engineering therefore becomes a gatekeeper, tilting market share toward incumbents and trimming near-term margins across the US automatic content recognition market.
GPU-Compute Inflation Squeezes Margins for Real-Time ACR
NVIDIA projects USD 120 billion in data-center revenue for 2025, selling AI accelerators at USD 30,000 each—a cost curve that directly impacts providers running cloud fingerprinting pipelines. As AWS and Azure raise on-demand GPU pricing, television OEMs shift to on-device inference despite higher bill-of-materials. While edge computation lowers latency and back-haul fees, it demands more expensive chipsets and firmware cycles, compressing hardware margins and slowing upgrades. Firms without vertical integration struggle to absorb volatility, introducing execution risk into long-range forecasts for the US automatic content recognition market.
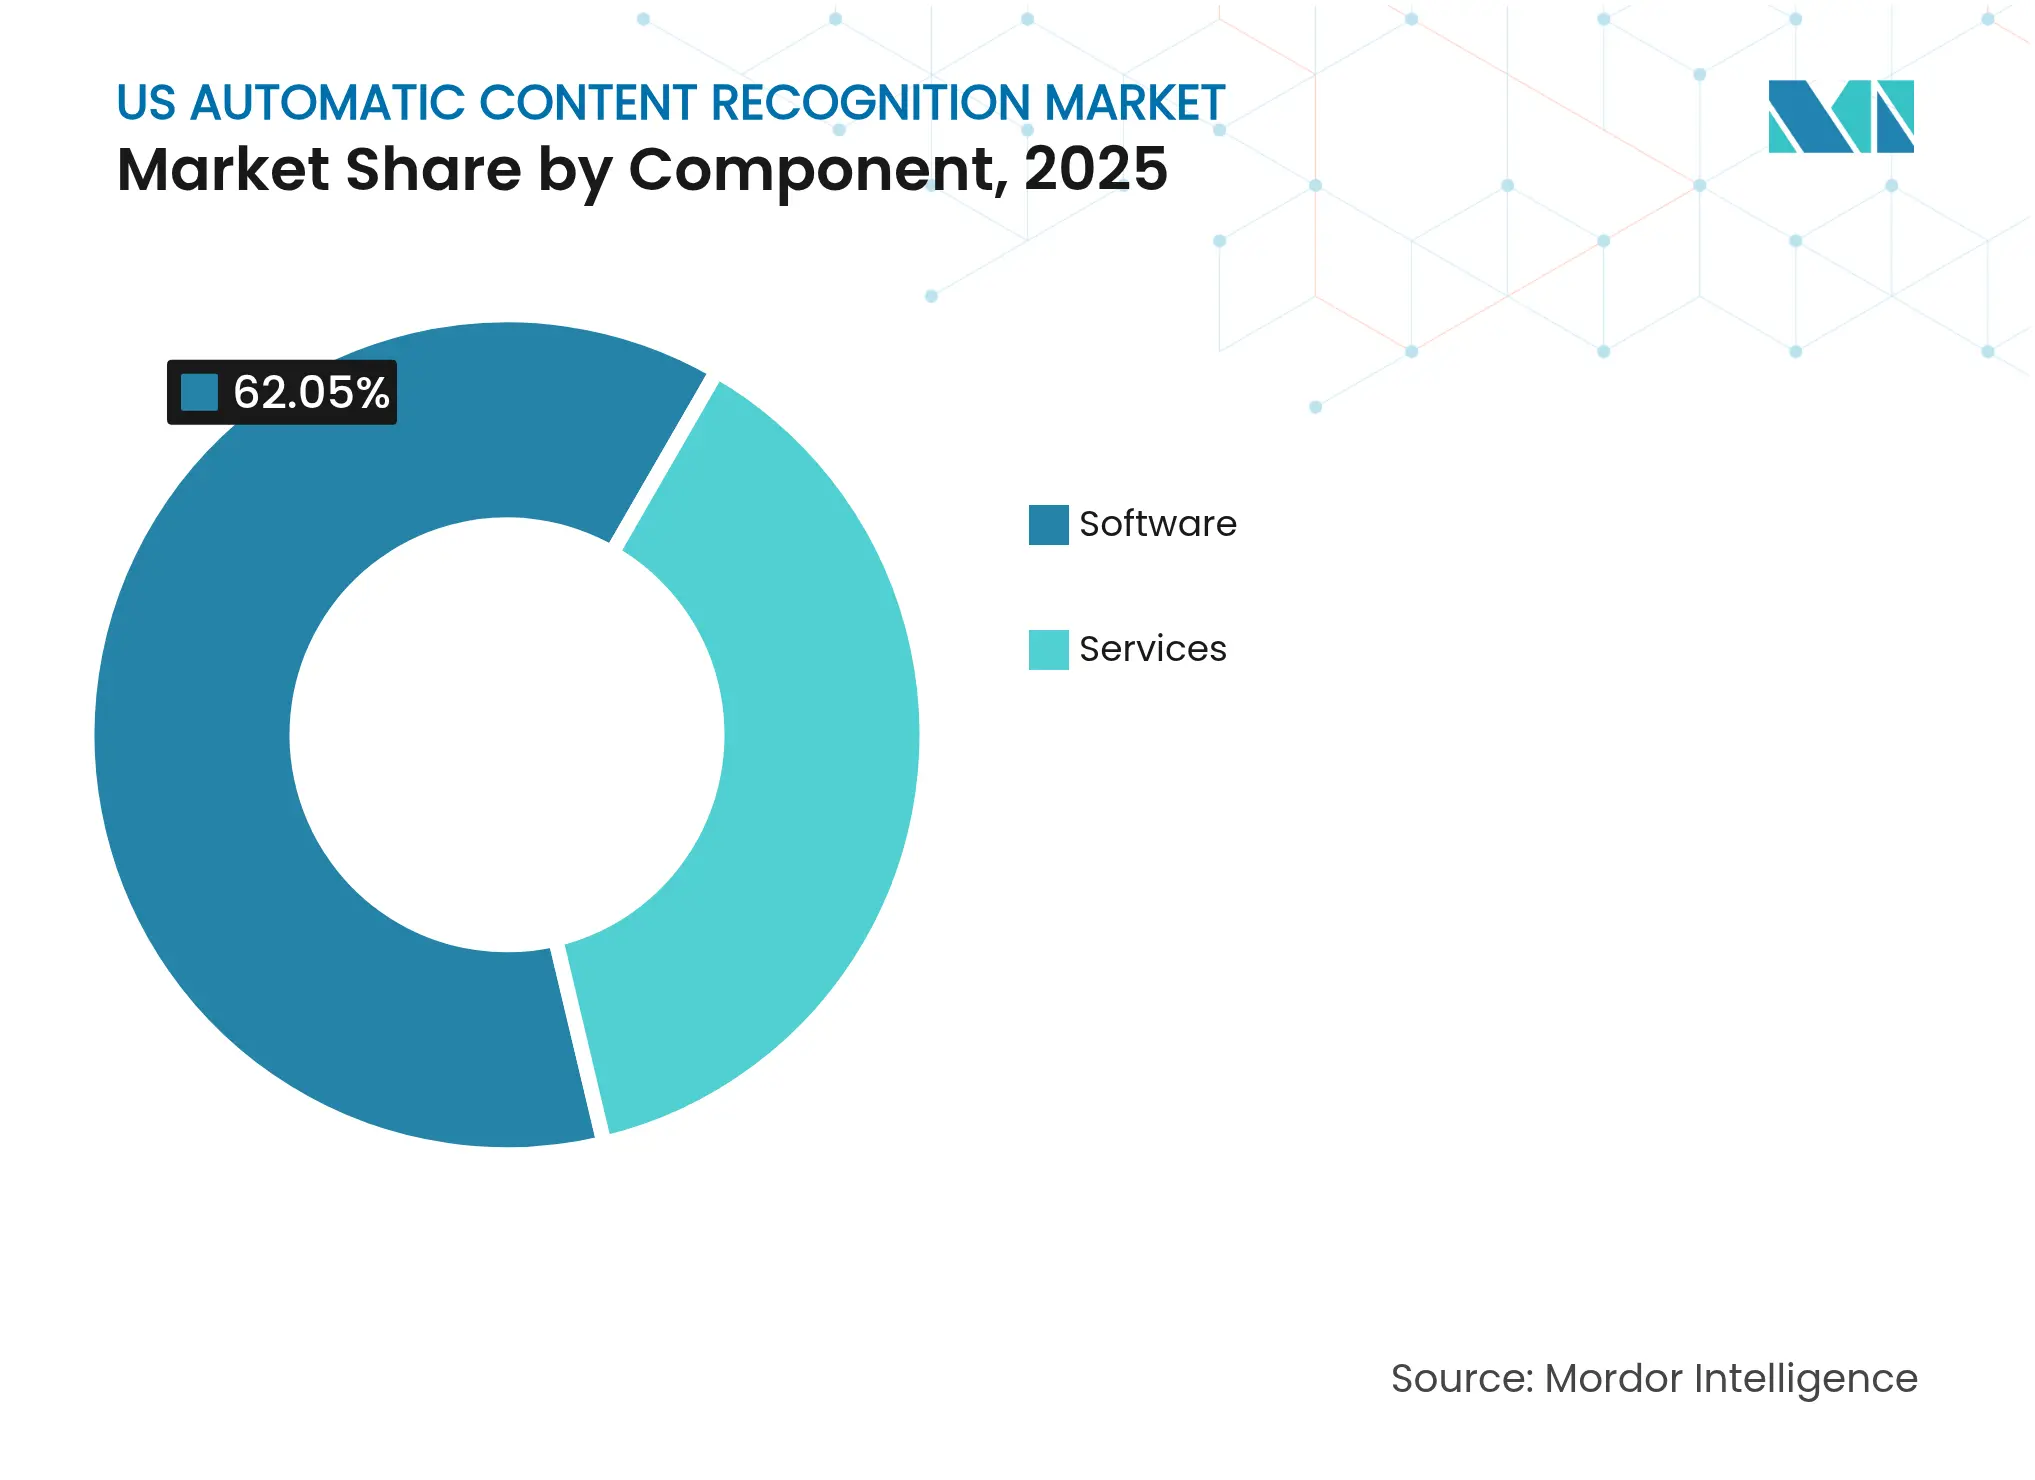
By Component: Services Scale as Compliance Complexities Rise
The software layer delivered 62.05% of US automatic content recognition market revenue in 2025 through licensing of video, audio, and image fingerprint engines that sit inside smart-TV operating systems. Yet services are projected to post an 17.92% CAGR through 2031 as brand clients and OEMs outsource data governance, consent management, and model retraining. Managed offerings from Gracenote and Audible Magic integrate seamlessly with broadcast automation stacks, allowing networks to adopt cross-platform measurement without standing up internal data science teams. Continuous regulatory updates, especially in privacy and AI transparency, further tip demand toward service providers capable of rapid compliance pivots. Over the forecast horizon, hybrid models that bundle SDKs with managed analytics are expected to dominate sales cycles, cementing a recurring-revenue profile for the US automatic content recognition market.
Vendors expand catalog coverage beyond traditional television, adding social-video, podcast, and retail-media fingerprints to create multi-modal datasets. Gracenote’s 2025 partnership with four leading connected-TV OEMs bundles contextual ad targeting with frame-level metadata, illustrating how service depth becomes a competitive differentiator. Audible Magic’s turnkey rights-administration package for SoundCloud and Udio addresses demand in user-generated music platforms, underscoring service-segment versatility. The convergence of rights clearance, metadata enrichment, and privacy tooling helps services grow faster than pure-play licensing even as the overall US automatic content recognition market size expands steadily.
Note: Segment shares of all individual segments available upon report purchase
By Content Type: Image Recognition Emerges from Video’s Shadow
Video fingerprinting retained 54.05% revenue leadership in 2025, buoyed by compulsory currency transitions across national broadcasters. Image recognition, however, is projected for a 22.95% CAGR, enabled by ever-cheaper vision transformers now embedded in smart-TV chips and storefront cameras. Retailers adopt shelf-level imaging to match on-screen ads with in-store behavior, effectively converting the television into a digital end-cap. Disney and Universal’s 2025 litigation against AI image generator Midjourney underscores the rising need for robust visual recognition to enforce IP across generative media.
As image modules gain traction, bundled platforms offering vision, audio, and text fingerprints create upsell paths, enlarging the total addressable pool for the US automatic content recognition market. Pex’s singer-identifier API demonstrates expansion into creator-economy workflows, while Dolby’s Dolby Atmos integrations in GM vehicles show cross-media synergies in immersive contexts. Multi-modal capability is therefore set to become table stakes, lifting ASPs and protecting incumbents against commoditization.
By Platform: OTT/CTV Outpaces Still-Dominant Smart-TV Footprint
Smart-TVs generated 64.60% of US automatic content recognition market size in 2025, owing to guaranteed hardware-level data capture and direct manufacturer consent flows. Yet OTT and CTV apps, fueled by Netflix, Hulu, and Peacock, will grow at a 24.4% CAGR to 2031 as streaming services retrofit ACR to optimize ad insertion and viewer personalization. Netflix’s June 2025 programmatic pact with Yahoo underscores how pure-play OTT providers race to match linear-like measurement fidelity.
Because glass-to-glass viewing spans multiple devices, vendors with SDKs that travel from living-room TV to mobile companion app gain share. Amazon-Roku authentication across 80% of households shows data-graph power at scale, a capability not easily matched by single-OEM footprints. Automotive infotainment edges into the conversation through HARMAN-Dolby tie-ups, further fragmenting platform targets yet broadening the revenue pool for agile ACR suppliers.

Recognized by Experts. Trusted by Leaders.
A trusted intelligence partner to global decision-makers across 90+ countries.


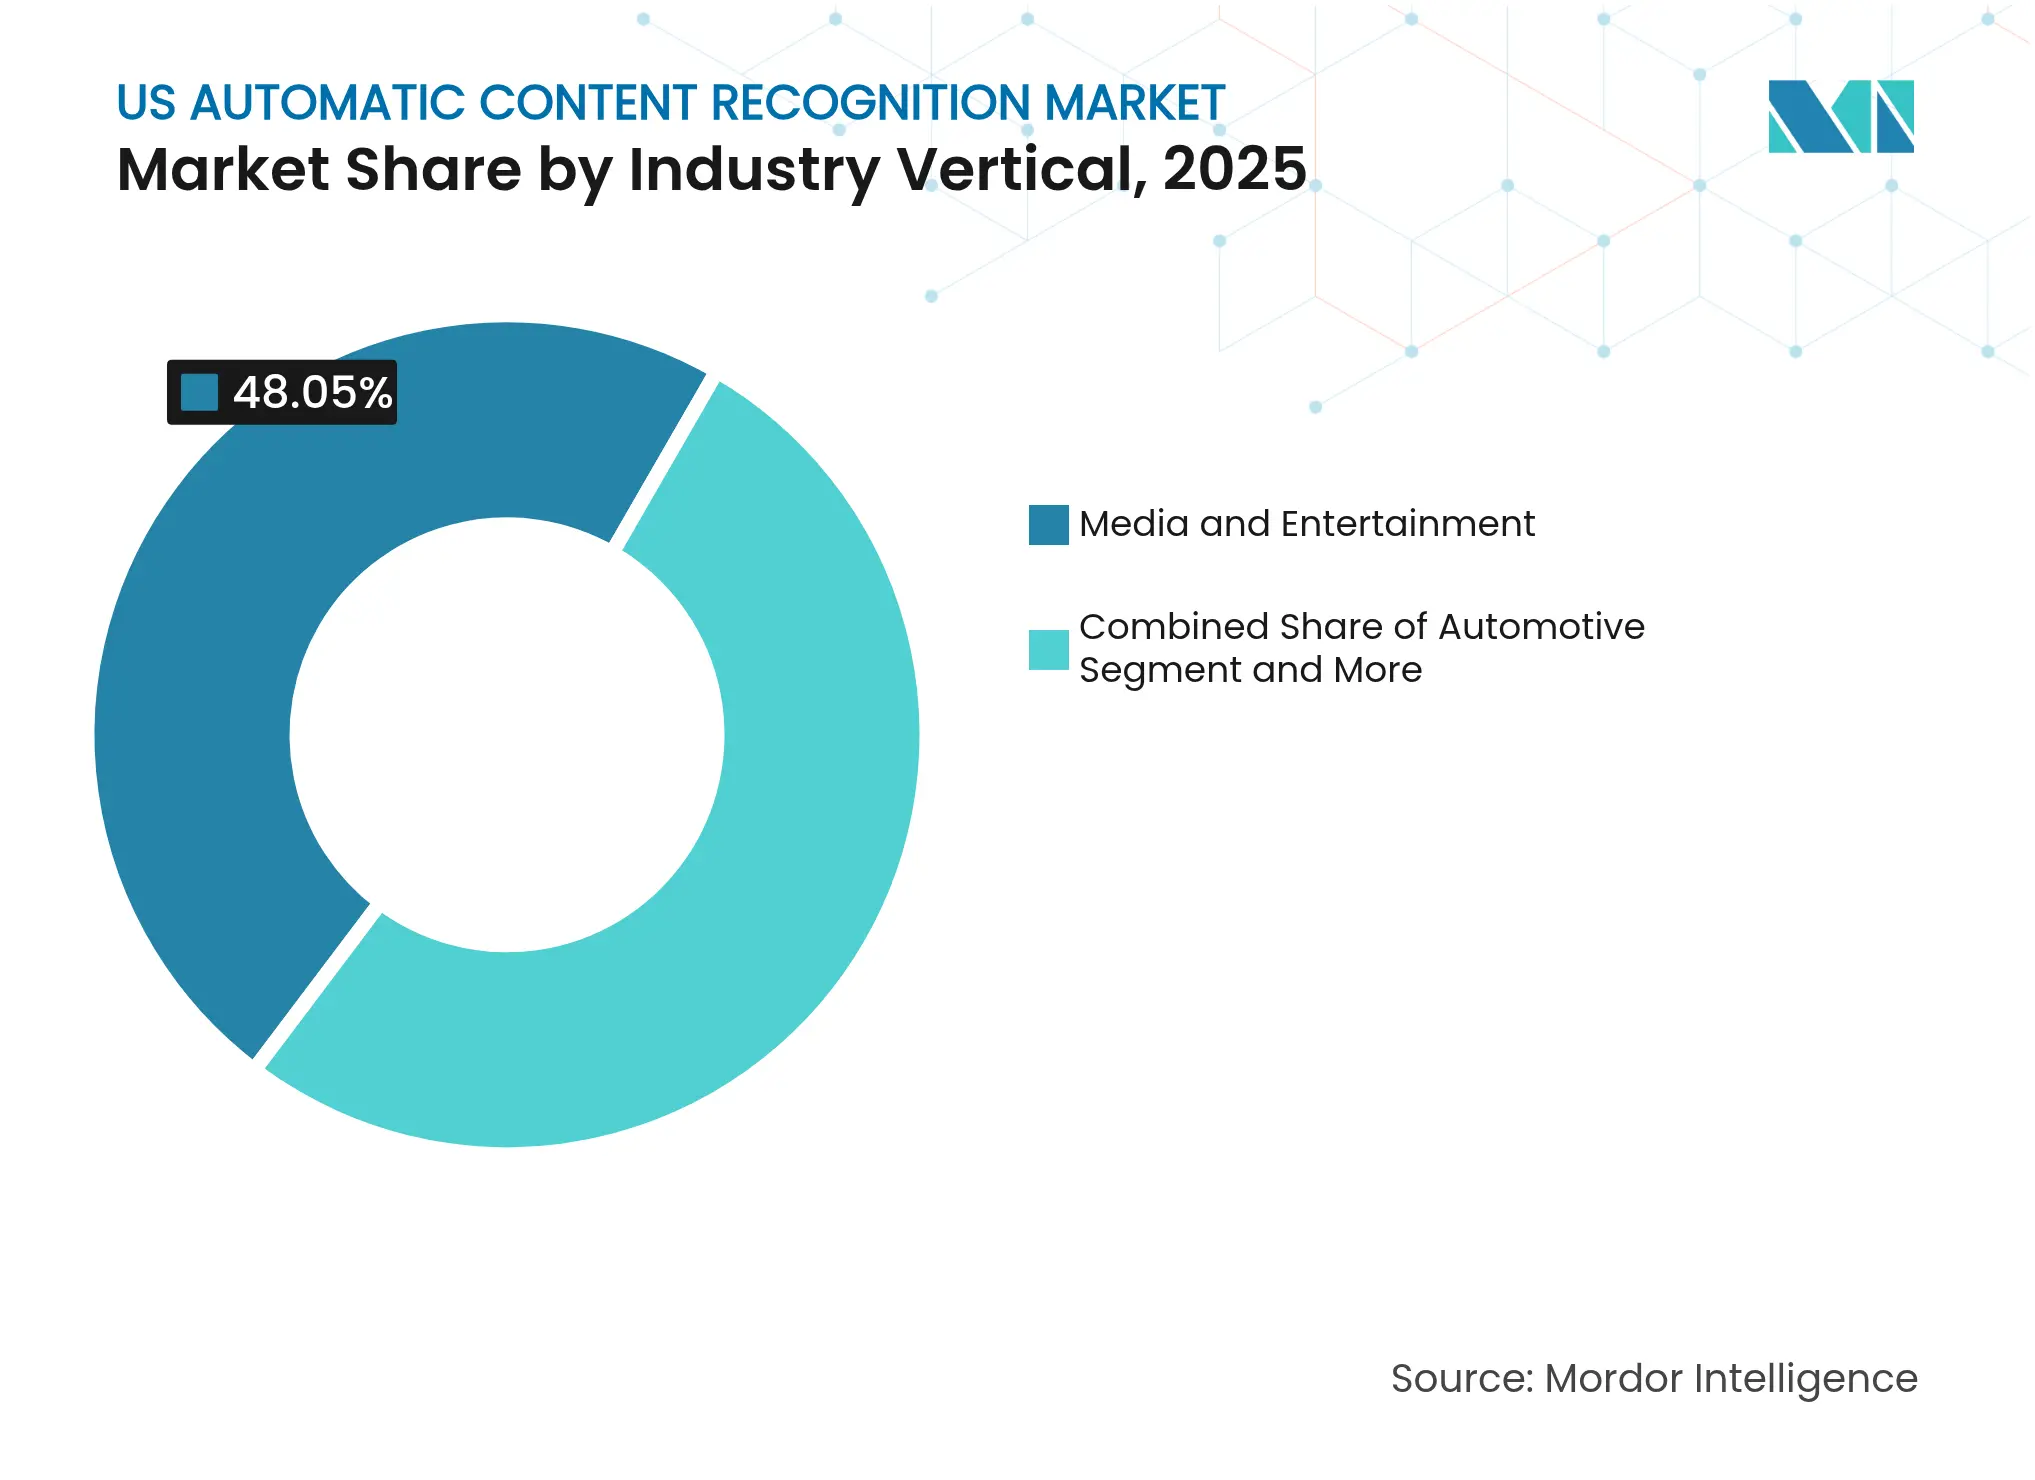
By Industry Vertical: Automotive Unlocks Next Growth Wave
Media and entertainment contributed 48.05% of 2025 revenue and remains foundational, but carmakers now embed fingerprinting to optimize cabin content and monetize passenger attention. General Motors named HARMAN a 2024 Supplier-of-the-Year for its cabin analytics stack that includes Dolby Atmos-ready recognition, signaling OEM appetite for data-driven in-car experiences. Ford’s Android Automotive rollout balances branded interface control with app-store access, setting a precedent for blended data ownership between automaker and third-party developers.
Telecom operators bundle ACR inside set-top boxes to retain ad budgets, while retailers refine shelf-level targeting using television exposure data. Government agencies deploy recognition for compliance monitoring, expanding public-sector demand. Vertical diversification cushions suppliers from media-cycle volatility, enlarging lifetime value and reinforcing the long-term expansion path of the US automatic content recognition market.
Note: Segment shares of all individual segments available upon report purchase
By End-Use: Ad-Tracking Surges Past Audience Measurement
Audience measurement still commands 42.60% revenue because networks require impression validation to transact, but growth now pivots to ad-tracking, forecast at 21.9% CAGR through 2031. The Association of National Advertisers’ Aquila project standardizes cross-media attribution, spurring publishers to feed ACR logs into advertiser clean rooms ana.net. Music Reports’ 2025 acquisition of Blokur highlights rights-administration synergies, extending fingerprinting utility beyond marketing into royalty flows.
Content filtering, broadcast compliance, and enhancement tools — from automatic subtitle generation to contextual ad overlay — add incremental volume. Monarrch’s AI-based royalty engine for TikTok creators illustrates how new monetization models rely on frame-level matching to guard revenue side. By widening the solution set, suppliers hedge regulatory risk while capturing multiple profit pools inside the expanding US automatic content recognition market.
The United States anchors global demand, supported by an 80% smart-TV household rate, the world’s deepest programmatic advertising infrastructure, and a mature content-production ecosystem that insists on deterministic measurement. California drives both innovation and regulation: its CPRA rules compel granular consent, catalyzing investment in privacy dashboards while inadvertently lifting opt-in rates for transparent vendors. The federal government’s May 2025 Copyright Office report clarified permissible AI training uses, giving ACR providers legal cover to fingerprint user-generated content for IP enforcement.
Coastal metros display near-universal streaming adoption, whereas parts of the Midwest still lean on cable bundles, sustaining hybrid measurement needs. State privacy bills in New York and Texas are expected to mirror California’s standards, gradually harmonizing compliance costs. International expansion flows outward from US engineering hubs: Amazon, Roku, and LG export ACR-enabled hardware and ad tech to Latin America and Europe, but must re-tool consent flows to satisfy GDPR. Despite outbound licenses, data processing remains predominantly domestic, preserving the centrality of the US automatic content recognition market in the global value chain.
Urban concentration of ad agencies in New York and Los Angeles provides dense customer clusters for ACR analytics firms. Yet rising automotive deployments locate new revenue in Michigan’s manufacturing corridor, broadening geographic spread. Overall, U.S. providers wield technical, legal, and distribution advantages that sustain domestic leadership even as overseas uptake accelerates.
Market Concentration
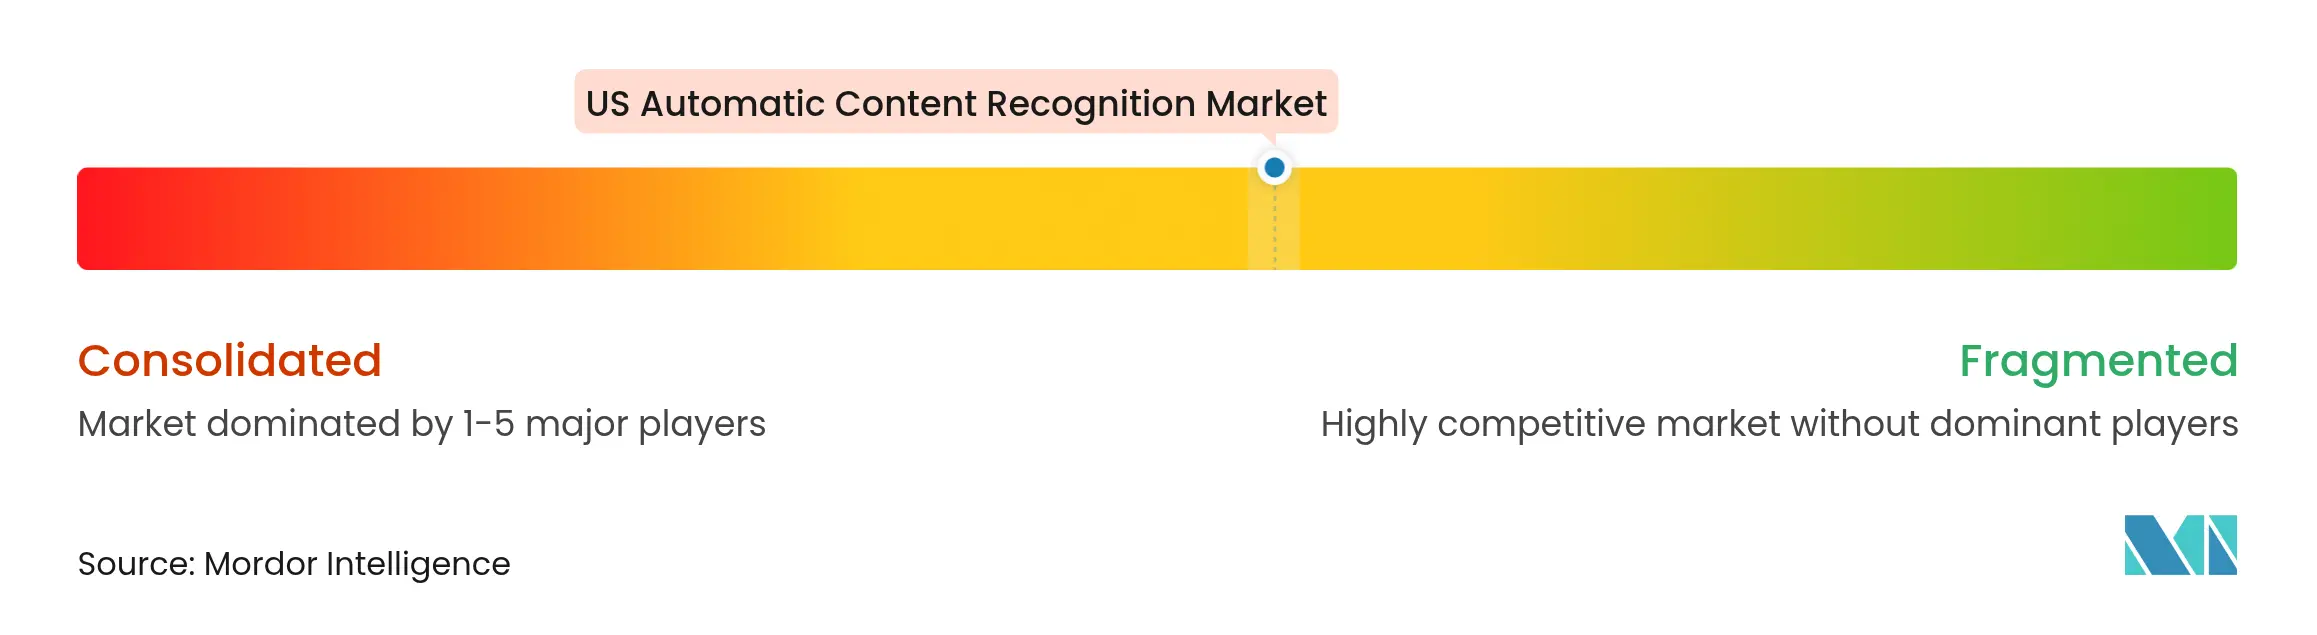
Moderate concentration defines today’s field: OEM leaders Samsung, LG, and VIZIO monetize embedded ACR, while Google, Amazon, and Roku control distribution pipes and ad stacks. Patents remain a competitive lever; Nokia’s March 2025 settlement with Amazon over streaming compression validates the importance of IP portfolios. Network-1’s failed suit against Google’s Content ID maintains precedential security for incumbents but signals ongoing litigation risk.
Strategic moves emphasize scale and data richness. Amazon-Roku’s June 2025 partnership combined identity graphs to cover 80% of connected-TV households, raising barriers for smaller DSPs. Disney’s integration of Amazon’s DSP into its Real-Time Ad Exchange links entertainment insights with commerce outcomes, widening moat through closed-loop proof. Specialized firms stay relevant by innovating faster: Gracenote feeds contextual metadata to sports broadcasters within 15 seconds of live action; Audible Magic guards rights on emerging music platforms; ACRCloud supplies low-latency APIs to mobile developers.
Edge computing trends benefit chipset alliances: Samsung leans on Arm for on-device AI, LG collaborates with Qualcomm to secure 4-nm nodes. Rising compute costs and privacy regulations thus constrain new entrants, likely nudging the US automatic content recognition market toward higher, though not monopoly-level, concentration over the forecast period.

*Disclaimer: Major Players sorted in no particular order
1. INTRODUCTION
2. RESEARCH METHODOLOGY
3. EXECUTIVE SUMMARY
4. MARKET LANDSCAPE
5. MARKET SIZE AND GROWTH FORECAST (VALUE)
6. COMPETITIVE LANDSCAPE
7. MARKET OPPORTUNITIES AND FUTURE OUTLOOK
Market Definitions and Key Coverage
Segmentation Overview
Detailed Research Methodology and Data Validation
Primary Research
Desk Research
Market-Sizing & Forecasting
Data Validation & Update Cycle
Why Mordor's US Automatic Content Recognition Baseline Commands Reliability
Benchmark comparison
| Market Size | Anonymized source | Primary gap driver | ||
|---|---|---|---|---|
USD 1.15 billion (2025) | Mordor Intelligence | Anonymized source:Mordor Intelligence | Primary gap driver: | |
USD 1.01 billion (2024) | Regional Consultancy A | Bundles adjacent analytics tools; spot USD rates | ||
USD 1.04 billion (2024) | Trade Journal B | Single penetration source; biennial refresh | ||
USD 0.90 billion (2023) | Global Consultancy C | Excludes OTT app revenue; flat adoption curve |
Pricing Strategy for Semiconductor Components
3 Min Read
Accelerating Additive Manufacturing Adoption in India
3 Min Read
When decisions matter, industry leaders turn to our analysts. Let’s talk.