
South Africa Air Freight Market Size and Share
Market Overview
| Study Period | 2020 - 2031 |
|---|---|
| Forecast Data Period | 2026 - 2031 |
| Base Year Market Size (2025) | USD 1.08 Billion |
| Market Size (2026) | USD 1.11 Billion |
| Market Size (2031) | USD 1.25 Billion |
| Growth Rate (2026 - 2031) | 2.45 % |
| Market Concentration | Low |
Major Players *Disclaimer: Major Players sorted in no particular order Image © Mordor Intelligence. Reuse requires attribution under CC BY 4.0. | |
South Africa Air Freight Market Analysis by Mordor Intelligence
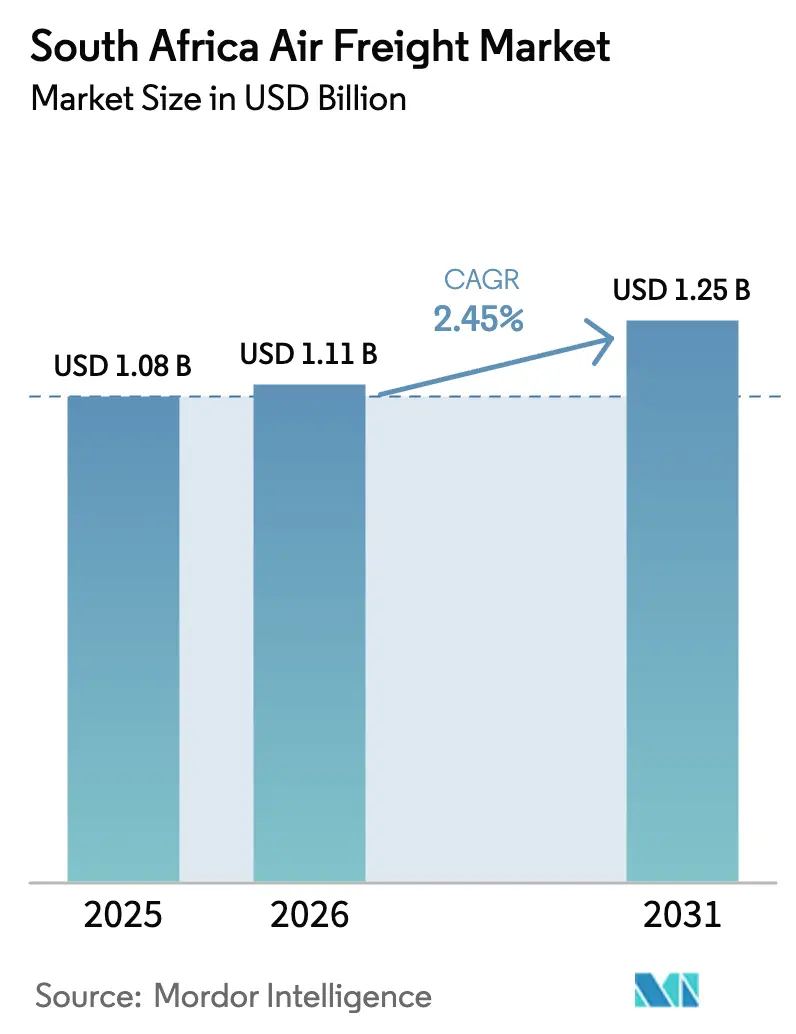
The South Africa Air Freight Market size was valued at USD 1.08 billion in 2025 and estimated to grow from USD 1.11 billion in 2026 to reach USD 1.25 billion by 2031, at a CAGR of 2.45% during the forecast period (2026-2031).
Demand is anchored in high-value, time-sensitive trade lanes linking emerging African producers with Europe, Asia, and North America, yet growth remains moderate because airport infrastructure and energy constraints curb available capacity. E-commerce shipments are expanding at 14% per year, pushing express carriers to add frequencies and dedicate belly hold allocations, while perishables such as citrus, table grapes, and pharmaceuticals continue to pay yield premiums that keep load factors high. Gauteng’s OR Tambo International Airport handles 650,000 tonnes of cargo annually, but recurring load-shedding forces tenants to rely on costly standby power that raises operating expenses. At the same time, customs modernization and a 2025 single-window platform promise faster clearances, which could shift mid-value shipments from ocean to air.
Key Report Takeaways
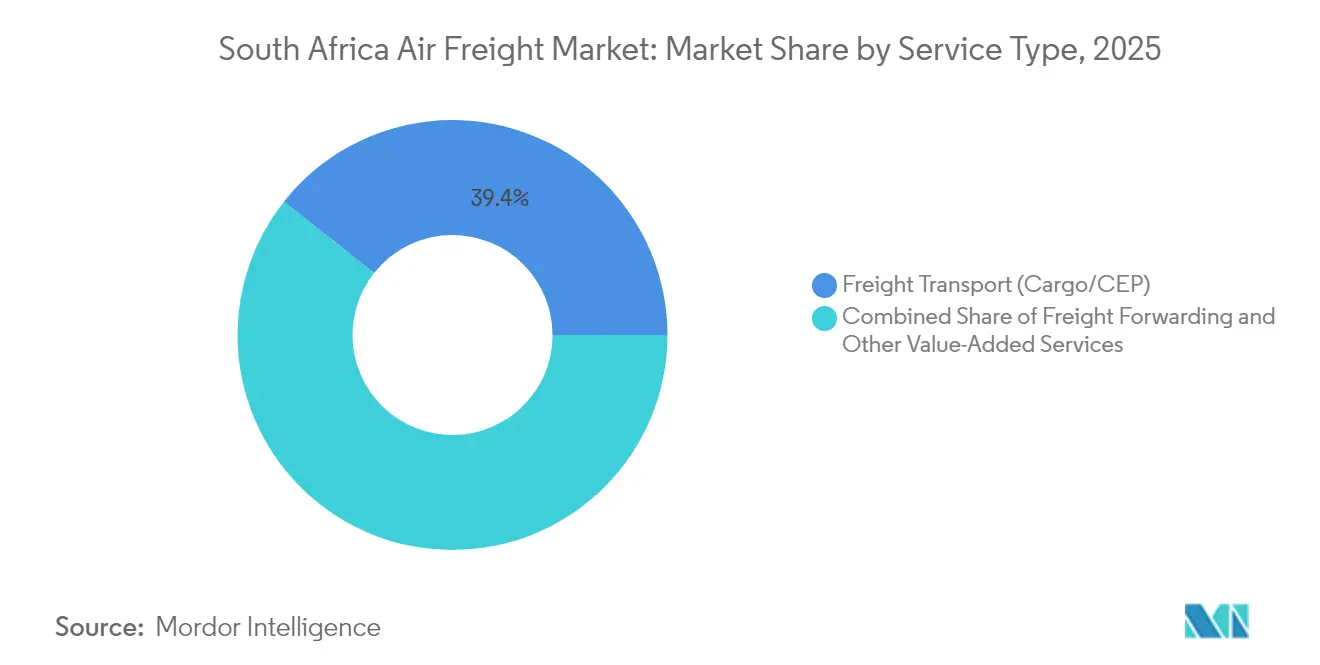
- By service, freight transport held 39.35% of the South Africa air freight market share in 2025, while other value-added services are projected to grow at a 3.08% CAGR to 2031.
- By destination, international routes captured 65.55% of traffic in 2025; domestic routes are advancing at a 3.36% CAGR through 2031, reflecting e-commerce-led regional fulfillment demand.
- By carrier type, belly cargo commanded 51.40% of the South Africa air freight market size in 2025, whereas dedicated freighters are forecast to post a 3.55% CAGR to 2031 on the back of pharmaceutical and oversized cargo growth.
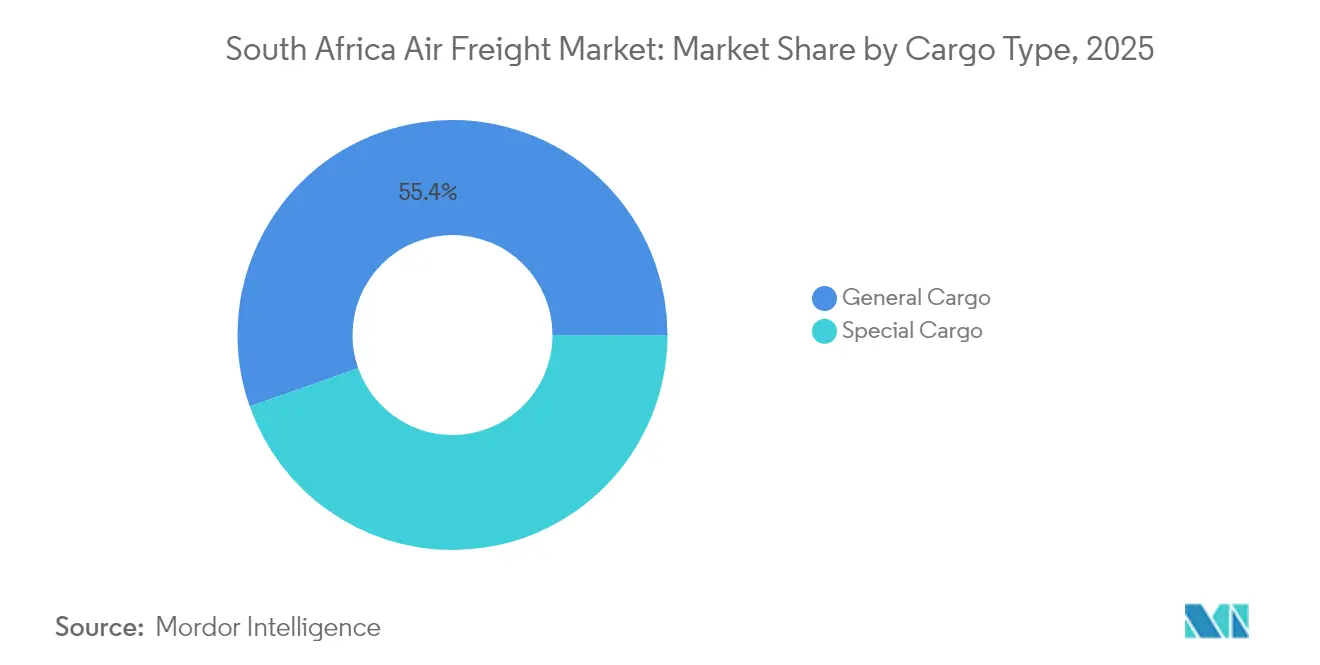
- By cargo type, general cargo accounted for 55.40% share of the South Africa air freight market size in 2025 and special cargo is on course for a 3.16% CAGR through 2031, reflecting stricter cold-chain compliance.
- By end-use industry, e-commerce and retail represented 27.60% of 2025 revenues, while healthcare and pharmaceuticals are expanding at a 4.32% CAGR to 2031 as National Health Insurance procurement scales up.
- By province, Gauteng led with 40.40% share in 2025; Western Cape is projected to grow at a 3.65% CAGR through 2031 because of surging fruit and flower exports.
Note: Market size and forecast figures in this report are generated using Mordor Intelligence’s proprietary estimation framework, updated with the latest available data and insights as of 2026.
Market Trends and Insights
Drivers Impact Analysis of South Africa Air Freight Market*
| Driver | % Impact on CAGR Forecast | Geographic Relevance | Impact Timeline |
|---|---|---|---|
| E-commerce boom and express-parcel demand | +0.8% | Gauteng, Western Cape, national coverage | Short term (≤ 2 years) |
| Strategic hub location at the tip of Africa | +0.6% | National with spillover into SADC | Long term (≥ 4 years) |
| Perishable-export growth | +0.5% | Western Cape, KwaZulu-Natal, Gauteng | Medium term (2-4 years) |
| Customs modernization and single window | +0.3% | National, early uptake in Johannesburg, Cape Town, Durban | Medium term (2-4 years) |
| Cargo-drone corridor pilots | +0.2% | Rural districts and secondary cities | Long term (≥ 4 years) |
| Sustainable Aviation Fuel offtake agreements | +0.1% | Major airports countrywide | Long term (≥ 4 years) |
| Source: Mordor Intelligence | |||
E-commerce Boom and Express Parcel Demand
Cross-border e-commerce has made next-day delivery a baseline expectation, prompting express operators to upgrade sortation capacity and partner with seven additional overseas airlines in 2025 to reinforce time-definite lanes. Volumes are rising fast enough that carriers negotiate block-space agreements months ahead, locking in uplift during peak retail periods. The South African Revenue Service’s shift to stricter VAT collection on low-value consignments increases administrative workload for maritime operators, nudging merchants toward air freight where automated clearance tools accelerate cycle times. New dedicated e-commerce freighters now call OR Tambo on overnight rotations, while regional integrators trial micro-fulfillment centers in Cape Town to cut last-mile costs. Competitive differentiation has moved to digital interfaces as shippers demand real-time visibility and carbon metrics on each consignment[1].
Strategic Hub Location at the Tip of Africa
South Africa occupies the midpoint for east-west Africa trades and serves as a natural consolidation node for cargo feeding into Southern African Development Community states. The Single African Air Transport Market grants fifth-freedom rights that allow foreign carriers to route via Johannesburg, enlarging the catchment area and boosting transit volumes. Ethiopian Airlines lifted weekly freighter stops at Cape Town to eleven in 2024, citing reliable ground handling and bilateral open-skies provisions. Cape Town International Airport processed 27% more freight during the first 10 months of 2024 after stakeholders co-funded a Pharma Air Corridor program offering temperature-controlled dollies. Long-term competitiveness hinges on satellite-based air-traffic management now under procurement, which should add route capacity and reduce stack holding above Johannesburg[2].
Perishable-Export Growth (Fruits, Flowers, Pharma)
Fresh-produce exporters rely on rapid lift during harvest peaks because maritime transits exceed cold-chain shelf life. Table grape shipments reached 415,565 tonnes in 2024, up 30%, and most volumes departed from Cape Town under strict two-hour apron dwell targets. Pharma exports also climb as 35% of therapeutics require 2-to-8 °C control, a ratio set to rise with mRNA vaccine pipelines. Airlines have reacted by fitting wide-body holds with active container power supplies, while forwarders pre-book tarmac-side cool rooms to avoid grid blackouts. Higher yields for perishable moves offset the cost of dry-ice replenishment and extra staff, sustaining route economics on traditionally imbalanced backhauls.
Customs Modernization and Single-Window Clearance
South Africa’s 2025 single-window platform lets importers lodge manifest, sanitary, and permit data once rather than across four portals, trimming average clearance times and documentation fees. Automated risk engines redirect non-sensitive consignments to green channels, freeing inspection resources for controlled goods. Time-Release Studies undertaken at Oshoek show potential to cut end-to-end dwell by an additional 19 hours if similar data interchange tools extend to airports. Simplified regimes favor mid-value industrial components previously relegated to sea freight, transferring incremental tonnage to the South Africa air freight market and raising belly-hold utilization on spoke routes.
Restraints Impact Analysis of South Africa Air Freight Market*
| Restraint | % Impact on CAGR Forecast | Geographic Relevance | Impact Timeline |
|---|---|---|---|
| High operating and fuel costs | -0.4% | National, acute on thin domestic sectors | Short term (≤ 2 years) |
| Load-shedding risks to airport cold-chains | -0.3% | Major international gateways | Short term (≤ 2 years) |
| Air-traffic-control system failures | -0.2% | Johannesburg and other tier-1 airports | Short term (≤ 2 years) |
| Airport funding shortfalls & maintenance gaps | -0.2% | National, highest at ACSA-managed facilities | Medium term (2-4 years) |
| Source: Mordor Intelligence | |||
High Operating and Fuel Costs
Jet-fuel prices rebounded 16.6% year on year in early 2025, forcing airlines to rationalize frequencies and deploy more fuel-efficient B777Fs on trunk lanes. Carriers implemented tariff hikes that lifted international parcel rates to ZAR 22.17 per kilogram, dampening low-margin commodity flows. Sustainable Aviation Fuel uptake stands below 2% of total supply and carries a 50 % premium that operators can only pass through on life-critical cargo, constraining broader adoption. Concentration ratios above 60% allow incumbents to synchronize surcharge adjustments, limiting price relief for shippers.
Load-Shedding Risks to Airport Cold-Chain Power
Stage-10 load-shedding implemented by Eskom cuts grid availability up to 12 hours per day, triggering generator reliance that inflates handling fees and threatens product integrity. Temperature excursions during blackouts affected 20% of monitored pharma consignments in 2024, compelling exporters to over-pack with phase-change materials, which raises weight and costs. Unplanned shutdowns of radar and lighting systems caused flight delays at OR Tambo, cascading into missed connections and charter diversions that undercut service reliability. Some shippers have begun routing sensitive loads via Nairobi where renewable energy buffers provide steadier power.
*Our forecasts treat driver/restraint impacts as directional, not additive. The impact forecasts reflect baseline growth, mix effects, and variable interactions.
South Africa Air Freight Market Segment Analysis
By Service:
Consolidation Drives Value-Added GrowthFreight transport services, primarily cargo and courier-express-parcel operations, held 39.35% of the South Africa air freight market share in 2025, underscoring the centrality of traditional lift in the national logistics chain. The segment benefits from rising cross-border online sales and from foreign manufacturers that prefer Johannesburg as a southern African consolidation node. Freight forwarders occupy an intermediary role by aggregating volumes from small shippers; digital rate marketplaces and track-and-trace dashboards are closing information gaps that once hindered smaller enterprises. Other value-added services are set to post a 3.08% CAGR to 2031, the fastest within this segmentation, as shippers outsource customs brokerage, cargo insurance, and unit-load-device management. Integrated offerings reduce hand-offs, lower damage risk, and boost visibility, a combination that continues to draw mid-market retailers into premium tiers of the South Africa air freight market.
Freight forwarders leverage block space agreements to secure better rates than stand-alone shippers can obtain, then reinvest savings into inventory-management applications that display real-time dwell times and carbon footprints. Regulatory pressures around dangerous-goods compliance have pushed airlines to prefer consolidators with International Air Transport Association certification, raising the barrier for ad-hoc operators. As a result, market entrants are adopting niche strategies such as outsized oil-and-gas equipment or stage-set logistics, rather than competing head-to-head against incumbents on general cargo. These dynamics lengthen contract tenures and reinforce the oligopolistic character of the South Africa air freight market.

By Destination:
International Routes Dominate Despite Domestic AccelerationInternational lanes absorbed 65.55% of 2025 volumes, a reflection of the export-oriented nature of South Africa’s economy and its strong ties to European and Asian consumer markets. Frequent wide-body passenger flights generate ample belly capacity that keeps rates competitive for automotive components, electronics, and fresh produce. Domestic traffic is small in absolute terms but will grow at a 3.36% CAGR through 2031 because local e-commerce platforms promise next-day delivery across dispersed urban centers. Logistics providers are adding city-pair night freighters and investing in regional sortation nodes to avoid double handling through Johannesburg, cutting delivery time by one day on Cape Town–Durban routes.
The African Continental Free Trade Area is set to liberalize intra-African shipments, which could divert some flows away from long-haul networks toward regional spokes. Johannesburg and Cape Town are primed to capture these volumes, yet they face emerging competition from Nairobi and Lagos, which pitch shorter transit times into West Africa. Capacity injections from new carriers will therefore determine whether the South Africa air freight market size gains share in east-west intra-African corridors or cedes ground to rival hubs.
By Carrier Type:
Freighter Capacity Gains MomentumBelly holds represented 51.40% of the South Africa air freight market size in 2025 because passenger services offer daily frequencies that match just-in-time inventory cycles. However, dedicated freighters will compound at 3.55% per year to 2031, driven by pharmaceuticals, live animals, and outsized industrial machinery that require main-deck loading or strict temperature adherence. Airlines such as DHL and Ethiopian deploy B777F aircraft into Johannesburg on round-the-world rotations, providing late-cutoff export options.
ADS-B Out avionics mandated from June 2025 raise compliance costs but also increase operational safety and allow more efficient route spacing, supporting additional slot allocations. Smaller charter firms may struggle to retrofit aging DC-9s and will likely merge or exit, further consolidating freighter supply. As capacity tightens, yield premiums on late-night charters should persist, reinforcing the value of strategic fleet investments for incumbents in the South Africa air freight market.
By Cargo Type:
Special Cargo Commands Premium PositioningGeneral cargo composed 55.40% of lift in 2025, reflecting diverse outbound shipments of consumer goods, mining inputs, and automotive parts. Even so, special cargo will outpace at a 3.16% CAGR through 2031, catalyzed by stricter pharmaceutical temperature mandates and growing electronics exports. Revenue yields on special cargo average 1.8 times those of general freight, compensating for higher handling and documentation costs.
Temperature excursions during blackouts spurred ground handlers to acquire hybrid energy storage that maintains stable conditions for two hours without generator input, reducing spoilage risk. Regulations for lithium-ion battery transport have also tightened, leading to segregated storage zones and specialized fire-suppression systems at Johannesburg. Together these measures improve confidence among high-tech shippers and help grow the premium tier of the South Africa air freight market.
By End-Use Industry:
Healthcare and Pharmaceuticals Lead GrowthE-commerce and retail was the largest end-use category in 2025, holding 27.60% share as international online platforms gained traction among South African consumers. However, healthcare and pharmaceuticals top the growth chart with a 4.32% CAGR through 2031 because the National Health Insurance Bill centralizes drug procurement and increases regional re-export volumes. Cold-chain compliance drives value-added service uptake, including real-time temperature monitoring and final-mile insulated vehicles.
Manufacturing and automotive, perishables, and electronics remain important contributors, each requiring distinct handling protocols. Automotive tier-one suppliers ship high-value engine parts on next-flight-out service to avoid plant downtime. Fresh-produce exporters appreciate air freight’s ability to reach European supermarket shelves within 48 hours, preserving price premiums. High-tech modules for telecom base stations move via secure, tamper-evident packing that relies on the robust security infrastructure at South African gateways.
Geography Analysis
Gauteng’s dominance in the South Africa air freight market rests on OR Tambo International handling 18.37 million passengers and 650,000 tonnes of cargo a year. Corporations co-locate distribution centers nearby to consolidate inbound electronics, apparel, and pharmaceuticals before dispatching to regional customers. The airport reports an 86.68% on-time performance, but chronic load-shedding demands investment in diesel generators and battery backups, raising per-kilo handling fees. Air-traffic-control failures in March 2025 grounded departures for six hours, prompting airlines to review contingency plans that include routing via Nairobi or Doha for time-critical cargo. Liquidity issues at the Airports Company South Africa, including unpaid invoices exceeding ZAR 550 million, cast uncertainty over maintenance of critical cold-store infrastructure.
Western Cape is the fastest-growing sub-market, benefiting from a 27 % rise in cargo volumes during the first ten months of 2024. Table grapes, export-quality flowers, and pharmaceuticals move through Cape Town’s upgraded Cargo Terminal where real-time temperature probes feed into a public dashboard. The province enjoys an 89.92% on-time departure rate and lower congestion, encouraging forwarders to aggregate coastal cargo here instead of trucking it 1,400 kilometers to Johannesburg. Construction of Cape Winelands Airport promises an additional 80,000 tonnes of annual capacity and incorporates off-grid solar, mitigating exposure to national power outages. Provincial authorities are collaborating with airlines on Sustainable Aviation Fuel test flights sourced from local biomass, aiming to secure early-mover credibility in green logistics.
KwaZulu-Natal and the Rest of South Africa collectively represent roughly one-fifth of tonnage. King Shaka International achieved 5.04 million passengers in the 2024–2025 fiscal year and 40,935 aircraft movements, equating to 83 % of its pre-pandemic baseline. Its integration within the Durban Aerotropolis master plan aligns road, rail, seaport, and air logistics nodes, making the region attractive for automotive and apparel manufacturers. Smaller regional airports, including Polokwane and Bloemfontein, depend on belly space within domestic narrow-body fleets, and their expansion prospects hinge on continued e-commerce penetration and drone-supported last-mile networks.
Regulatory Landscape
South Africa air freight operates under the oversight of the South African Civil Aviation Authority (SACAA), which administers the Civil Aviation Regulations and associated standards applied at cargo gateways such as OR Tambo, Cape Town International, and King Shaka. Cargo operations are shaped by compliance requirements that include surveillance and equipage mandates (for example, ADS-B Out requirements taking effect from June 2025 for aircraft operating in Class A and C airspace) and dangerous-goods controls under the CAR framework (including Part 92) aligned with ICAO Technical Instructions. These rules influence airline acceptance policies, ground handling procedures, and shipper documentation practices.
On the policy and charges side, the Department of Transport has advanced an Airfreight Strategy process, with public comments invited during 2025 through a Government Gazette notice. This reflects an active effort to formalize air-cargo development priorities and remove bottlenecks. Separately, the Minister of Transport signed the Thirty-Fourth Amendment of the Regulations concerning user fees and passenger safety charges on 26 January 2026, with an effective date of 1 April 2026, creating an additional cost and compliance touchpoint for airport users. The regulatory reform work also includes a diagnostic review of the foreign operator permit (FOP) value chain and the appointment of a Civil Aviation Regulations Committee (CARCom) for a three-year term to advise on amendments, both relevant to market access and administrative cycle times for international capacity.
Value Chain Analysis
The South Africa air freight value chain starts with exporters, manufacturers, e-commerce sellers, and healthcare shippers. It then moves through freight forwarders and integrators that provide consolidation, documentation, and service design, including time-definite and temperature-controlled products. Airports Company South Africa (ACSA) supports the chain through airside infrastructure and cargo terminal capacity at primary gateways, while airlines (belly cargo and freighters) provide uplift and schedule connectivity to Europe, Asia, North America, and intra-Africa lanes. Ground handling organizations, trucking firms, and specialist cold-chain providers execute airside and landside handling, including acceptance checks for special cargo such as pharmaceuticals and lithium batteries.
Clearance and compliance are enforced by SACAA regulations (including dangerous-goods rules aligned with ICAO Technical Instructions) and border-control processes. The national single-window platform introduced in 2025 is positioned to reduce repetitive data submission across portals and improve coordination across permits and inspections. Industry coordination bodies, including the South African Association of Freight Forwarders (SAAFF), also support standardization and digitization, with stakeholders working on a cargo community portal to improve airport communications and reduce congestion. Operational reliability remains tied to constraints visible at key nodes, particularly the need for resilient power for cold stores and performance of air-traffic-control systems at tier-1 airports, which can affect cut-off times and connection integrity.
Competitive Landscape
DHL, FedEx, Emirates SkyCargo, and Qatar Airways dominate long-haul lanes, leveraging global networks, dedicated B777F fleets, and specialized cold-chain certifications. Their scale permits negotiated fuel hedges and multi-airport ground-handling contracts that smaller rivals cannot match. Domestic capacity is led by South African Airways Cargo, although its restructuring leaves room for fast-growing regionals and ACMI providers to capture displaced share.
Digital transformation shapes competitive strategy. DHL invested in predictive analytics that optimize load factors based on booking curves, while FedEx is rolling out robotics in Johannesburg to automate parcel sortation and cut manual errors. Kuehne + Nagel recorded 15 % revenue growth in Q1 2025 and is extending its agent network into secondary South African cities to exploit rising SME export activity. Sustainability also drives differentiation: Emirates SkyCargo committed to a Sustainable Aviation Fuel offtake agreement covering 25 % of its South Africa uplift through 2028, ensuring compliance with customer Scope 3 emission targets.
Innovation opportunities lie in cargo drones and last-mile networks. The drone market is expected to reach USD 134.5 million by 2025, and the South African National Blood Service already dispatches critical medical supplies via 100-kilometer range UAVs. Regulatory acceptance of beyond-visual-line-of-sight flights could allow integrators to bypass congested city roads for lightweight parcels, lowering delivery times by half. The Civil Aviation Authority’s ADS-B mandate however imposes upgrade costs that could squeeze smaller freight airlines, accelerating consolidation and reinforcing the current oligopolistic balance within the South Africa air freight market[3].
South Africa Air Freight Industry Leaders
-
DHL Express
-
FedEx Express
-
UPS
-
Kuehne + Nagel
-
Ethiopian Airlines Cargo
- *Disclaimer: Major Players sorted in no particular order
South Africa Air Freight Market Companies Covered in this Report
- DHL Express
- FedEx Express
- UPS
- Kuehne + Nagel
- Ethiopian Airlines Cargo
- South African Airways Cargo
- Cargo Compass SA
- Emirates SkyCargo
- Qatar Airways Cargo
- Cargolux
- BidAir Cargo
- DSV
- Trans Air Freight
- Intra Speed South Africa
- Sebenza Freight
- Freight First
- Rhenus Logistics
- Rohlig Logistics
- Natco Logistics
- Savino Del Bene
Market Opportunities and Future Outlook
Capacity and throughput expansion at gateway airports remains a central whitespace, supported by named project pipelines and quantified development targets. The government has articulated a target of handling 1.2 million tonnes of air freight during the current administration, while ACSA has a capital expenditure pipeline for OR Tambo International Airport through 2031 and a planned R5.7 billion midfield cargo complex at OR Tambo, with terminal infrastructure construction scheduled to begin in March 2027. In parallel, King Shaka International Airport has a project pipeline estimated at R6 billion for terminal expansion and new assets such as a fixed-base operations facility, adding more options for time-sensitive cargo linked to the Durban Aerotropolis.
Digitization and process reform also create near-term commercial openings for forwarders, handlers, and technology vendors focused on dwell-time reduction and network predictability. Active initiatives include digitization of the foreign operator permit (FOP) value chain to reduce administrative friction for international operators and ongoing industry work on a cargo community portal to improve information flow across airport stakeholders. On trade-lane development, South Africa participation in the Single African Air Transport Market (SAATM) provides a framework for improving regional connectivity, while the 2025 single-window platform and tighter compliance expectations for dangerous goods, cold-chain integrity, and equipage rules support premium service differentiation for e-commerce, pharmaceuticals, and perishables moving through Johannesburg and Cape Town.
Recent Industry Developments in South Africa Air Freight Market
- July 2026: APG appointed Cargo General Sales Agent (GSA) for TAP Air Cargo in South Africa to support sales and cargo connectivity. The appointment expands TAP Air Cargo's presence in the South African market and enhances access to its global network for regional shippers. The arrangement strengthens South Africa capacity and connectivity on international lanes, boosting mid-value and time-sensitive shipments.
- June 2026: LATAM Cargo (via AirCross partnership) launched a service connecting Cape Town to its network effective July 2, 2026, expanding SA - Americas trade corridors. The new link creates a direct South Africa to Americas air freight channel that broadens capacity and choice for exporters. It improves market access for perishable and high-value goods, potentially shifting volumes from ocean to air on key routes.
- May 2026: Astral Aviation (Fly Noor Aviation) resumed twice-weekly scheduled freighter flights between Haikou, China, and Johannesburg via Nairobi (Boeing 767-300F). The China - South Africa freighter service adds long-haul capacity and diversifies route options for South African shippers. This strengthens South Africa's options for electronics, perishables, and pharmaceuticals.
South Africa Air Freight Market Report Scope and Research Methodology
Market Definition and Coverage
For this report, the market covers the value of air freight services tied to cargo moved by air within South Africa and across international lanes, including airline capacity and related forwarding activity that supports the shipment flow.
Scope exclusions: Passenger ticket revenue and pure airport services (such as retail concessions and parking) are excluded when they are not billed as part of an air freight service.
Segments Covered in This Report
- By Service
- Freight Transport (Cargo/CEP)
- Freight Forwarding
- Other Value-Added Services (Customs brokerage, Insurance, etc.)
- By Destination
- Domestic
- International
- By Carrier Type
- Belly Cargo
- Freighter
- By Cargo Type
- General Cargo
- Special Cargo
- By End-Use Industry
- E-commerce and Retail
- Manufacturing and Automotive
- Healthcare and Pharmaceuticals
- Perishables and Fresh Produce
- High-Tech and Electronics
- Others
- By Province (Geography)
- Gauteng
- Western Cape
- KwaZulu-Natal
- Rest of South Africa
Data Sources, Market Sizing, and Validation
Desk Research
Desk research starts with mapping how much freight is actually moving through South Africa's air network, and what the demand drivers look like for time-sensitive cargo. We relied on public datasets and official publications such as Statistics South Africa trade statistics, South African Reserve Bank macro series, South African Revenue Service customs guidance and trade updates, ICAO and IATA air cargo indicators, and government transport policy documents (including airfreight strategy material) to keep the model grounded.
On the supply side, we reviewed airport and aviation ecosystem disclosures, airline and logistics operator filings, and reputable press coverage to understand capacity shifts, route additions, and service mix. Where needed, paid subscriptions for company financials and intelligence, shipment-level import and export records, and a patent database were used to cross-check activity patterns and pricing signals. This source list is illustrative, and many other references were used to collect data, validate assumptions, and clarify gaps.
Primary Interviews and Surveys
Primary work was used to stress-test the desk model assumptions around yield per kg, mix of general versus special cargo, and the split between belly cargo and freighters. We spoke with cargo decision-makers across airlines, freight forwarders, express-focused logistics teams, and shippers in sectors like retail, healthcare, and high-value manufacturing, so lane-specific dynamics and service add-ons were reflected realistically.
Distribution of primary research fieldwork respondents
| Company type | Respondent position |
|---|---|
| Top tier: 30% | CXOs: 17% |
| Mid tier: 51% | Functional/Unit leaders: 23% |
| Smaller Players: 19% | Managers: 60% |
Market-Sizing & Forecasting
Sizing begins with a top-down build that reconstructs the addressable value pool from South Africa-linked air cargo activity, before it is allocated into service and carrier buckets that match how the industry charges. To keep it repeatable, the model tracks a small set of inputs that can be monitored each year, such as air cargo tonnage directionally, international trade value trends for high-value goods, the share of belly capacity available on passenger routes, fuel and surcharge movement as a proxy for cost pass-through, and the changing mix of special cargo that typically carries higher yields.
Results are then checked with selective bottom-up approximations, where sampled price-per-kg ranges and typical add-on service charges are applied to plausible volume bands, and where channel feedback is used to correct for gaps. When data is thin for a niche flow, assumptions are built from adjacent lanes or similar cargo types and then tightened through interview feedback so the final totals do not drift. For forecasting, scenario analysis is used around capacity and pricing, and the trend path is stabilized with time-series smoothing so one-off disruptions do not overstate the medium-term trajectory.
Data Validation & Update Cycle
Validation is handled through triangulation across independent signals, including whether implied yields align with known cost and surcharge conditions, and whether modeled growth tracks trade and capacity realities. Outliers are flagged early, followed by a second-pass review that rechecks inputs, recalculates key splits, and documents why changes were made.
Reports are refreshed annually, and interim checks are triggered when major events shift capacity, routes, or pricing behavior. Before delivery, the model is re-run with the latest available public releases, and any material variance leads to follow-up calls so the final view stays current and internally consistent.
Mordor Intelligence's South Africa Air Freight Market Estimate Compared With Other Published Estimates
Published market sizes for South Africa air freight often differ because the timing and conversion choices are not aligned, and the pricing logic is not always updated when the rand moves or surcharges reset. Differences also show up when some studies mix airport handling or broader logistics value into air freight, which changes what is being counted.
In this report, the refresh cadence and currency timing are treated as first-order inputs, and the pricing model is revalidated using recent yield signals and operator feedback so that the value line stays tied to current contracting behavior, a choice applied by Mordor Intelligence.
Benchmark comparison
| Source | Market Size | Gaps in Research Methodology |
|---|---|---|
| Mordor Intelligence | USD 1.08 B (2025) | |
| Trade Analytics Publisher A | USD 0.96 B (2025) | Uses a narrower service capture that leans toward pure line-haul air transport and does not consistently include forwarding and value-added fees, which pushes the value down even when volumes are similar. |
| Industry Commentary Outlet B | USD 1.30 B (2025) | Applies a higher implied price-per-kg by extending peak-period yields across the full year, and it appears to fold adjacent airport or logistics charges into the air freight total without clear separation. |
The spread is mostly explained by what is counted as an air freight service, and by how pricing is annualized when costs and surcharges move. By keeping scope boundaries tight, updating currency and yield assumptions on a set cadence, and then rechecking the outputs against independent activity indicators, the estimate remains easier to trace and replicate.
Key Questions Answered in the Report
Which airport currently handles the most air freight in South Africa?
OR Tambo International in Gauteng processes about 650,000 tonnes annually and leads the South Africa air freight market.
What is the near-term growth outlook for dedicated freighter capacity?
Freighters are projected to expand at 3.55% CAGR to 2031 as demand for pharmaceuticals and oversized cargo rises.
How does load-shedding affect cold-chain shipments?
Stage-10 power cuts interrupt refrigeration at airports, causing up to 20% of pharma loads to experience temperature excursions, forcing shippers to add costly mitigation.
Why is Western Cape the fastest-growing provincial market?
A 27 % jump in 2024 cargo volumes, strong agricultural exports, and new runway capacity at Cape Winelands Airport underpin its 3.65% CAGR forecast.
What regulatory change will most influence customs procedures in 2025?
The national single-window system debuting in 2025 allows traders to file documents once, cutting clearance times and boosting competitiveness for mid-value shipments.
How concentrated is the competitive landscape?
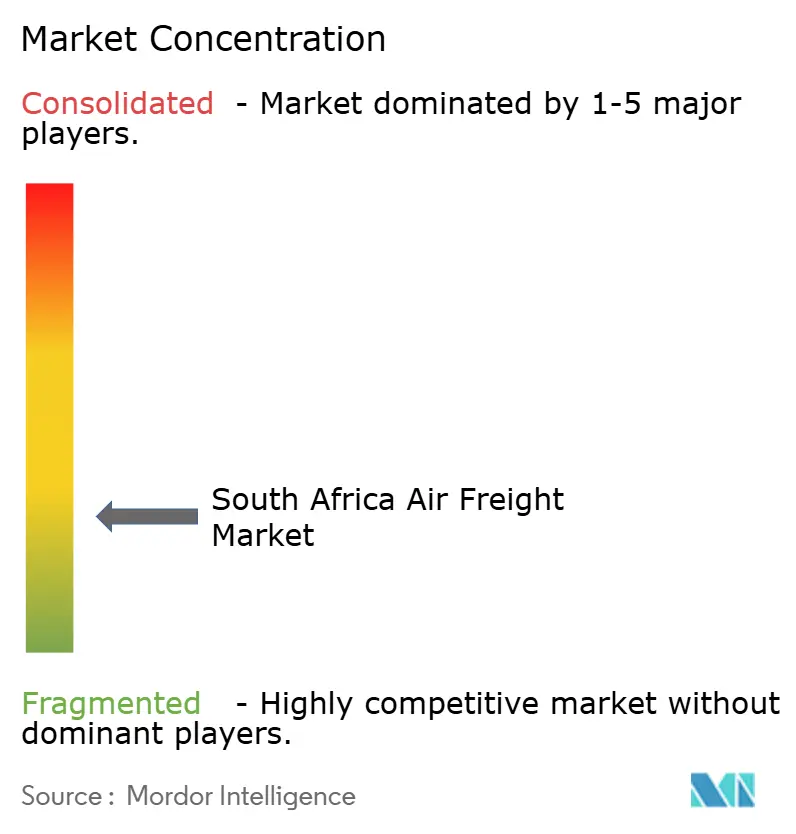
The top five operators control roughly 64% of revenue, indicating moderate concentration with scope for niche entrants in specialized services.