Unmanned Traffic Management Market Size and Share
Market Overview
| Study Period | 2019 - 2030 |
|---|---|
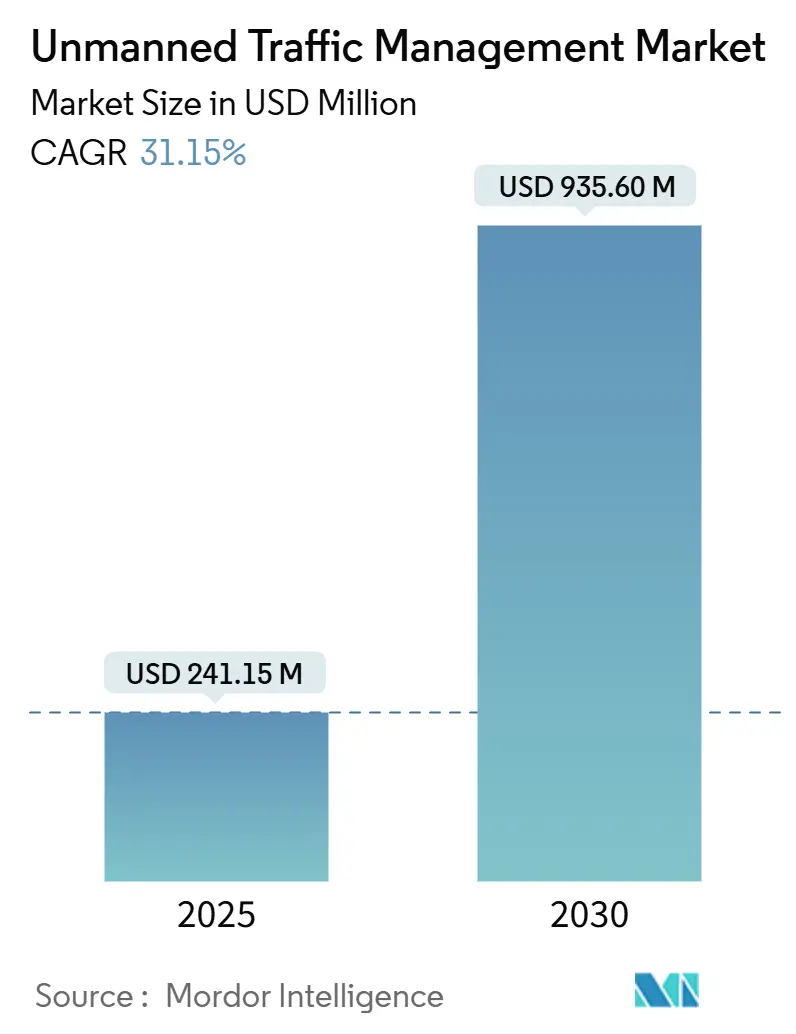
| Market Size (2025) | USD 241.15 Million |
| Market Size (2030) | USD 935.60 Million |
| Growth Rate (2025 - 2030) | 31.15% CAGR |
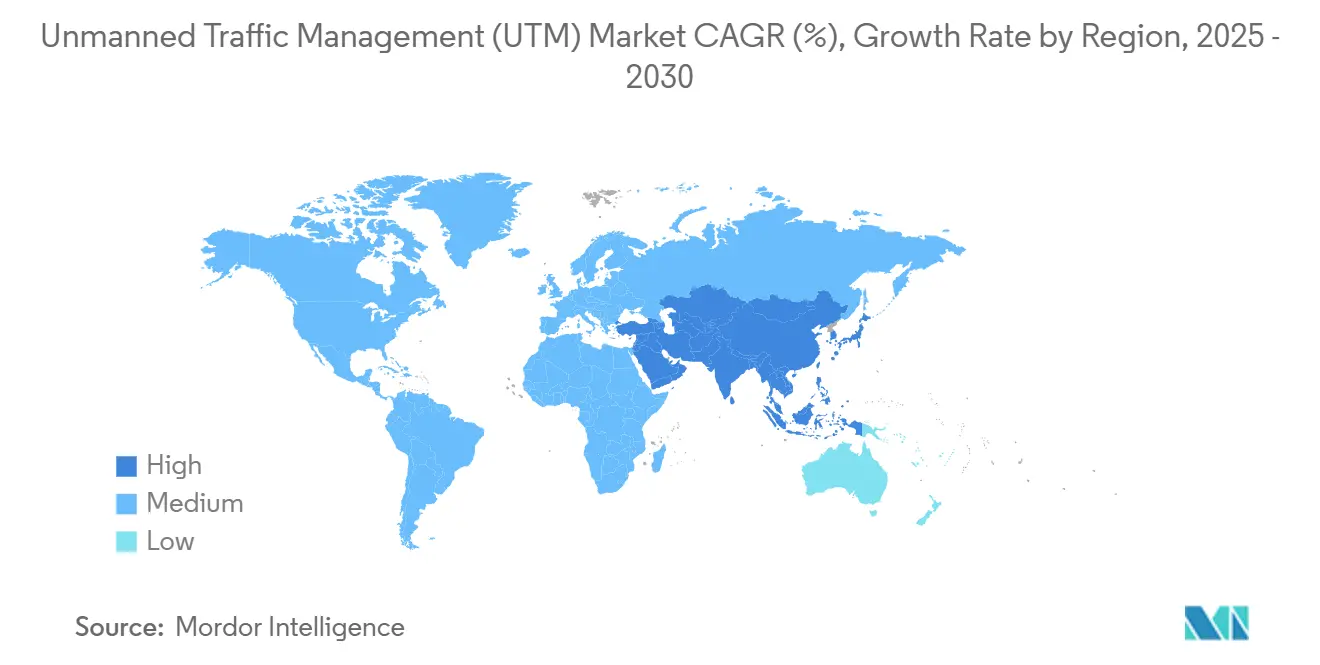
| Fastest Growing Market | Asia Pacific |
| Largest Market | North America |
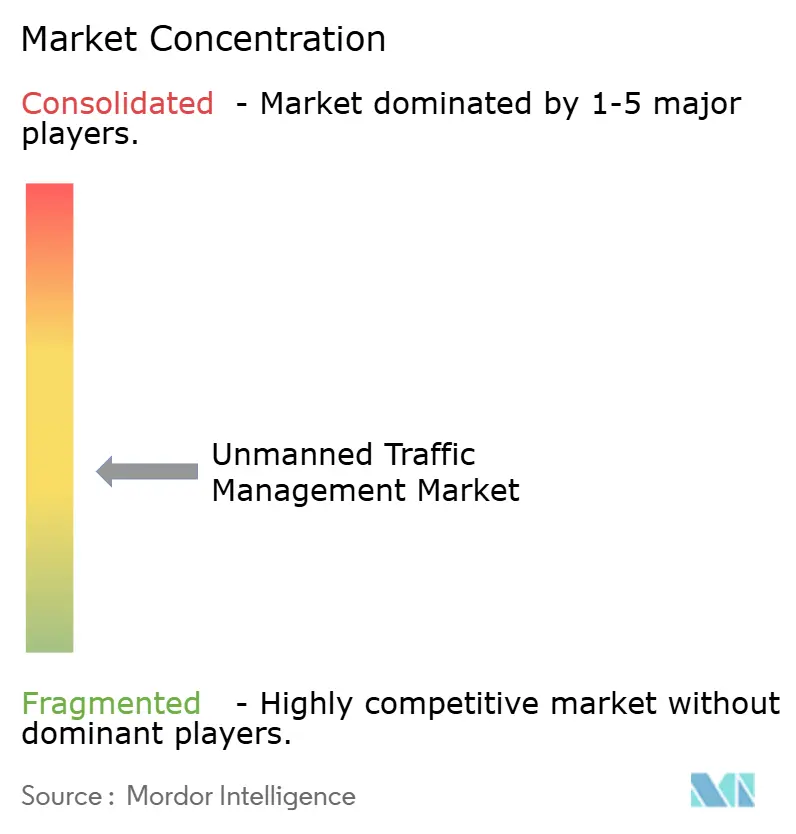
| Market Concentration | Medium |
Major Players *Disclaimer: Major Players sorted in no particular order Image © Mordor Intelligence. Reuse requires attribution under CC BY 4.0. | |
Unmanned Traffic Management Market Analysis by Mordor Intelligence
The unmanned traffic management (UTM) market was valued at USD 241.15 million in 2025 and is forecasted to reach USD 935.62 million by 2030, reflecting a 31.15% CAGR. The acceleration reflects a structural pivot in the UTM industry: regulators, telecom carriers, and logistics brands now bankroll full-scale digital air-traffic services rather than isolated pilot projects. Growing volumes of live telemetry prove that coordinated unmanned airspace management lowers incident rates even as flight densities climb, prompting insurers to offer attractive cover. Insurers’ willingness to underwrite larger drone fleets sharply reduces operator risk premiums, strengthening investor confidence in subscription-based airspace-data revenues. In parallel, procurement teams increasingly favour end-to-end platforms over stand-alone sensors, reinforcing the importance of integrated software stacks in the overall UTM market size expansion.
North America has the largest UTM market share, anchored by clear Federal Aviation Administration roadmaps and a robust venture-capital ecosystem. Asia-Pacific, however, is delivering the steepest incremental growth as city governments frame low-altitude airspace as a strategic economic resource. Cloud-native UTM platforms are maturing as middle-mile drone logistics scale, creating a reinforcing cycle between flight demand and digital oversight demand. Public grants, private equity, and telecom-tower upgrades appear side-by-side in municipal infrastructure budgets, demonstrating that UTM has moved from niche aviation concept to mainstream smart-city priority. If urban air-mobility corridors open on schedule, UTM industry revenues could surpass several adjacent aerospace segments before the decade closes.
Key Report Takeaways
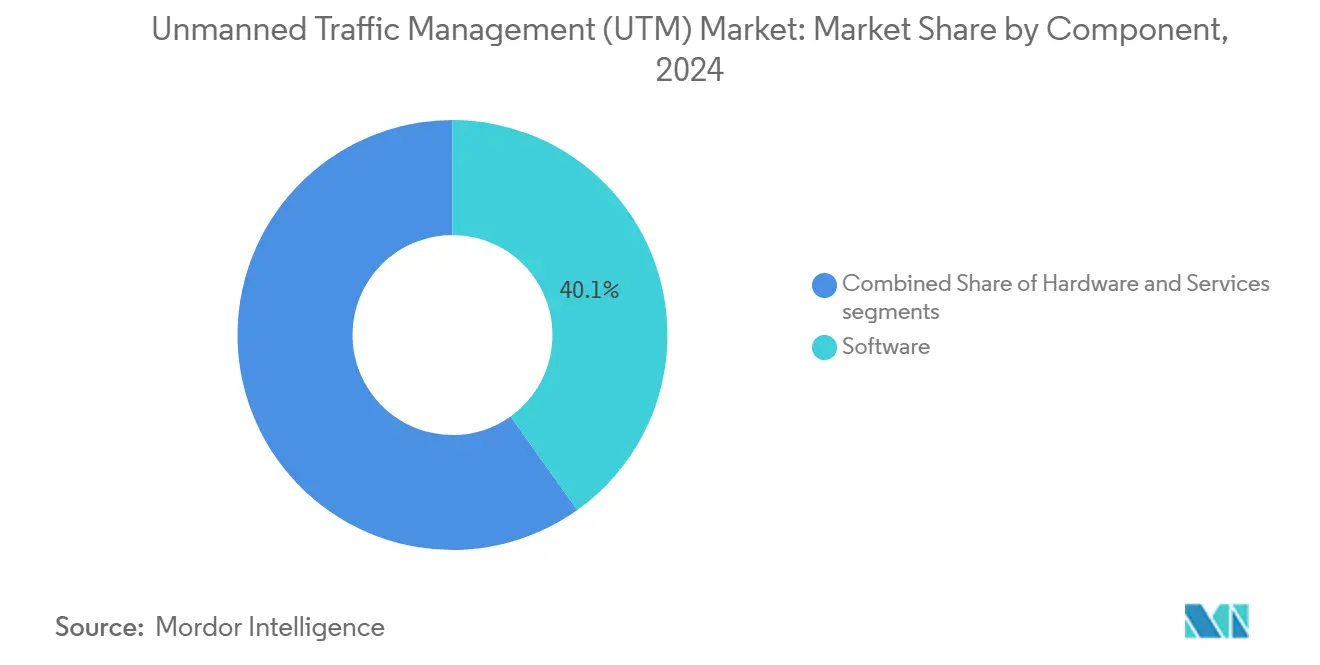
- By component, software led with 40.14% of UTM market share in 2024; services are projected to post the highest 21.58% CAGR through 2030.
- By solution type, communication infrastructure led with 48.91% of UTM market share in 2024; navigation infrastructure is projected to post the highest 23.51% CAGR through 2030.
- By altitude, below 200 ft accounted for 52.10% of the UTM market size in 2024, while 200 – 400 ft is poised to expand at a 21.56% CAGR to 2030.
- By end-use, logistics and transportation accounted for 31.27% of the UTM market size in 2024, while urban air mobility (UAM) is poised to expand at a 30.20% CAGR to 2030.
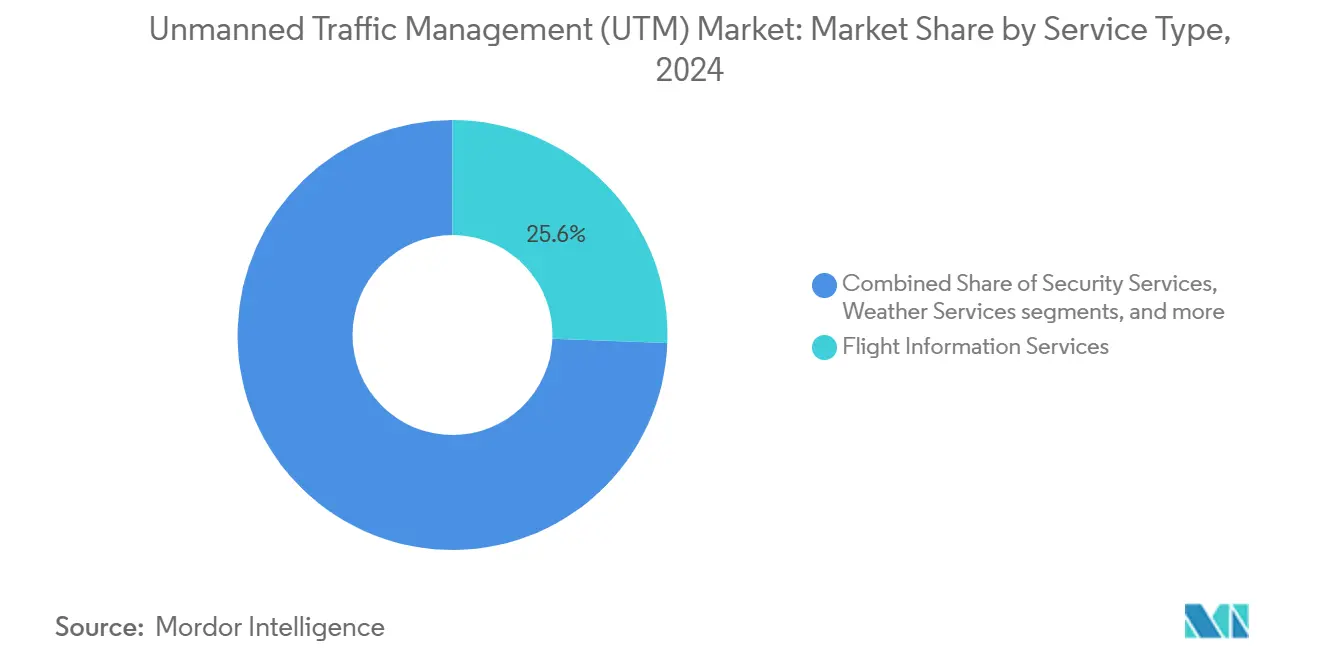
- By service type, flight-information services held a 25.59% share of the UTM market in 2024; security services recorded the fastest 25.12% CAGR.
- By deployment model, software led with 54.80% of UTM market share in 2024; on-premise is projected to post the highest 26.52% CAGR through 2030.
- By geography, North America commanded 32.80% of the UTM market in 2024, yet Asia-Pacific exhibits the strongest 28.94% CAGR between 2025 and 2030.
Global Unmanned Traffic Management Market Trends and Insights
Drivers Impact Analysis*
| Driver | (~)% Impact on CAGR Forecast | Geographic Relevance | Impact Timeline |
|---|---|---|---|
| Accelerated regulatory mandates for BVLOS drone flights | + 7.8 % | North America, Europe, emerging frameworks in Asia | Medium term (2-4 years) |
| 5G and satellite convergence enabling real-time UAV-to-Cloud communications | + 6.9 % | Global, early in North America, European Union, developed Asia | Medium term (2-4 years) |
| Soaring volumes of middle-mile e-commerce and parcel-delivery flights | + 5.6 % | Global urban centers | Short term (≤ 2 years) |
| Rapid uptake of drone-based middle-mile logistics by retail majors | + 4.7 % | North America, European Union, China, Japan | Short term (≤ 2 years) |
| Defense-to-Commercial technology spill-over in collaborative airspace management | + 3.7 % | North America, Israel, Europe | Medium term (2-4 years) |
| Smart-city funding for Urban Air Mobility corridors | + 2.5 % | North America, European Union, China, United Arab Emirates, Singapore | Long term (≥ 4 years) |
| Source: Mordor Intelligence | |||
Accelerated Regulatory Mandates for BVLOS Drone Flights
The Federal Aviation Administration’s (FAA's) expected 2025 BVLOS rulemaking is already driving the procurement of surveillance sensors and remote-identification tools that feed directly into UTM platforms.[1]Federal Aviation Administration, “FY 2025 Budget Highlights,” faa.govUniversity-led validation programs now connect experimental systems to the National Airspace System, forcing software suppliers to meet aviation-grade latency and redundancy thresholds. As local law enforcement agencies request access to identical data feeds, the user base for UTM dashboards widens beyond commercial operators. This broadening of stakeholders implicitly raises the minimum service level that future platforms must deliver.
5G and Satellite Convergence Enabling Real-time UAV-to-Cloud Communications
Field trials fusing terrestrial 5G with low-Earth-orbit back-haul cut telemetry dropouts by roughly half, prompting insurers to underwrite denser flight corridors. Roof-mounted intelligent-reflecting surfaces simultaneously boost consumer mobile coverage and drone command links, demonstrating spill-over benefits outside aviation. Several UTM vendors now bundle connectivity into subscription pricing, moving data-line fees from telecom bills to operator OPEX and illustrating how communications and traffic management have merged into a single service layer.
Soaring Volumes of Middle-Mile E-commerce and Parcel-Delivery Flights
Retailers that fly the 10-to-40 km “middle-mile” drone leg report materially shorter delivery cycles, and the resulting data improve routing algorithms embedded in UTM software. Bulk aircraft orders from cargo operators translate into thousands of incremental UTM licenses, which raises software revenues even if hardware margins compress. City planners are beginning to treat busy drone corridors as quasi-real-estate assets, hinting at future leasing models for airspace that would be managed through UTM dashboards. This emerging asset class could provide municipalities with a new revenue stream tied to digital navigation rights.
Rapid Uptake of Drone-based Middle-Mile Logistics by Retail Majors
In China, a single platform recorded more than 200,000 drone deliveries in 2024, forcing UTM clouds to process unprecedented volumes of flight-path data. That throughput pushes vendors to guarantee sub-second plan approvals, turning latency into a contractual metric rather than a best-effort target. Continuous data uploads from dense networks create heat maps highlighting consumer demand pockets, giving retailers fresh insight into urban purchasing behavior. By revealing these consumption patterns, UTM analytics becomes a strategic planning tool rather than a pure safety function.
Restraints Impact Analysis*
| Restraint | (~)% Impact on CAGR Forecast | Geographic Relevance | Impact Timeline |
|---|---|---|---|
| Fragmented spectrum policies below 500 ft across emerging economies | –4.7% | Developed Countries of Asia-Pacific, Latin America, Africa | Medium term (2-4 years) |
| High integration costs with legacy ANSP ATM Infrastructure | –3.7% | Global, strong in European Union and North America | Short term (≤ 2 years) |
| Cyber-security liability in federated UTM data exchanges | –3.1% | Global | Medium term (2-4 years) |
| Limited ROI for rural airspace digitization projects | –2.5% | Developing regions | Long term (≥ 4 years) |
| Source: Mordor Intelligence | |||
Fragmented Spectrum Policies Below 500 ft Across Emerging Economies
Emerging markets often lack harmonized spectrum allocations for low-altitude operations, compelling operators to outfit drones with multi-band radios that inflate unit costs. Civil aviation agencies in Africa have started exploring shared-license frameworks, an idea that could migrate to Southeast Asia if early pilots succeed. Hardware suppliers are reacting by certifying radios across more frequencies at launch, accelerating their depreciation cycles but opening faster entry into multiple regions. That shift moves integration work from regulators to manufacturers, potentially shortening time-to-market for commercial drone services.
High Integration Costs with Legacy ANSP ATM Infrastructure
Air Navigation Service Providers face multi-million-dollar interface projects to connect decade-old radar systems with modern cloud UTM endpoints. Recent communications outages at major airports underscore the fragility of ad hoc fixes, prompting fresh calls for centralized upgrade funds. Some ANSPs are evaluating regional data hubs that several countries could share, which would spread costs and standardize cybersecurity protocols. This shared model could pave the way for cross-border low-altitude corridors governed by common digital rules if adopted.
*Our forecasts treat driver/restraint impacts as directional, not additive. The impact forecasts reflect baseline growth, mix effects, and variable interactions.
Segment Analysis
By Component – Software Platforms Dominate
Software accounts for 40.14% of the UTM market share in 2024, and its dominance rests on real-time plan validation and automated conflict resolution. Frequent code releases let providers match evolving rules faster than hardware refresh cycles, reducing compliance risk for operators. A current pattern is that national regulators prefer cloud software linked to multiple approved service suppliers rather than one central hub. That shift raises data-exchange volumes and makes low-latency architecture a core selling point.
Services grow at a 21.58% CAGR to 2030, the fastest pace among components, as airports outsource routine airspace management to managed-service teams. Outsourcing converts capital outlays into predictable operating fees, a useful lever for public budgeting. Integrators that once focused on IT workloads now pitch aviation compliance packages, widening the talent pool. Over time, service providers may bundle insurance and cybersecurity audits, creating one-stop shops for small operators. [2]SESAR 3 Joint Undertaking, “Bi-Annual Work Programme 2024-2025,” sesarju.eu


By Solution Type – Communication Infrastructure Leads
Communication infrastructure holds the largest UTM market size among solution types in 2024, driven by 5G tower build-outs and satellite gateways. Edge computing near base stations reduces round-trip latency, allowing higher flight densities without shrinking separation minima. Tower companies are already testing revenue-share deals that treat bandwidth as a metered utility for drones. This arrangement gives telecom landlords a direct stake in air traffic growth.
Navigation infrastructure ranks second in market share and gains traction through radar landing aids that work when satellite signals fade. Emergency agencies value the extra redundancy, and that demand pulls avionics suppliers into the UTM industry. Surveillance infrastructure completes the segment as passive RF sensors mature; falling false-positive rates let cities expand UTM coverage without multiplying staff. The improved picture of low-level airspace also helps law enforcement teams track unauthorized flights.
By Altitude – Below 200 ft Operations Dominate
Flights under 200 ft make up most commercial drone hours, thus ruling the UTM market share by altitude. Platforms ingest lamp-post weather data and high-resolution obstacle maps to steer aircraft through tight spaces, reducing noise complaints. One clear trend is that cities request noise-footprint analytics bundled with standard de-confliction, revealing a new service niche. Developers who can model acoustic impact will gain an edge in permit approvals.
The 200 to 400 ft layer posts the highest CAGR, lifted by middle-mile cargo and air-taxi climb-out paths. Regulators label this band the hand-off zone between UTM and conventional ATM, so standardised climb corridors are under review. Early trials show that fixed ascent funnels simplify controller tasks and cut coordination time. Once proven, the same funnels could host automated vertiport scheduling apps.
By End-use Industry – Logistics and Transportation Lead
Logistics accounts for 31.27% of the UTM market size in 2024, reflecting high parcel flight volumes around fulfilment hubs. Drone corridors near warehouses force UTM clouds to process thousands of plans each hour, and that load has led vendors to deploy regional edge clusters. The extra compute power spills over to agricultural users who share the same nodes, improving plan response times for lower-priority sectors. As retailers extend operating hours, night flights are now part of public consultations, adding fresh demand for low-light obstacle mapping.
Urban Air Mobility delivers the highest forecast CAGR at 30.20% through 2030 as airlines plan city-to-airport shuttle routes. Vertiport operators want predictive queuing algorithms that link power-grid capacity with flight slots, pushing UTM providers into energy-data partnerships. This crossover could let cities charge dynamic landing fees tied to grid load, a revenue idea now in feasibility studies. Other sectors, from energy inspection to emergency response, continue to adopt UTM tools, but they ride on infrastructure paid for by the larger logistics and UAM users.
By Service Type – Flight Information Services Dominate
Flight information services hold 25.59% UTM market share and are the backbone for plan submission, weather feeds, and geo-fence updates. High uptime is now written into contracts, mirroring internet content-delivery agreements. Vendors introduce premium tiers that guarantee sub-second data refresh, letting operators pay for risk tolerance. Sub-tier pricing also gives hobby pilots low-cost access, ensuring widespread compliance.
Security services rise at a 25.12% CAGR as infrastructure owners insist on integrated threat detection. Counter-UAS suites plug directly into UTM dashboards, so operators can alert police without switching apps. Insurance firms reward systems that prove they can shut down unauthorized flights in under two minutes, a metric that now appears in some policies. Over time, real-time threat scores may feed into plan-approval logic, blocking risky flights before take-off.
By Deployment Model – Cloud-based Solutions Lead
Cloud deployments took the largest UTM market share in 2024 because elastic compute scales with seasonal peaks. Regulators appreciate anonymous statistical outputs that inform policy tweaks, and that feedback shortens rule cycles. Some agencies still require on-premise modules for sovereign data, so hybrid stacks place authorization code on local servers while analytics run in public clouds. This split lets states adopt new features without breaching data laws.
On-premise systems persist where microsecond latency is vital or back-up comms are weak. Mining sites and offshore rigs tend to choose local deployments that keep mission data on site. Vendors now offer containerized builds that shift between cloud and edge as links vary, giving operators flexibility without vendor lock-in.
Geography Analysis
North America controls 32.80% of the unmanned traffic management market share, supported by the Federal Aviation Administration’s (FAA's) structured roadmap and the Low Altitude Authorization and Notification Capability program. Venture funding and state research grants give startups the runway to field-test new modules quickly. A fresh trend is that state transport departments act as conveners across law enforcement, telecom, and airport stakeholders, cutting negotiation time for new corridors. This coordination means North American cities often issue flight approvals months ahead of peers, which draws foreign operators seeking predictable rules.
Asia-Pacific posts the fastest CAGR at 28.94% as China funds a “low-altitude economy” and Japan formalises national UTM specifications. Municipal grants for vertiports and 5G densification let cloud platforms go live before heavy traffic arrives, proving that infrastructure can precede demand. South Korea’s national UTM backbone sets a precedent for end-to-end public networks, and smaller states are watching the results before copying the design. A visible side effect is that hardware makers certify radios for local bands earlier, speeding regional product launches.
Europe advances under a binding U-Space rule set that mandates geo-awareness, e-identification, and traffic information for every flight. The SESAR program earmarks EUR 254 million (USD 290 million) for further automation research, prioritizing air-ground connectivity. [3]European Commission, “Drone Strategy 2.0,” ec.europa.eu Cross-border pilots test data-token formats against privacy laws to prevent fragmentation. Recent vendor mergers indicate that providers seek scale to serve pan-regional contracts, and that consolidation could lower per-user costs in smaller member states.

Competitive Landscape
The supplier mix spans incumbent avionics giants, agile software start-ups, and telecom carriers embedding UTM APIs in 5G cores. Airbus Helicopters expanded unmanned capabilities via targeted acquisitions, while Thales integrates AI modules for predictive traffic sequencing. Partnerships dominate: Aloft collaborates with Terra Drone and Unifly on advanced air-mobility pilots; ANRA aligns with cellular operators to embed native BVLOS coverage.
White-space opportunities remain in payload-aware routing for heavy-lift drones, thermal imagery corridors for wildfire monitoring, and blockchain-secured flight-log attestation. Vendors differentiate through plug-and-play compliance engines that auto-map varying national rules into operator dashboards.
Cyber-resilience is a rising battleground, with NASA prototypes showing ledger-based identity verification for urban air-mobility environments.[4]National Aeronautics and Space Administration, “Blockchain-Enabled Secure Data Exchange for Urban Air Mobility,” nasa.gov Providers that achieve third-party certification under ISO/IEC 27001 gain tender preference from utilities and public-safety agencies. As consolidation progresses, the combined share of the top five suppliers approaches 45%, indicating a moderately concentrated field while leaving room for specialised entrants.
Unmanned Traffic Management Industry Leaders
Altitude Angel Ltd.
OneSky Systems, Inc.
Thales Group
Airbus SE
Unifly (Terra Drone Corporation)
- *Disclaimer: Major Players sorted in no particular order

Recent Industry Developments
- May 2025: EHang and partners announced its plans to set up 100 air-traffic terminals to support low-altitude logistics in an effort that will extend UTM coverage to tourist routes.
- April 2025: Unifly’s platform completed multi-city demonstrations under the Corus XUAM project, confirming readiness for dense urban air mobility.
- January 2025: Aloft Technologies, Inc. released a UTM software-development kit with DroneLink as launch partner, opening its traffic stack to external apps.
- January 2025: Terra Drone Corporation, a drone and urban air mobility technology company based in Japan, conducted Indonesia's first demonstration of multi-drone operations using a UTM platform in the suburbs of Jakarta. The demonstration was part of the "Industrial Cooperation Programme in the Global South through Technology Transfer."


Research Methodology Framework and Report Scope
Market Definitions and Key Coverage
Our study defines the unmanned traffic management (UTM) market as the suite of software, communication links, ground-based detect-and-avoid hardware, and associated services that orchestrate low-altitude drone flights below 400 ft for civil and commercial purposes. Values reflect revenues captured by suppliers that build and maintain these systems.
Scope exclusion: conventional air-traffic-management solutions for crewed aviation and integrated drone hardware sales are not counted.
Segmentation Overview
- By Component
- Hardware
- Ground-based Detect and Avoid Systems
- Remote Identification Devices
- Communication Infrastructure
- Software
- UTM Platform Software
- Flight Information Management
- Airspace Design and Simulation
- Services
- Integration and Deployment
- Managed Services
- Support and Maintenance
- Hardware
- By Solution Type
- Communication Infrastructure
- Navigation Infrastructure
- Surveillance Infrastructure
- By Altitude
- Below 200 ft
- 200 to 400 ft
- By End-use Industry
- Logistics and Transportation
- Agriculture and Forestry
- Surveillance and Monitoring
- Energy and Utilities Inspection
- Emergency and Disaster Management
- Urban Air Mobility (UAM)
- By Service Type
- Security Services
- Flight Information Services
- Network Identification Services
- Weather Services
- By Deployment Model
- Cloud-based
- On-premise
- By Geography
- North America
- United States
- Canada
- Mexico
- Europe
- Germany
- United Kingdom
- France
- Russia
- Rest of Europe
- Asia-Pacific
- China
- Japan
- South Korea
- India
- Rest of Asia-Pacific
- South America
- Brazil
- Rest of South America
- Middle East and Africa
- Middle East
- Saudi Arabia
- United Arab Emirates
- Israel
- Rest of Middle East
- Africa
- South Africa
- Nigeria
- Rest of Africa
- Middle East
- North America
Detailed Research Methodology and Data Validation
Primary Research
Mordor analysts interview air-navigation officials, UTM platform architects, independent drone operators, and logistics fleet integrators across North America, Europe, and key Asia-Pacific corridors. These conversations validate adoption hurdles, average service fees, and likely roll-out timelines that secondary sources rarely quantify.
Desk Research
Publicly available datasets from bodies such as the FAA, EASA, and ICAO provide annual drone-registration counts and BVLOS waiver trends, which signal addressable flight volumes. Trade associations, including GUTMA and AUVSI, publish flight-hour benchmarks, while patent libraries accessed through Questel reveal technology diffusion rates. Financial clues are gathered from SEC 10-Ks, selected tenders on Tenders Info, and procurement releases posted by ANSPs. Dow Jones Factiva supplements these inputs with timely contract news. The sources cited above are illustrative; many additional materials feed the evidence base.
Market-Sizing & Forecasting
A top-down reconstruction starts with registered drones and projected flight-hour growth, then applies penetration rates for managed airspace usage and average UTM service tariffs to create a revenue pool, which is further filtered through regional regulatory readiness factors. Select bottom-up checks, such as sampled platform license counts and estimated ASP × deployment numbers, calibrate the totals. Variables that move the model include drone fleet expansion, BVLOS authorization ratios, mandated Remote ID compliance, cellular/5G coverage, and U-space corridor mileage. Multivariate regression against these drivers generates the 2025-2030 forecast line, and scenario analysis bounds upside from urban-air-mobility corridors.
Data Validation & Update Cycle
Outputs pass a two-level analyst peer review, followed by variance checks against carrier-flight submissions and contract announcements. The dashboard refreshes yearly; mid-cycle re-runs trigger if material policy or funding shocks occur and are signed off before client release.
Why Mordor's Unmanned Traffic Management Baseline Earns Trust
Published estimates often diverge because firms pick different revenue elements, time stamps, and policy assumptions.
Largest gaps stem from whether drone-hardware sales are blended with traffic-services revenues, the chosen base year, currency conversion timing, and how aggressively future urban-air-mobility flights are baked in. Mordor's model reports only verified service-side earnings for 2025 and adjusts for phased regulatory enforcement, whereas some publishers extrapolate hardware ASPs or apply uniform global rollout rates.
Benchmark comparison
| Market Size | Anonymized source | Primary gap driver |
|---|---|---|
| USD 241.15 million (2025) | Mordor Intelligence | - |
| USD 214.7 million (2024) | Global Consultancy A | Older base year and limited Asia-Pacific sampling |
| USD 2.11 billion (2025) | Industry Journal B | Includes drone hardware and pilot-training fees |
| USD 106 million (2022) | Regional Think-Tank C | Pre-Remote ID baseline and no service-fee inflation |
Taken together, the comparison shows that Mordor's disciplined scoping, balanced variables, and annual refresh cadence deliver a transparent, repeatable baseline that decision-makers can rely on when sizing opportunities or benchmarking market entry plans.


Key Questions Answered in the Report
What drives current growth in the Unmanned Traffic Management market?
Regulatory progress on BVLOS flights, rising logistics demand, and improved 5G-satellite connectivity underpin the sector’s strong CAGR.
How large is the Unmanned Traffic Management market in financial terms?
The 2025 Unmanned Traffic Management market size is USD 241.15 million and is forecasted to reach USD 935.62 million by 2030, reflecting a CAGR of 31.15%.
Which region currently dominates the Unmanned Traffic Management industry?
North America holds the highest Unmanned Traffic Management market share, though Asia Pacific is expanding the fastest.
Why are cloud-based UTM solutions gaining traction?
They offer elasticity, lower upfront costs, and faster updates, meeting operator needs amid evolving regulations.
Which end-use sector generates the most demand today?
Logistics and transportation lead due to escalating middle-mile and last-mile drone delivery volumes.
What barriers could impede market expansion?
Fragmented spectrum policies, costly integration with legacy air-traffic systems, and uneven global standards pose significant challenges.
Page last updated on:


