Market Overview
| Study Period | 2018 - 2031 |
|---|---|
| Forecast Data Period | 2026 - 2031 |
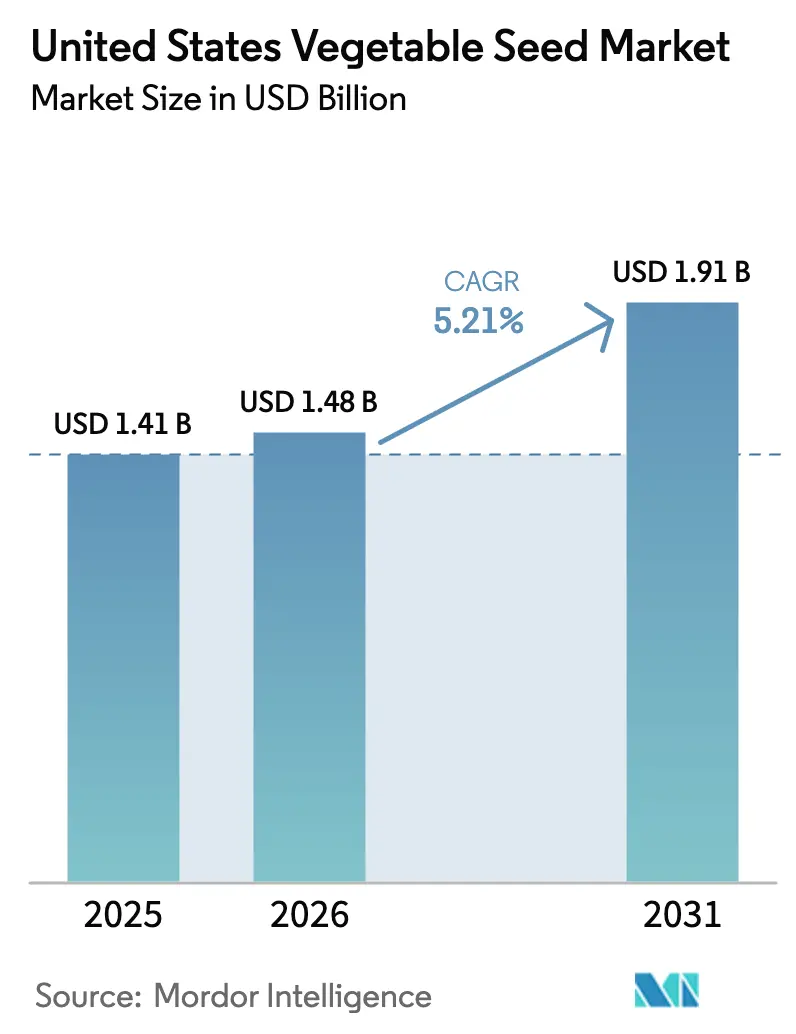
| Base Year Market Size (2025) | USD 1.41 Billion |
| Market Size (2026) | USD 1.48 Billion |
| Market Size (2031) | USD 1.91 Billion |
| Growth Rate (2026 - 2031) | 5.21% CAGR |
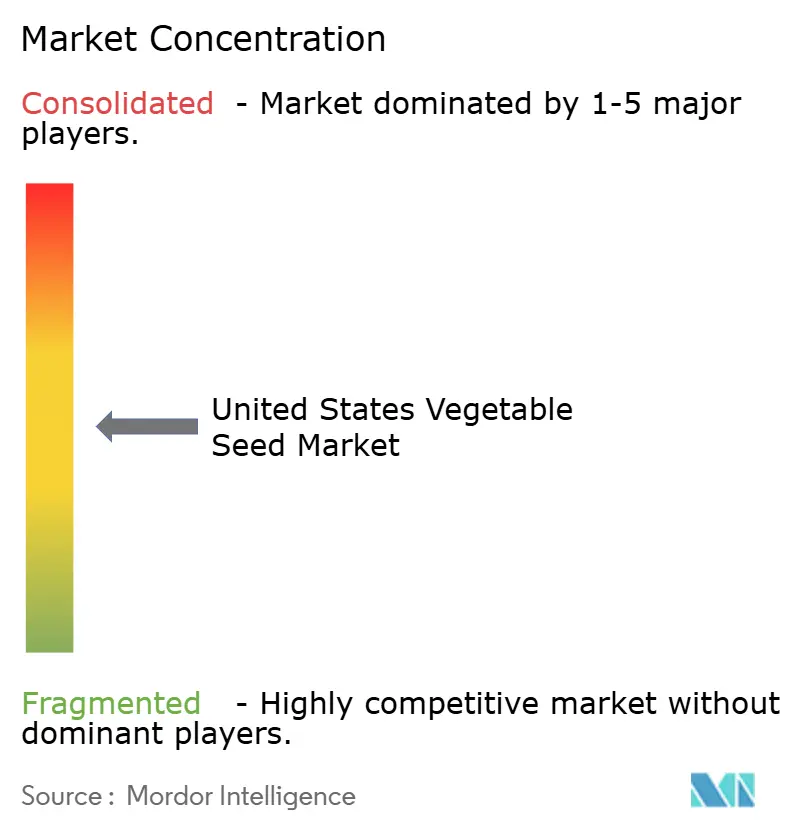
| Market Concentration | Medium |
Major Players *Disclaimer: Major Players sorted in no particular order Image © Mordor Intelligence. Reuse requires attribution under CC BY 4.0. | |
United States Vegetable Seed Market Analysis by Mordor Intelligence
The United States vegetable seed market size is expected to grow from USD 1.41 billion in 2025 to USD 1.48 billion in 2026 and is forecast to reach USD 1.91 billion by 2031 at 5.21% CAGR over 2026-2031. Demand scales steadily because controlled-environment farming, precision breeding, and climate-smart cultivation give growers predictable yields and premium crop quality across seasons. A dominant hybrid seed foothold underscores reliability in disease resistance and yield uniformity, while expanding protected cultivation mitigates weather volatility and water restrictions. Crop-specific momentum emerges as Solanaceae benefits from rising tomato and pepper consumption, and gene-edited traits shorten breeding cycles. Moderate industry concentration spurs both pricing pressure and technological competition, with biological seed coatings and traceability programs creating new value avenues. Federal climate-smart grants, retailer sourcing standards, and urban vertical farming further lift year-round seed demand even as labor shortages and water allocation limits pose operational risks.
Key Report Takeaways
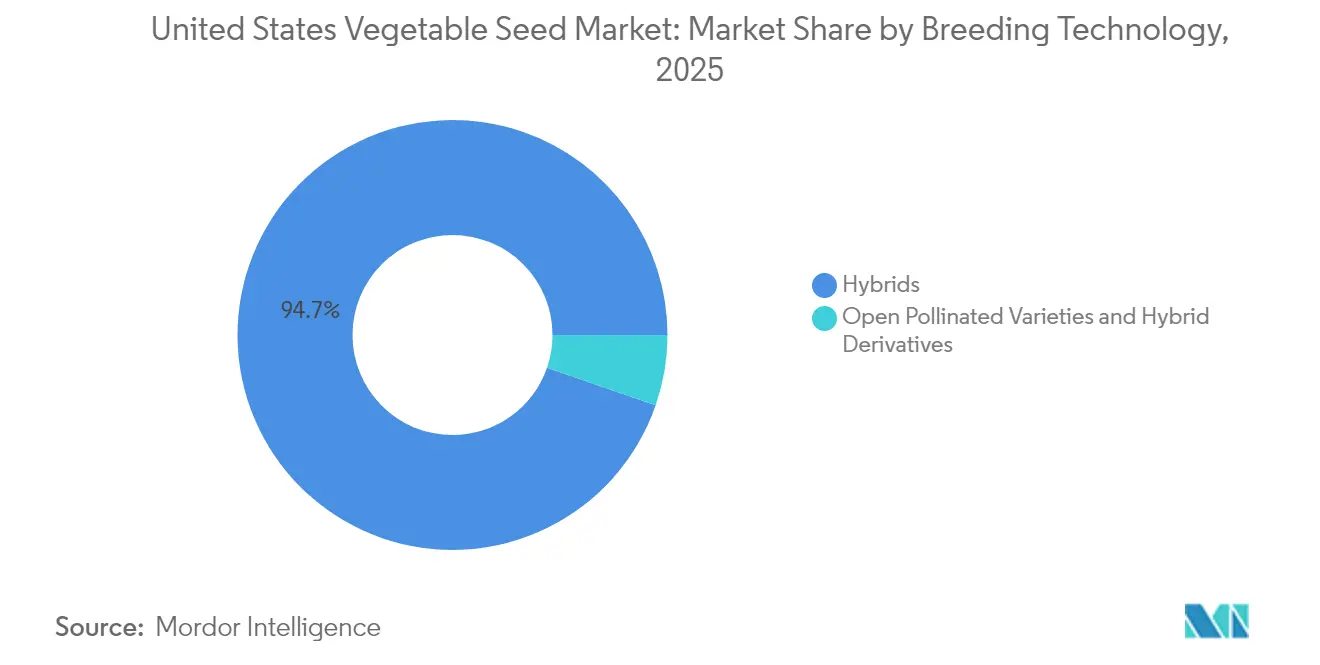
- By breeding technology, hybrids held 94.70% of the United States vegetable seed market share in 2025 while advancing at a 5.19% CAGR through 2031.
- By cultivation mechanism, open-field production accounted for 91.86% of the United States vegetable seed market size in 2025, while protected cultivation is forecast to post an 8.22% CAGR to 2031.
- By crop family, Cucurbits led with a 29.85% share of the United States vegetable seed market size in 2025, while Solanaceae is projected to expand at a 7.72% CAGR through 2031.
Note: Market size and forecast figures in this report are generated using Mordor Intelligence’s proprietary estimation framework, updated with the latest available data and insights as of 2026.
United States Vegetable Seed Market Trends and Insights
Drivers Impact Analysis*
| Driver | (~) % Impact on CAGR Forecast | Geographic Relevance | Impact Timeline |
|---|---|---|---|
| Surge in controlled-environment agriculture acreage | +1.2% | National, concentrated in California, Texas, and Florida | Medium term (2-4 years) |
| Rising consumer demand for specialty and ethnic vegetables | +0.8% | National, urban markets emphasis | Short term (≤ 2 years) |
| Rapid adoption of CRISPR-enabled precision breeding | +0.9% | National, early adoption in Midwest, and California | Long term (≥ 4 years) |
| Growing investments in biological seed treatments by US mid-sized growers | +0.5% | Midwest, Southeast regions | Medium term (2-4 years) |
| USDA climate-smart funding accelerating resilient cultivar demand | +0.7% | National, priority in drought-prone regions | Medium term (2-4 years) |
| Retailer-driven traceability programs favoring certified hybrid seeds | +0.6% | National, supply chain focused | Short term (≤ 2 years) |
| Source: Mordor Intelligence | |||
Surge in Controlled-Environment Agriculture Acreage
Greenhouses and vertical farms more than doubled between 2012 and 2019, driving specialized seed demand tailored to hydroponic and aeroponic systems.[1]Source: Erik Dohlman et al., “Trends, Insights, and Future Prospects for Production in Controlled Environment Agriculture and Agrivoltaics Systems,” USDA Economic Research Service, ers.usda.gov Protected environments deliver 3-4 times higher yield per square meter than open fields, justifying capital investment despite high upfront costs. Breeding programs now target compact canopies and uniform germination to suit stacked layers and recirculating nutrients. Texas research shows root-zone cooling and LED spectrum shifts improve yield stability, steering seed selection toward cultivars tolerant of artificial light intensity. Consequently, the United States vegetable seed market benefits from resilient year-round production that cushions weather-related supply swings.
Rising Consumer Demand for Specialty and Ethnic Vegetables
Sixty-eight percent of shoppers purchase a broader produce mix than two years earlier, expanding demand for heritage tomatoes, Asian greens, and specialty peppers. Premium price points motivate breeders to develop niche varieties without sacrificing disease resistance. Urban grocers and meal-kit providers spotlight flavor diversity, prompting processors to seek distinct nutritional profiles for sauces and frozen blends. The United States vegetable seed market, therefore, aligns breeding priorities with culinary trends, capturing value in both fresh and processed channels.
Rapid Adoption of CRISPR-Enabled Precision Breeding
Gene-edited mustard greens entered retail channels in 2024, confirming regulatory latitude under the United States Department of Agriculture Animal and Plant Health Inspection Service (USDA-APHIS) product-based framework. Ninety-nine APHIS confirmations since 2021 cover multiple vegetable crops, signaling mainstream acceptance of precise trait edits devoid of foreign DNA. Pairwise and Corteva formed a joint venture to accelerate commercialization, and Bayer licensed ten edited leafy-green lines, shortening breeding cycles and lowering development cost. Traits ranging from extended shelf life to lower bitterness reach growers faster, reinforcing hybrid seed value and solidifying growth in the United States vegetable seed market.
Growing Investments in Biological Seed Treatments by Mid-Sized Growers
Mid-sized farms adopt microbial coatings and ultraviolet priming to reduce synthetic pesticides, aligning with retailer residue limits and Integrated Pest Management (IPM) goals. Trichoderma biopriming enhances root vigor under organic protocols, while microencapsulated nutrients support early growth in low-input systems. These sustainable approaches improve sowing uniformity and seedling survival, boosting adoption of high-value hybrids and fostering incremental revenue within the United States vegetable seed market.
Restraints Impact Analysis*
| Restraint | (~) % Impact on CAGR Forecast | Geographic Relevance | Impact Timeline |
|---|---|---|---|
| Consolidation-driven price increases for hybrid seeds | -0.8% | National, affecting small to mid-sized operations | Short term (≤ 2 years) |
| Regulatory uncertainty around gene-edited vegetable traits | -0.6% | National, export market implications | Medium term (2-4 years) |
| Labor shortages limiting expansion of high-value crops | -0.9% | California, Florida, Texas, and Arizona | Short term (≤ 2 years) |
| Water-use restrictions in key vegetable belts | -0.7% | California Central Valley and Southwest regions | Long term (≥ 4 years) |
| Source: Mordor Intelligence | |||
Consolidation-Driven Price Increases for Hybrid Seeds
Five multinationals control 56% of supply, giving them leverage to raise hybrid prices, which squeezes margins at smaller farms. Smaller growers face reduced negotiating power and limited alternative suppliers for specialized hybrid varieties, forcing acceptance of higher seed costs that compress profit margins on vegetable production. The concentration effect intensifies for proprietary traits and disease-resistant varieties where patent protection limits competitive alternatives, enabling premium pricing strategies that may exceed growers' willingness to pay. Mid-sized operations particularly struggle with seed cost inflation as they lack the volume purchasing power of large commercial growers, yet require hybrid performance characteristics to remain competitive in wholesale markets. Price increases for hybrid seeds may drive some growers toward open-pollinated varieties or saved seed practices, potentially reducing overall market value despite continued acreage expansion.
Water-Use Restrictions in Key Vegetable Belts
California’s Sustainable Groundwater Management Act (SGMA) and drought curtailments reduce irrigation allocations by 20-40%, forcing acreage shifts or fallowing.[2]Source: University of California Agriculture and Natural Resources, “Groundwater Sustainability and Drought Impacts,” ucanr.edu Groundwater sustainability regulations impose additional constraints on irrigation-dependent vegetable production, creating long-term uncertainty about production capacity in traditional growing regions. Arizona and other Southwest states implement similar water conservation measures that affect vegetable acreage and corresponding seed requirements. The restrictions drive interest in drought-tolerant varieties and water-efficient production systems, but overall market impact remains negative as reduced acreage outweighs efficiency gains from improved genetics.
*Our forecasts treat driver/restraint impacts as directional, not additive. The impact forecasts reflect baseline growth, mix effects, and variable interactions.
Segment Analysis
By Breeding Technology: Hybrid Dominance Reinforces Quality Standards
Hybrids command a dominant 94.70% market share in 2025, reflecting growers' preference for consistent performance, disease resistance, and yield reliability that justify premium seed pricing compared to open-pollinated alternatives. The segment's 5.19% CAGR through 2031 aligns with overall market growth, indicating stable demand patterns despite pricing pressures from industry consolidation. Open-pollinated varieties and hybrid derivatives serve specialized markets including organic production, seed-saving operations, and heritage variety preservation programs, though their combined market presence remains limited to niche applications. Hybrid seed development increasingly incorporates precision breeding techniques, with companies like Pairwise and Bayer advancing gene-edited varieties that maintain hybrid vigor while adding specific trait modifications.
The breeding technology landscape reflects broader agricultural trends toward biotechnology integration and sustainable production practices. CRISPR-enabled modifications allow hybrid developers to incorporate traits such as extended shelf life, enhanced nutritional content, and improved stress tolerance without traditional backcrossing timelines that delay variety releases. Seed companies invest heavily in hybrid development programs that combine conventional breeding excellence with molecular marker technologies and gene editing capabilities to accelerate trait integration and variety performance optimization.


By Cultivation Mechanism: Protected Systems Drive Innovation
Protected cultivation emerges as the fastest-growing segment at 8.22% CAGR through 2031, despite open field production maintaining a commanding 91.86% market share in 2025. This growth disparity reflects economic incentives for controlled-environment agriculture that delivers 3-4 times higher yields per unit area compared to traditional field production. Greenhouse and hydroponic systems require specialized seed varieties optimized for soilless media, recirculating nutrient solutions, and artificial lighting conditions that differ significantly from field environments, Virginia Cooperative Extension. Texas research initiatives demonstrate controlled-environment agriculture's potential for resource-use efficiency and climate-smart food systems, with a specific focus on LED light quality effects and root-zone cooling technologies that influence variety selection.
Open field cultivation continues serving the majority of the United States vegetable production through established supply chains and cost-effective production methods suitable for processing vegetables and large-scale fresh market operations. Climate variability and water restrictions increasingly challenge field production reliability, driving some growers toward protected systems that offer greater environmental control and predictable harvest timing. The cultivation mechanism segmentation reflects broader agricultural transformation toward intensive production systems that maximize output per unit of land and water resources.
By Crop Family: Solanaceae Growth Outpaces Traditional Leaders
Solanaceae demonstrates the strongest growth trajectory at 7.72% CAGR through 2031, driven by expanding demand for tomatoes, peppers, and eggplants in both fresh and processed applications. This growth rate significantly exceeds the overall market expansion, indicating shifting consumer preferences toward these versatile vegetables that serve diverse culinary applications and processing uses. Cucurbits maintain the largest market share at 29.85% in 2025, reflecting established production systems for cucumbers, squash, and melons that serve both fresh and processing markets through well-developed supply chains. Brassicas, roots and bulbs, and unclassified vegetables each serve specific market niches with steady but modest growth rates that align with traditional consumption patterns and established production practices.
The crop family dynamics reflect broader dietary trends toward fresh vegetables with extended shelf life and versatile preparation options that appeal to diverse consumer segments. Bayer's collaboration with G+FLAS to develop vitamin D3-enhanced tomatoes exemplifies innovation efforts targeting nutritional enhancement within the high-growth Solanaceae segment. Specialty pepper varieties and heritage tomato types capture premium pricing in farmers' markets and direct-to-consumer channels, while processing tomatoes and peppers serve industrial applications with consistent volume demand that supports large-scale seed sales.

Geography Analysis
California commands the largest share of the United States vegetable seed market, though persistent drought, SGMA rules, and escalating water prices encourage a pivot toward drought-tolerant cultivars and deficit-irrigation strategies. Coastal valleys maintain high-value leafy greens production, leveraging mild winters and proximity to processors for year-round planting, which stabilizes seed turnover.
Florida supplies winter tomatoes, peppers, and cucumbers to northern states, capitalizing on favorable winter temperatures and robust logistics infrastructure. Tropical storms and labor costs remain challenges, but protected culture acreage in central Florida rises as growers hedge against rainfall extremes. Texas demonstrates rapid adoption of climate-smart varieties suited to hot summers and sporadic rainfall. Research from Texas A&M AgriLife underpins cultivar choice for high-tech greenhouse clusters near Houston and Dallas.
Arizona, New Mexico, and the broader Southwest face strict water quotas, prompting acreage consolidation and a shift toward high-margin baby leaf greens in climate-controlled structures. Meanwhile, the Midwest and Southeast diversify into controlled-environment and field-grown specialty crops, distributing seed demand more evenly across the United States vegetable seed market. Urban vertical farms in Chicago, New York, and Atlanta generate small but high-frequency orders for fast-cycling leafy cultivars, underscoring geographic decentralization of vegetable supply chains.
Competitive Landscape
Five leading firms capture a significant share of revenue, giving the United States vegetable seed market a moderate concentration profile. Global multinationals leverage expansive breeding libraries, molecular labs, and scale economies to defend core crops such as tomatoes, peppers, cucumbers, and leafy greens. Their dominance is reinforced by distribution agreements with national input retailers, ensuring farm-level reach and brand loyalty.
Niche breeders carve out a share through ethnic vegetable catalogs, organic-certified lines, and regionally adapted heirlooms, while startups deploy CRISPR platforms to add premium traits. Pairwise’s Series C infusion and collaboration with Corteva accelerate gene-edited leafy greens releases, signaling venture capital commitment to shorter breeding cycles. Biological seed treatment specialists partner with mid-sized seed houses to bundle microbe-enhanced coatings onto hybrid offerings, adding differentiation without altering genetics.
Retail traceability mandates favor companies that document parental lines, lot histories, and treatment protocols in blockchain systems. This capability widens the gap between incumbents and small regional suppliers that lack digital infrastructure. Patent filings covering parthenocarpy, taste modulation, and abiotic stress tolerance increase annually, evidencing sustained R&D intensity that underpins long-term competitiveness in the United States vegetable seed market.
United States Vegetable Seed Industry Leaders
Bayer AG
Syngenta Group
BASF SE
Rijk Zwaan Zaadteelt en Zaadhandel BV
Groupe Limagrain
- *Disclaimer: Major Players sorted in no particular order

Recent Industry Developments
- August 2025: Syngenta Vegetable Seeds held its first Future Veg event in Woodland, California, displaying more than 400 vegetable varieties and new technologies. The event demonstrated Syngenta's focus on innovation, grower partnerships, and sustainable practices in the U.S. and global vegetable seed markets.
- February 2025: Namdhari Seeds, an Indian company, acquired a 100% stake in Axia's United States-based open-field vegetable seed business. The acquisition strengthens Namdhari's global presence in open-field crops, including tomato, pepper, and melon, while providing access to U.S. germplasm, research and development capabilities, and market distribution channels.
- May 2024: Bayer advanced genome-editing initiatives through partnership with G+FLAS to develop vitamin D3-enhanced tomatoes and exclusive licensing agreement with Pairwise for 10 gene-edited greens varieties, expanding its open-innovation platform for enhanced vegetables.


United States Vegetable Seed Market Report Scope
Hybrids, Open Pollinated Varieties & Hybrid Derivatives are covered as segments by Breeding Technology. Open Field, Protected Cultivation are covered as segments by Cultivation Mechanism. Brassicas, Cucurbits, Roots & Bulbs, Solanaceae, Unclassified Vegetables are covered as segments by Crop Family.Breeding Technology
| Hybrids |
| Open Pollinated Varieties and Hybrid Derivatives |
Cultivation Mechanism
| Open Field |
| Protected Cultivation |
Crop Family
| Brassicas | Cabbage |
| Cauliflower and Broccoli | |
| Other Brassicas | |
| Cucurbits | Cucumber and Gherkin |
| Pumpkin and Squash | |
| Other Cucurbits | |
| Roots and Bulbs | Garlic |
| Onion | |
| Potato | |
| Other Roots and Bulbs | |
| Solanaceae | Chilli |
| Eggplant | |
| Tomato | |
| Other Solanaceae | |
| Unclassified Vegetables | Asparagus |
| Lettuce | |
| Okra | |
| Peas | |
| Spinach | |
| Other Unclassified Vegetables |
| Breeding Technology | Hybrids | |
| Open Pollinated Varieties and Hybrid Derivatives | ||
| Cultivation Mechanism | Open Field | |
| Protected Cultivation | ||
| Crop Family | Brassicas | Cabbage |
| Cauliflower and Broccoli | ||
| Other Brassicas | ||
| Cucurbits | Cucumber and Gherkin | |
| Pumpkin and Squash | ||
| Other Cucurbits | ||
| Roots and Bulbs | Garlic | |
| Onion | ||
| Potato | ||
| Other Roots and Bulbs | ||
| Solanaceae | Chilli | |
| Eggplant | ||
| Tomato | ||
| Other Solanaceae | ||
| Unclassified Vegetables | Asparagus | |
| Lettuce | ||
| Okra | ||
| Peas | ||
| Spinach | ||
| Other Unclassified Vegetables | ||


Market Definition
- Commercial Seed - For the purpose of this study, only commercial seeds have been included as part of the scope. Farm-saved Seeds, which are not commercially labeled are excluded from scope, even though a minor percentage of farm-saved seeds are exchanged commercially among farmers. The scope also excludes vegetatively reproduced crops and plant parts, which may be commercially sold in the market.
- Crop Acreage - While calculating the acreage under different crops, the Gross Cropped Area has been considered. Also known as Area Harvested, according to the Food & Agricultural Organization (FAO), this includes the total area cultivated under a particular crop across seasons.
- Seed Replacement Rate - Seed Replacement Rate is the percentage of area sown out of the total area of crop planted in the season by using certified/quality seeds other than the farm-saved seed.
- Protected Cultivation - The report defines protected cultivation as the process of growing crops in a controlled environment. This includes greenhouses, glasshouses, hydroponics, aeroponics, or any other cultivation system that protects the crop against any abiotic stress. However, cultivation in an open field using plastic mulch is excluded from this definition and is included under open field.
| Keyword | Definition |
|---|---|
| Row Crops | These are usually the field crops which include the different crop categories like grains & cereals, oilseeds, fiber crops like cotton, pulses, and forage crops. |
| Solanaceae | These are the family of flowering plants which includes tomato, chili, eggplants, and other crops. |
| Cucurbits | It represents a gourd family consisting of about 965 species in around 95 genera. The major crops considered for this study include Cucumber & Gherkin, Pumpkin and squash, and other crops. |
| Brassicas | It is a genus of plants in the cabbage and mustard family. It includes crops such as carrots, cabbage, cauliflower & broccoli. |
| Roots & Bulbs | The roots and bulbs segment includes onion, garlic, potato, and other crops. |
| Unclassified Vegetables | This segment in the report includes the crops which don’t belong to any of the above-mentioned categories. These include crops such as okra, asparagus, lettuce, peas, spinach, and others. |
| Hybrid Seed | It is the first generation of the seed produced by controlling cross-pollination and by combining two or more varieties, or species. |
| Transgenic Seed | It is a seed that is genetically modified to contain certain desirable input and/or output traits. |
| Non-Transgenic Seed | The seed produced through cross-pollination without any genetic modification. |
| Open-Pollinated Varieties & Hybrid Derivatives | Open-pollinated varieties produce seeds true to type as they cross-pollinate only with other plants of the same variety. |
| Other Solanaceae | The crops considered under other Solanaceae include bell peppers and other different peppers based on the locality of the respective countries. |
| Other Brassicaceae | The crops considered under other brassicas include radishes, turnips, Brussels sprouts, and kale. |
| Other Roots & Bulbs | The crops considered under other roots & bulbs include Sweet Potatoes and cassava. |
| Other Cucurbits | The crops considered under other cucurbits include gourds (bottle gourd, bitter gourd, ridge gourd, Snake gourd, and others). |
| Other Grains & Cereals | The crops considered under other grains & cereals include Barley, Buck Wheat, Canary Seed, Triticale, Oats, Millets, and Rye. |
| Other Fibre Crops | The crops considered under other fibers include Hemp, Jute, Agave fibers, Flax, Kenaf, Ramie, Abaca, Sisal, and Kapok. |
| Other Oilseeds | The crops considered under other oilseeds include Ground nut, Hempseed, Mustard seed, Castor seeds, safflower seeds, Sesame seeds, and Linseeds. |
| Other Forage Crops | The crops considered under other forages include Napier grass, Oat grass, White clover, Ryegrass, and Timothy. Other forage crops were considered based on the locality of the respective countries. |
| Pulses | Pigeon peas, Lentils, Broad and horse beans, Vetches, Chickpeas, Cowpeas, Lupins, and Bambara beans are the crops considered under pulses. |
| Other Unclassified Vegetables | The crops considered under other unclassified vegetables include Artichokes, Cassava Leaves, Leeks, Chicory, and String beans. |


Research Methodology
Mordor Intelligence follows a four-step methodology in all our reports.
- Step-1: IDENTIFY KEY VARIABLES: In order to build a robust forecasting methodology, the variables and factors identified in Step-1 are tested against available historical market numbers. Through an iterative process, the variables required for market forecast are set and the model is built on the basis of these variables.
- Step-2: Build a Market Model: Market-size estimations for the forecast years are in nominal terms. Inflation is not a part of the pricing, and the average selling price (ASP) is kept constant throughout the forecast period.
- Step-3: Validate and Finalize: In this important step, all market numbers, variables and analyst calls are validated through an extensive network of primary research experts from the market studied. The respondents are selected across levels and functions to generate a holistic picture of the market studied.
- Step-4: Research Outputs: Syndicated Reports, Custom Consulting Assignments, Databases, and Subscription Platforms


