Soybean Seed Market Size and Share
Market Overview
| Study Period | 2018 - 2031 |
|---|---|
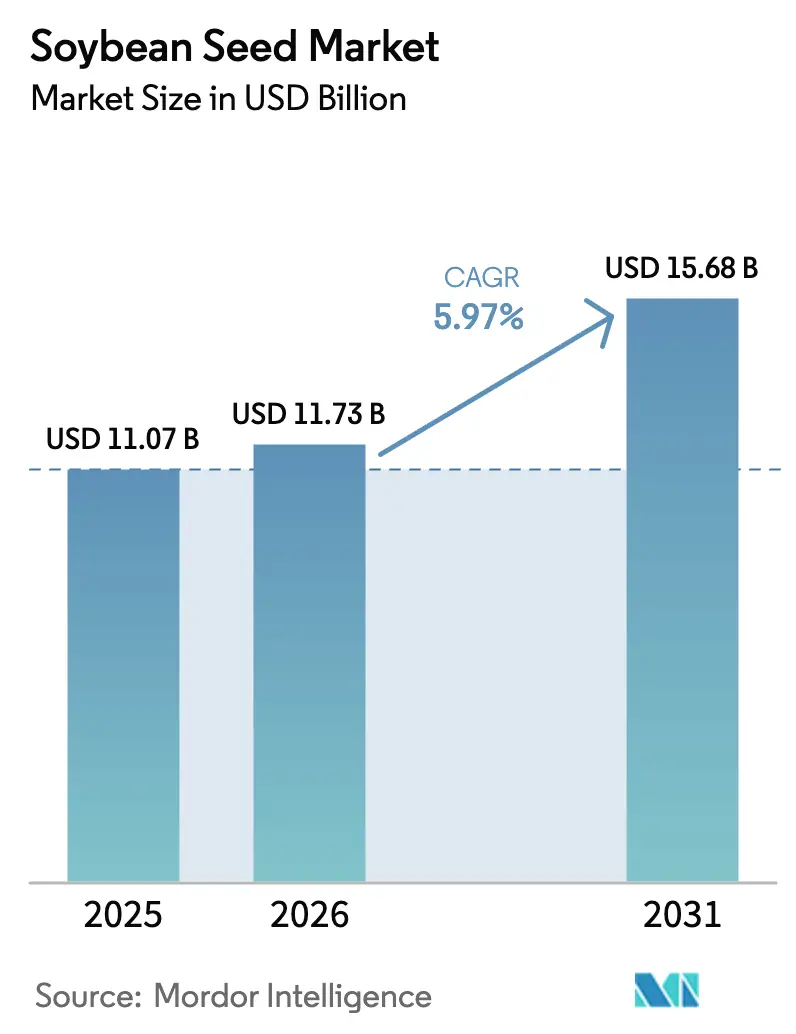
| Market Size (2026) | USD 11.73 Billion |
| Market Size (2031) | USD 15.68 Billion |
| Growth Rate (2026 - 2031) | 5.97% CAGR |
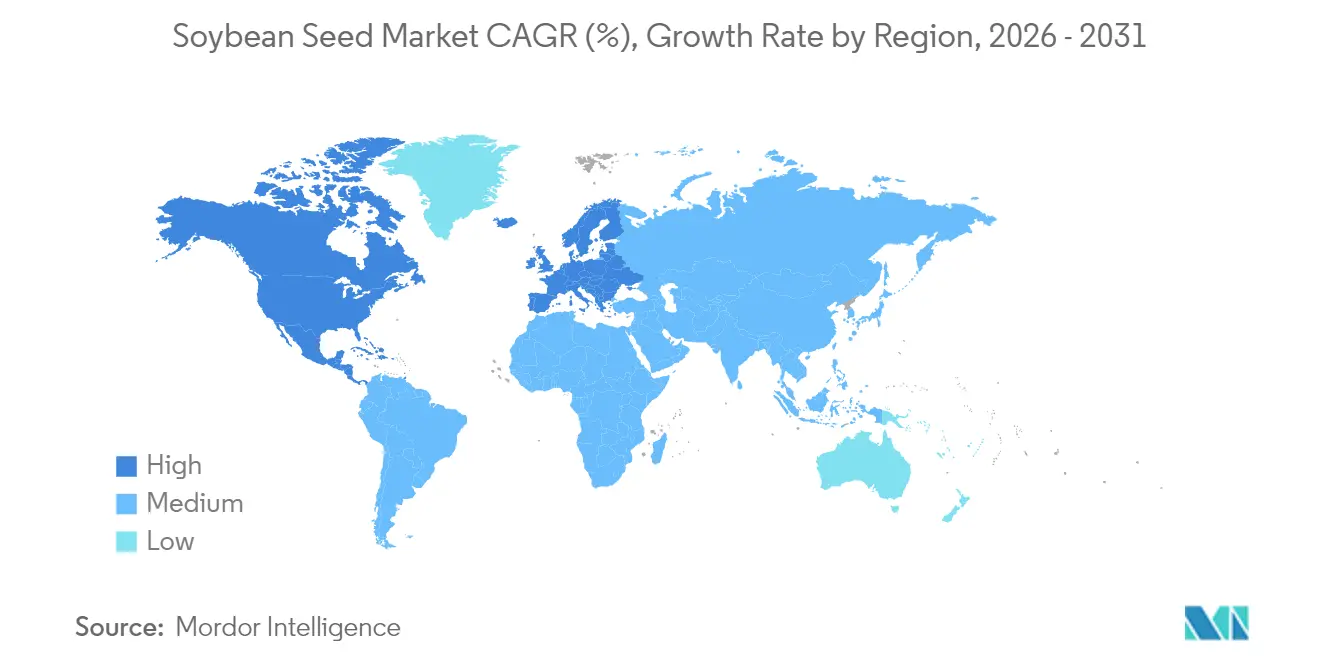
| Fastest Growing Market | Europe |
| Largest Market | North America |
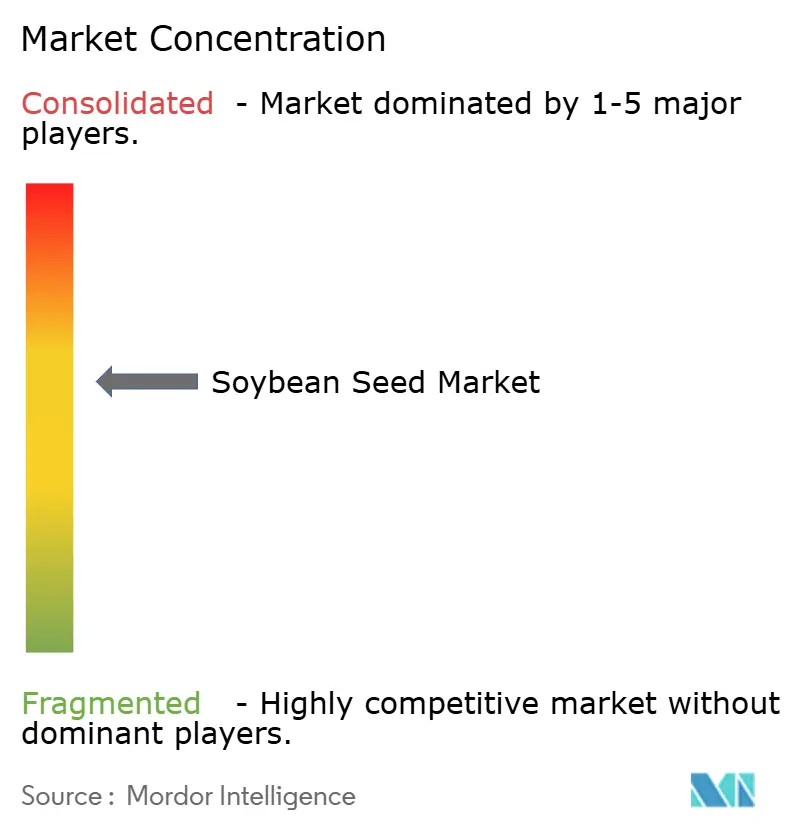
| Market Concentration | Medium |
Major Players *Disclaimer: Major Players sorted in no particular order Image © Mordor Intelligence. Reuse requires attribution under CC BY 4.0. | |
Soybean Seed Market Analysis by Mordor Intelligence
The soybean seed market size was valued at USD 11.07 billion in 2025 and estimated to grow from USD 11.73 billion in 2026 to reach USD 15.68 billion by 2031, at a CAGR of 5.97% during the forecast period (2026-2031). This performance rests on three structural forces: rapid diffusion of drought-tolerant genetics, expanding protein demand from aquaculture, and wider access to premium traits as foundational patents lapse. Growers also benefit from digital tools that quantify on-farm returns, prompting faster hybrid turnover and deeper trait stacking. Meanwhile, carbon-credit incentives reward varieties that lower greenhouse-gas footprints, strengthening price realization in premium channels. Together, these drivers keep the soybean seed market resilient against weather variability, trade policy swings, and herbicide resistance episodes because breeders can pivot trait portfolios and route volumes toward the most profitable end markets.
Key Report Takeaways
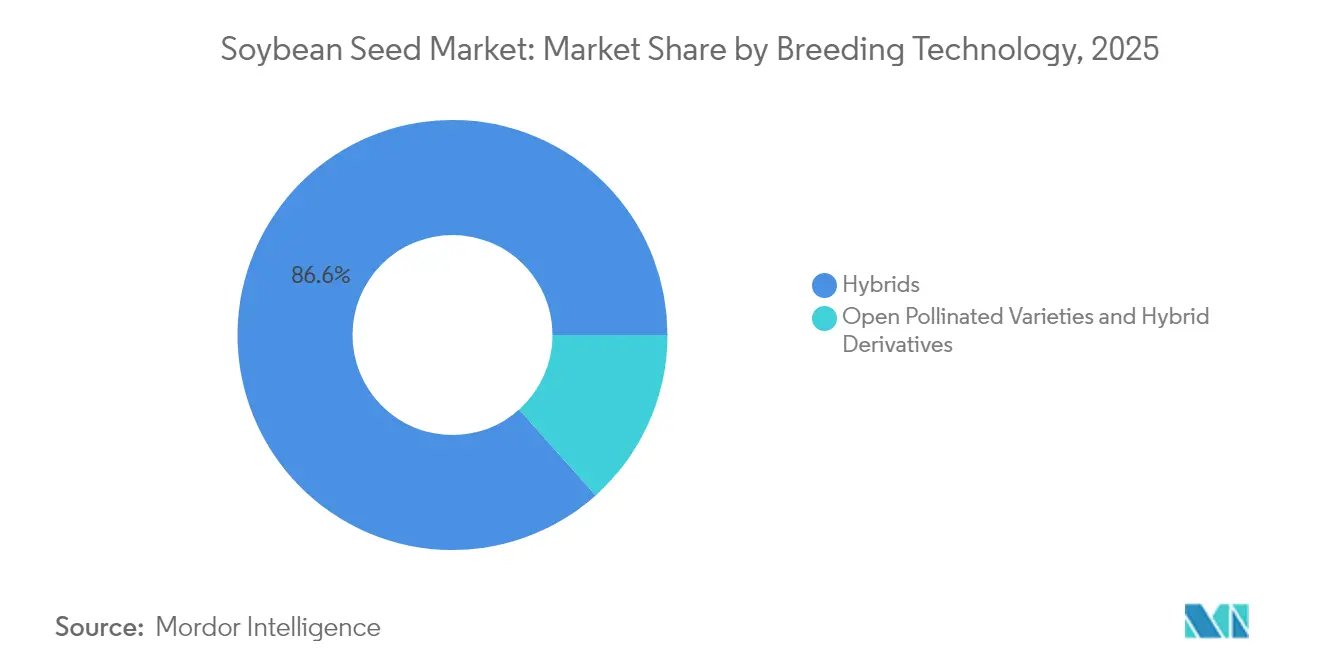
- By breeding technology, hybrids held 86.60% of the soybean seed market share in 2025, and transgenic hybrids registered the highest projected CAGR of 6.35% for 2026-2031.
- By geography, North America led with a 42.90% revenue share in 2025, while Europe posted the fastest CAGR at 7.20% through 2031.
Note: Market size and forecast figures in this report are generated using Mordor Intelligence’s proprietary estimation framework, updated with the latest available data and insights as of 2026.
Global Soybean Seed Market Trends and Insights
Drivers Impact Analysis*
| Driver | (~) % Impact on CAGR Forecast | Geographic Relevance | Impact Timeline |
|---|---|---|---|
| Biotech-enabled yield gains in water-limited soils | +1.8% | Global, with the highest impact in North America and South America | Medium term (2-4 years) |
| Growth in high-protein meal demand from aquaculture | +1.2% | Asia-Pacific core, spill-over to South America and Europe | Long term (≥ 4 years) |
| Glyphosate-tolerant trait patent expiries expand generic seed supply | +0.9% | Global, with early gains in North America, South America, and the Asia-Pacific | Short term (≤ 2 years) |
| Carbon-credit premiums for low- GHG (greenhouse gas) soybean varieties | +0.7% | North America and Europe, expanding to South America | Medium term (2-4 years) |
| On-farm (Return on Investment) ROI analytics platforms accelerating hybrid adoption | +0.6% | North America and Europe, with gradual expansion to other regions | Short term (≤ 2 years) |
| Expansion of non-genetically modified identity-preserved export channels | +0.5% | Europe and Asia-Pacific, with export origins in North America and South America | Long term (≥ 4 years) |
| Source: Mordor Intelligence | |||


Biotech-Enabled Yield Gains in Water-Limited Soils
Drought-tolerant soybean varieties represent the industry's most significant technological breakthrough, with traits like Bioceres' HB4 gene demonstrating 15-20% yield advantages under water stress conditions compared to conventional varieties. Field trials across Argentina and Brazil during 2024 confirmed these performance gains translate to measurable economic benefits for growers facing increasingly erratic precipitation patterns. The technology's commercial expansion accelerates as regulatory approvals advance, with the USDA's (United States Department of Agriculture) recent clearance of multiple drought-tolerance traits signaling broader market acceptance. Advanced breeding programs now integrate these traits with existing herbicide tolerance and insect resistance, creating comprehensive trait packages that address multiple production challenges simultaneously. This convergence positions drought tolerance as a fundamental requirement rather than a premium feature, fundamentally reshaping variety selection criteria across water-stressed growing regions.
Growth in High-Protein Meal Demand from Aquaculture
Aquaculture's protein requirements drive structural shifts in soybean meal specifications, with fish feed manufacturers increasingly demanding varieties containing 48-50% protein content compared to the traditional 44% standard [1]Source: U.S. Soybean Export Council, “Aquaculture Market Development,” USSOYBEAN.ORG. Research published in 2024 demonstrates that high-protein soybean meal can replace up to 75% of fishmeal in salmon diets without compromising growth performance, creating substantial cost savings for aquaculture operations. This demand pattern particularly benefits breeding programs focused on protein optimization rather than oil content, reversing decades of emphasis on crushing margins. Asian markets lead this transition, with China's aquaculture sector, while European and South American fish farming operations rapidly adopt similar protein specifications. The trend creates premium pricing opportunities for identity-preserved high-protein varieties, incentivizing seed companies to develop specialized genetics targeting this expanding market segment.
Glyphosate-Tolerant Trait Patent Expiries Expand Generic Seed Supply
The expiration of foundational Roundup Ready patents in 2024 fundamentally altered competitive dynamics by enabling generic seed producers to incorporate glyphosate tolerance without licensing fees, reducing seed costs by 15-25% in key markets. This democratization particularly benefits smaller regional seed companies and growers in price-sensitive markets, as evidenced by increased market share for non-branded herbicide-tolerant varieties across South America and Asia-Pacific regions. Trait owners respond by launching next-generation technologies with extended patent protection, including dicamba tolerance and multiple herbicide resistance, maintaining competitive advantages through innovation rather than exclusivity. The transition creates bifurcated market dynamics where basic herbicide tolerance becomes commoditized while advanced trait packages command premium pricing.
Carbon-Credit Premiums for Low-GHG (Greenhouse Gas) Soybean Varieties
Voluntary carbon markets increasingly recognize soybeans produced with reduced greenhouse gas emissions, with premium payments ranging from USD 5-15 per metric ton for verified low-carbon varieties. The USDA's Partnerships for Climate-Smart Commodities program allocated over USD 3 billion in 2024 to support sustainable agriculture practices, including soybean production systems that sequester carbon and reduce emissions. Seed companies respond by developing varieties optimized for no-till production systems and nitrogen fixation efficiency, traits that directly contribute to carbon footprint reduction. European buyers lead demand for certified sustainable soybeans, with major food companies establishing procurement targets requiring verified low-carbon supply chains by 2027. This market evolution creates competitive advantages for seed technologies that enable sustainable production practices while maintaining yield performance, positioning environmental stewardship as a core value proposition rather than a compliance requirement.
Restraints Impact Analysis*
| Restraint | (~) % Impact on CAGR Forecast | Geographic Relevance | Impact Timeline |
|---|---|---|---|
| Increasing weed resistance to key herbicides | -0.8% | Global, with the highest impact in North America and South America | Short term (≤ 2 years) |
| Trade-policy volatility on China soybean imports | -0.6% | Global trade flows, with direct impact on South America and North America | Medium term (2-4 years) |
| Stringent European Union regulations on new genomic techniques | -0.4% | Europe, with indirect effects on global trait development | Long term (≥ 4 years) |
| Limited cold-tolerance genetics for northern expansion | -0.3% | North America and Europe, with potential expansion to northern Asia | Long term (≥ 4 years) |
| Source: Mordor Intelligence | |||
Increasing Weed Resistance to Key Herbicides
Herbicide-resistant weeds now infest over 70 million acres of United States cropland, with Palmer amaranth and waterhemp demonstrating resistance to multiple modes of action, including glyphosate, dicamba, and 2,4-D[2]Source: Weed Science Society of America, “Herbicide Resistance Survey Results,” WSSA.NET. University extension services report that resistant weed populations reduce soybean yields by 15-40% when left uncontrolled, forcing growers to adopt expensive integrated management strategies that increase production costs by USD 40-80 per acre. This resistance evolution undermines the value proposition of herbicide-tolerant traits, the dominant technology platform in major soybean producing regions. Seed companies respond by developing traits tolerant to older herbicide chemistries like dicamba and 2,4-D, but these solutions face regulatory scrutiny due to drift concerns and environmental impact. The challenge accelerates research into non-chemical weed control technologies, including precision cultivation tools and allelopathic crop varieties, representing a fundamental shift away from herbicide-dependent production systems.
Trade-Policy Volatility on China Soybean Imports
China's soybean import policies create substantial market uncertainty, with tariff adjustments and quota modifications capable of redirecting global trade flows worth over USD 40 billion annually. The country's strategic emphasis on domestic protein security drives investments in alternative protein sources and domestic soybean production expansion, potentially reducing long-term import dependence from traditional suppliers. Trade tensions between major producing countries and China create price volatility that complicates grower planning decisions and seed company investment strategies, as evidenced by the 30% price swings experienced during 2024 trade negotiations. These dynamics incentivize seed companies to develop varieties optimized for diverse export markets rather than focusing exclusively on Chinese specifications and preferences.
*Our forecasts treat driver/restraint impacts as directional, not additive. The impact forecasts reflect baseline growth, mix effects, and variable interactions.
Segment Analysis
By Breeding Technology: Hybrids Drive Premium Trait Adoption
The 86.60% market share held by hybrids in 2025 reflects their superior yield consistency and trait integration compared to open-pollinated alternatives, with transgenic hybrids representing the fastest-growing subsegment at 6.35% CAGR through 2031. Hybrids continue expanding their dominance within the broader hybrid category, capturing increased market share as growers prioritize trait stacking capabilities that combine herbicide tolerance, insect resistance, and emerging drought tolerance in single varieties .
This substantial market presence is driven by the widespread adoption of both transgenic and non-transgenic hybrid soybean seed varieties. Transgenic hybrids, particularly those with herbicide-tolerant and insect-resistant traits, account for the majority of hybrid seed sales, especially in major soybean-producing regions like North and South America. The segment's dominance is attributed to several advantages offered by hybrid seeds, including higher yield potential, enhanced disease resistance, improved drought tolerance, and better adaptability to diverse climatic conditions. Additionally, the increasing demand for protein-rich animal feed and rising consumption of soybean-based products in food industries has further strengthened the position of hybrid seeds in the market.


Geography Analysis
North America holds 42.90% market share in 2025, stemming from its advanced agricultural infrastructure and early adoption of biotechnology innovations, with the United States leading global hybrid penetration rates exceeding 95% in major producing states. Canada's soybean acreage expansion into traditionally wheat-dominated regions creates growth opportunities, while Mexico's increasing protein consumption drives domestic production investments. Digital agriculture platforms achieve the highest adoption rates in North America, with over 40% of soybean acres utilizing variable-rate seeding and nutrient management systems that optimize hybrid performance.
Europe emerges as the fastest-growing region with a 7.20% CAGR through 2031, driven by the European Union's protein strategy aimed at reducing import dependence and supporting sustainable agriculture transitions. The region's regulatory framework for new genomic techniques evolves favorably following extensive stakeholder consultations, potentially enabling advanced trait commercialization by 2027-2028. Non-genetically modified variety development receives substantial public and private investment, positioning European breeding programs as global leaders in conventional genetics improvement.
Asia-Pacific's holds significant share reflects diverse market dynamics, with China's domestic production expansion contrasting against India's export-oriented growth strategy and Southeast Asian aquaculture demand. China's strategic emphasis on food security drives investments in domestic breeding capabilities and production infrastructure, while maintaining selective import policies that favor specific trait profiles and sustainability certifications. India's soybean seed market benefits from monsoon pattern improvements and government support for oilseed production, though yield gaps compared to global benchmarks indicate substantial improvement potential. Australia's production systems increasingly integrate climate-resilient varieties as drought frequency intensifies, creating demand for specialized genetics adapted to variable rainfall conditions.

Competitive Landscape
The soybean seed market exhibits a moderately consolidated structure dominated by multinational agricultural conglomerates with extensive R&D capabilities and global distribution networks. Bayer AG, Corteva Agriscience, Syngenta Group, KWS SAAT SE & Co. KGaA, and Advanta Seeds - UPL are major players that leverage their technological expertise and financial resources to maintain market leadership through continuous innovation in hybrid and transgenic seed development. The market also features regional specialists who have carved out strong positions in specific geographical areas by offering locally adapted varieties and maintaining close relationships with farming communities.
The industry has witnessed strategic consolidation through mergers and acquisitions, primarily driven by the need to acquire new technologies, expand geographical reach, and strengthen product portfolios. While global players continue to dominate the market, local soybean seed companies maintain significance in specific regions due to their understanding of local growing conditions and established farmer relationships. High entry barriers further characterize the market structure due to significant R&D requirements, regulatory compliance needs, and the importance of established distribution networks.
Patent landscapes continue evolving as foundational herbicide tolerance patents expire, enabling new entrants to access basic transgenic technologies while established players develop next-generation trait platforms with extended intellectual property protection. Regulatory compliance capabilities become competitive differentiators, particularly regarding new genomic techniques approval processes that vary significantly across major markets, with companies possessing strong regulatory affairs expertise gaining advantages in trait commercialization timelines.
Soybean Seed Industry Leaders
Bayer AG
Corteva Agriscience
Syngenta Group
KWS SAAT SE & Co. KGaA
Advanta Seeds - UPL
- *Disclaimer: Major Players sorted in no particular order

Recent Industry Developments
- January 2024: Corteva announced it would launch 24 new Enlist E3 soybean varieties in the U.S. under its Brevant brand. The new varieties feature several agronomic improvements, including a wider range of maturities, enhanced disease resistance, and better performance characteristics.
- March 2023: Corteva Agriscience and Bunge collaborated to develop amino acid-enhanced soybeans. Through this collaboration, Corteva is leveraging its expertise in germplasm, gene editing, and the discovery of its traits to develop soybean varieties with high protein content, optimized amino acid profiles, and lower levels of anti-nutritional factors.


Global Soybean Seed Market Report Scope
Hybrids, Open Pollinated Varieties & Hybrid Derivatives are covered as segments by Breeding Technology. Africa, Asia-Pacific, Europe, Middle East, North America, South America are covered as segments by Region.| Hybrids | Non-Transgenic Hybrids | |
| Transgenic Hybrids | Herbicide Tolerant Hybrids | |
| Insect Resistant Hybrids | ||
| Other Traits | ||
| Open Pollinated Varieties and Hybrid Derivatives | ||
| Africa | By Breeding Technology | |
| By Country | Egypt | |
| Ethiopia | ||
| Ghana | ||
| Kenya | ||
| Nigeria | ||
| South Africa | ||
| Tanzania | ||
| Rest of Africa | ||
| Asia-Pacific | By Breeding Technology | |
| Australia | ||
| Bangladesh | ||
| China | ||
| India | ||
| Indonesia | ||
| Japan | ||
| Myanmar | ||
| Philippines | ||
| Thailand | ||
| Vietnam | ||
| Rest of Asia-Pacific | ||
| Europe | By Breeding Technology | |
| France | ||
| Germany | ||
| Italy | ||
| Netherlands | ||
| Poland | ||
| Romania | ||
| Russia | ||
| Spain | ||
| Turkey | ||
| Ukraine | ||
| United Kingdom | ||
| Rest of Europe | ||
| Middle East | By Breeding Technology | |
| Iran | ||
| Rest of Middle East | ||
| North America | By Breeding Technology | |
| Canada | ||
| Mexico | ||
| United States | ||
| Rest of North America | ||
| South America | By Breeding Technology | |
| Argentina | ||
| Brazil | ||
| Rest of South America | ||
| Breeding Technology | Hybrids | Non-Transgenic Hybrids | |
| Transgenic Hybrids | Herbicide Tolerant Hybrids | ||
| Insect Resistant Hybrids | |||
| Other Traits | |||
| Open Pollinated Varieties and Hybrid Derivatives | |||
| Geography | Africa | By Breeding Technology | |
| By Country | Egypt | ||
| Ethiopia | |||
| Ghana | |||
| Kenya | |||
| Nigeria | |||
| South Africa | |||
| Tanzania | |||
| Rest of Africa | |||
| Asia-Pacific | By Breeding Technology | ||
| Australia | |||
| Bangladesh | |||
| China | |||
| India | |||
| Indonesia | |||
| Japan | |||
| Myanmar | |||
| Philippines | |||
| Thailand | |||
| Vietnam | |||
| Rest of Asia-Pacific | |||
| Europe | By Breeding Technology | ||
| France | |||
| Germany | |||
| Italy | |||
| Netherlands | |||
| Poland | |||
| Romania | |||
| Russia | |||
| Spain | |||
| Turkey | |||
| Ukraine | |||
| United Kingdom | |||
| Rest of Europe | |||
| Middle East | By Breeding Technology | ||
| Iran | |||
| Rest of Middle East | |||
| North America | By Breeding Technology | ||
| Canada | |||
| Mexico | |||
| United States | |||
| Rest of North America | |||
| South America | By Breeding Technology | ||
| Argentina | |||
| Brazil | |||
| Rest of South America | |||


Market Definition
- Commercial Seed - For the purpose of this study, only commercial seeds have been included as part of the scope. Farm-saved Seeds, which are not commercially labeled are excluded from scope, even though a minor percentage of farm-saved seeds are exchanged commercially among farmers. The scope also excludes vegetatively reproduced crops and plant parts, which may be commercially sold in the market.
- Crop Acreage - While calculating the acreage under different crops, the Gross Cropped Area has been considered. Also known as Area Harvested, according to the Food & Agricultural Organization (FAO), this includes the total area cultivated under a particular crop across seasons.
- Seed Replacement Rate - Seed Replacement Rate is the percentage of area sown out of the total area of crop planted in the season by using certified/quality seeds other than the farm-saved seed.
- Protected Cultivation - The report defines protected cultivation as the process of growing crops in a controlled environment. This includes greenhouses, glasshouses, hydroponics, aeroponics, or any other cultivation system that protects the crop against any abiotic stress. However, cultivation in an open field using plastic mulch is excluded from this definition and is included under open field.
| Keyword | Definition |
|---|---|
| Row Crops | These are usually the field crops which include the different crop categories like grains & cereals, oilseeds, fiber crops like cotton, pulses, and forage crops. |
| Solanaceae | These are the family of flowering plants which includes tomato, chili, eggplants, and other crops. |
| Cucurbits | It represents a gourd family consisting of about 965 species in around 95 genera. The major crops considered for this study include Cucumber & Gherkin, Pumpkin and squash, and other crops. |
| Brassicas | It is a genus of plants in the cabbage and mustard family. It includes crops such as carrots, cabbage, cauliflower & broccoli. |
| Roots & Bulbs | The roots and bulbs segment includes onion, garlic, potato, and other crops. |
| Unclassified Vegetables | This segment in the report includes the crops which don’t belong to any of the above-mentioned categories. These include crops such as okra, asparagus, lettuce, peas, spinach, and others. |
| Hybrid Seed | It is the first generation of the seed produced by controlling cross-pollination and by combining two or more varieties, or species. |
| Transgenic Seed | It is a seed that is genetically modified to contain certain desirable input and/or output traits. |
| Non-Transgenic Seed | The seed produced through cross-pollination without any genetic modification. |
| Open-Pollinated Varieties & Hybrid Derivatives | Open-pollinated varieties produce seeds true to type as they cross-pollinate only with other plants of the same variety. |
| Other Solanaceae | The crops considered under other Solanaceae include bell peppers and other different peppers based on the locality of the respective countries. |
| Other Brassicaceae | The crops considered under other brassicas include radishes, turnips, Brussels sprouts, and kale. |
| Other Roots & Bulbs | The crops considered under other roots & bulbs include Sweet Potatoes and cassava. |
| Other Cucurbits | The crops considered under other cucurbits include gourds (bottle gourd, bitter gourd, ridge gourd, Snake gourd, and others). |
| Other Grains & Cereals | The crops considered under other grains & cereals include Barley, Buck Wheat, Canary Seed, Triticale, Oats, Millets, and Rye. |
| Other Fibre Crops | The crops considered under other fibers include Hemp, Jute, Agave fibers, Flax, Kenaf, Ramie, Abaca, Sisal, and Kapok. |
| Other Oilseeds | The crops considered under other oilseeds include Ground nut, Hempseed, Mustard seed, Castor seeds, safflower seeds, Sesame seeds, and Linseeds. |
| Other Forage Crops | The crops considered under other forages include Napier grass, Oat grass, White clover, Ryegrass, and Timothy. Other forage crops were considered based on the locality of the respective countries. |
| Pulses | Pigeon peas, Lentils, Broad and horse beans, Vetches, Chickpeas, Cowpeas, Lupins, and Bambara beans are the crops considered under pulses. |
| Other Unclassified Vegetables | The crops considered under other unclassified vegetables include Artichokes, Cassava Leaves, Leeks, Chicory, and String beans. |


Research Methodology
Mordor Intelligence follows a four-step methodology in all our reports.
- Step-1: IDENTIFY KEY VARIABLES: In order to build a robust forecasting methodology, the variables and factors identified in Step-1 are tested against available historical market numbers. Through an iterative process, the variables required for market forecast are set and the model is built on the basis of these variables.
- Step-2: Build a Market Model: Market-size estimations for the forecast years are in nominal terms. Inflation is not a part of the pricing, and the average selling price (ASP) is kept constant throughout the forecast period.
- Step-3: Validate and Finalize: In this important step, all market numbers, variables and analyst calls are validated through an extensive network of primary research experts from the market studied. The respondents are selected across levels and functions to generate a holistic picture of the market studied.
- Step-4: Research Outputs: Syndicated Reports, Custom Consulting Assignments, Databases, and Subscription Platforms


