Market Overview
| Study Period | 2021 - 2031 |
|---|---|
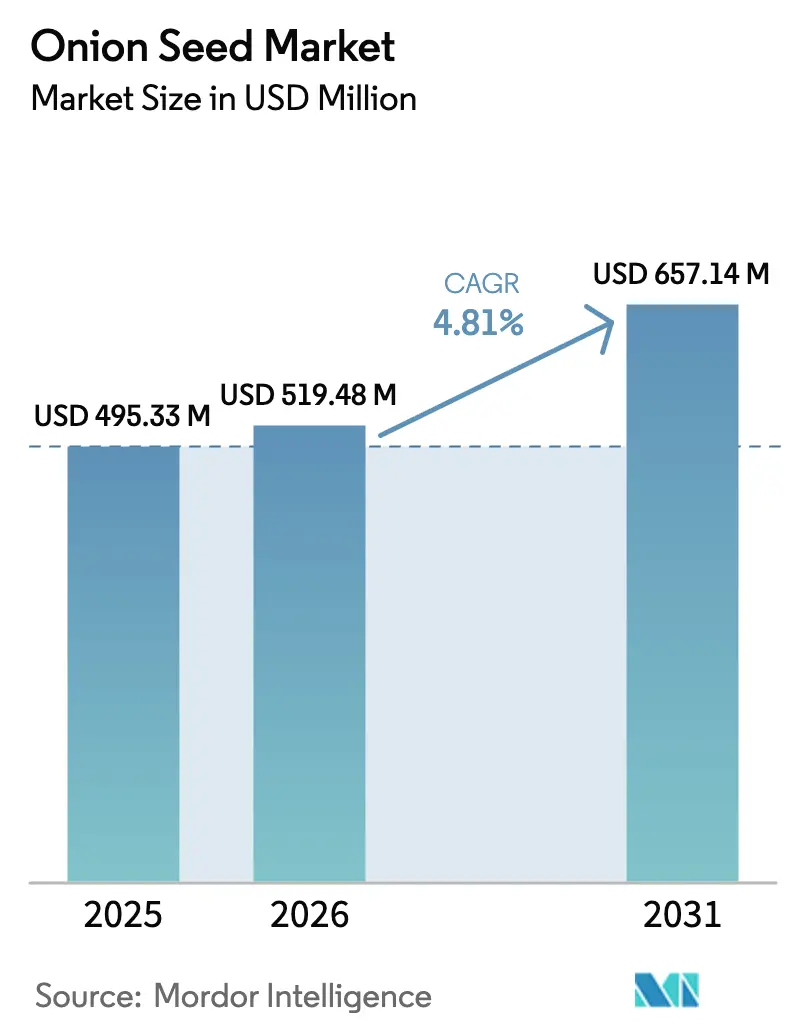
| Market Size (2026) | USD 519.48 Million |
| Market Size (2031) | USD 657.14 Million |
| Growth Rate (2026 - 2031) | 4.81% CAGR |
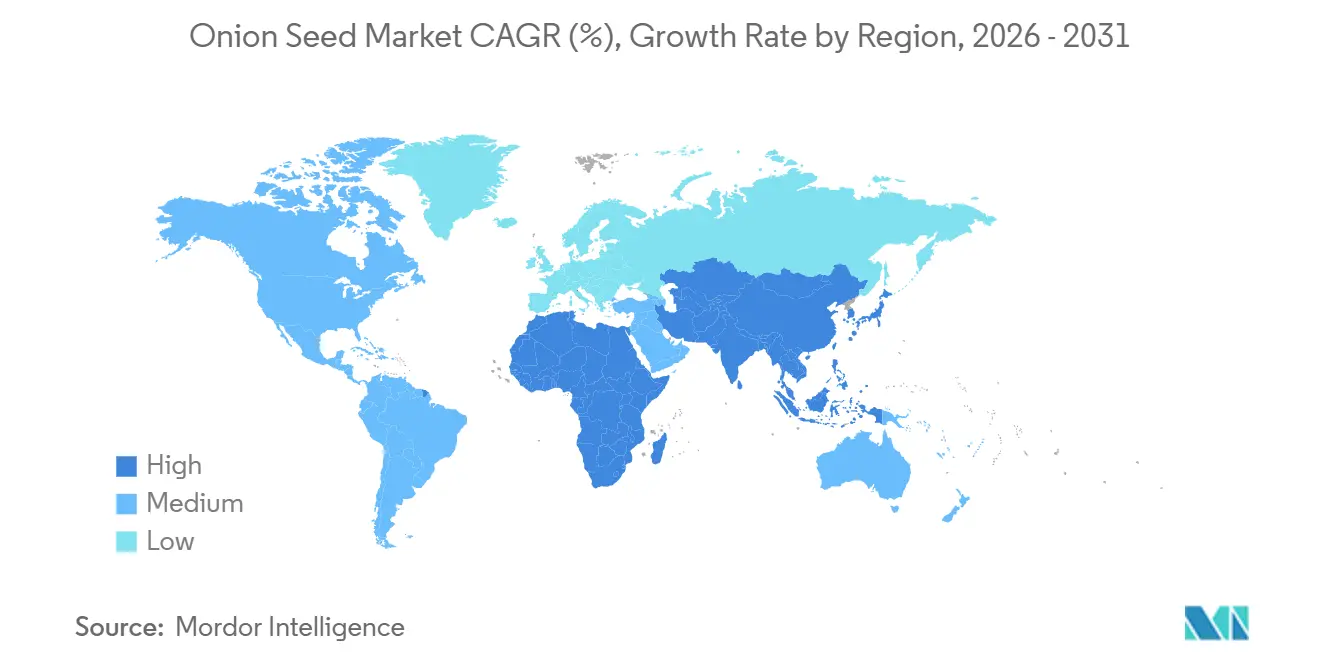
| Fastest Growing Market | Middle East |
| Largest Market | Asia Pacific |
| Market Concentration | Medium |
Major Players *Disclaimer: Major Players sorted in no particular order Image © Mordor Intelligence. Reuse requires attribution under CC BY 4.0. | |
Onion Seed Market Analysis by Mordor Intelligence
The onion seed market size is projected to expand from USD 495.33 million in 2025 and USD 519.48 million in 2026 to USD 657.14 million by 2031, registering a CAGR of 4.81% between 2026 and 2031. Hybrids held a significant market share in 2025, driven by commercial growers' preference for consistent bulb shape, uniform maturity, and extended shelf life. Yet smallholders in Africa and parts of the Asia-Pacific are gradually shifting toward lower-cost Open-Pollinated Varieties and Hybrid Derivatives, a trend reinforced by seed-subsidy programs that lower effective prices. Accelerating adoption in controlled-environment agriculture, especially polyhouses and greenhouses, is pushing seed replacement rates close to 100% because growers can no longer bank on farmer-saved seed for multiple cycles. Demand is also being fueled by public investment in climate-resilient cultivars able to withstand heat, drought, and saline irrigation, particularly in the Middle East, where summer temperatures exceed 45 °C. Although competitive intensity remains moderate, doubled-haploid breeding platforms and tighter intellectual property rules are accelerating varietal turnover and raising the technological bar for newcomers.
Key Report Takeaways
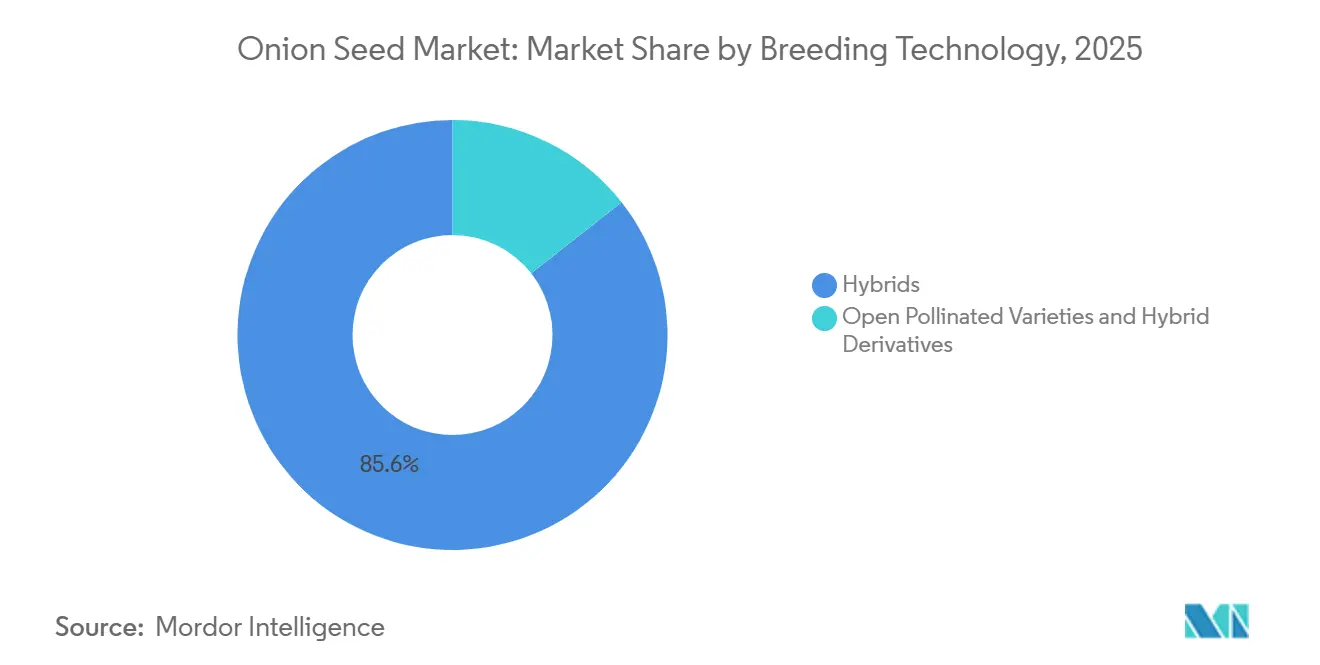
- By breeding technology, hybrids led with 85.6% of the onion seed market share in 2025, while open-pollinated varieties and Hybrid Derivatives are forecast to record the highest 5.1% CAGR through 2031.
- By geography, Asia-Pacific held 32.4% of the onion seed market size in 2025 revenue, whereas the Middle East is set to expand at the fastest 7.4% CAGR between 2026 and 2031.
- The market is moderately consolidated, with companies such as Bayer AG, BASF SE, Groupe Limagrain, Sakata Seeds Corporation, and Bejo Zaden B.V. accounting for a significant share of global revenue.
Note: Market size and forecast figures in this report are generated using Mordor Intelligence’s proprietary estimation framework, updated with the latest available data and insights as of 2026.
Global Onion Seed Market Trends and Insights
Drivers Impact Analysis*
| Driver | (~) % Impact on CAGR Forecast | Geographic Relevance | Impact Timeline |
|---|---|---|---|
| Surge in hybrid-seed adoption for higher uniform yields | +1.2% | Asia-Pacific, Europe, and North America | Medium term (2-4 years) |
| Rapid expansion of protected cultivation acreage | +0.9% | India, China, Netherlands, and Spain | Short term (≤ 2 years) |
| Government seed-subsidy programs in Asia-Pacific | +0.8% | India, Bangladesh, Kenya, Nigeria, Ethiopia, and Tanzania | Medium term (2-4 years) |
| Rising demand for climate-resilient cultivars | +0.7% | Middle East, Sub-Saharan Africa, and drought-prone South Asia | Long term (≥ 4 years) |
| Commercialization of doubled-haploid breeding platforms | +0.5% | European and North American breeding stations | Long term (≥ 4 years) |
| Digitally enabled B2B seed-ordering marketplaces | +0.3% | Sub-Saharan Africa and South Asia pilots | Medium term (2-4 years) |
| Source: Mordor Intelligence | |||


Surge in Hybrid-Seed Adoption for Higher Uniform Yields
Hybrid cultivars deliver 25% to 40% greater bulb uniformity and 15% to 20% longer shelf life than open-pollinated lines, earning premiums in export channels and organized retail[1]Source: Ethiopian Agricultural Research Institute, “Hybrid Onion Trials,” eiar.gov.et. Demonstrations in Ethiopia showed that hybrids outyielded local checks by up to 45%, prompting a national rollout under the Agricultural Growth Program. In India, heat-tolerant Bhima Super, Bhima Shakti, and Bhima Shubhra already occupy 22% of kharif acreage across Maharashtra and Karnataka[2]Source: National Horticultural Research and Development Foundation, “Bhima Varieties Release,” nhrdf.org. Adoption is strongest where cold-chain logistics and mechanized harvesters reward uniform bulb size, yet seed costs four to six times higher than open-pollinated alternatives, limiting uptake among farmers cultivating less than two hectares. Subsidies and group purchasing are narrowing this gap in Bangladesh, Kenya, and Nigeria.
Rapid Expansion of Protected Cultivation Acreage
Polyhouse area in India expanded in 2024-2025 after 50% capital subsidies under the Mission for Integrated Development of Horticulture. Greenhouse production enables two to three crops annually, effectively tripling seed demand and pushing replacement rates near 100%. Comparable gains are underway in the Netherlands, where seed-onion yields have surpassed 52.1 metric tons per hectare under controlled fertigation[3]Source: Statistics Netherlands, “Onion Production Statistics,” cbs.nl. Spain’s Almería province booked a rise in hybrid seed orders for short- and intermediate-day lines suited to year-round cycles. Protected environments also curb pesticide use as thrips and Iris yellow spot virus pressure drops.
Government Seed-Subsidy Programs in Asia-Pacific
India's state initiatives, including the Sub-Mission on Seeds and Planting Material (SMSP) and the National Food Security Mission (NFSM), reimbursed 40% to 50% of certified seed costs during the 2024-2025 rabi season, boosting demand in the onion seed market. Bangladesh frequently organizes large-scale seed distribution campaigns aimed at smallholder farmers. The national demand for onion seeds is approximately 13,000 metric tons. However, certain local or seasonal initiatives focus on distributing smaller, targeted quantities. For example, recent government programs supplied around 1 kg of onion seeds per farmer for summer cultivation to enhance domestic production. Subsidies lower effective seed prices but can crowd out private investment if prolonged. Countries are experimenting with time-bound support and digital vouchers to minimize distortions.
Rising Demand for Climate-Resilient Onion Cultivars
Screening at the University of Cologne in 2024 identified genotypes that lost yield under 30 days of drought, compared with more than 64% in susceptible lines. In 2021-22, Iranian growers cultivating 67,800 hectares demand hybrids tolerant of 45 °C summer heat and saline groundwater with total dissolved solids exceeding 3,000 ppm. Indian research institutes released the Bhima series, which outperformed checks by up to 18% under water-deficit conditions. These traits are non-negotiable as heat waves and erratic rainfall intensify.
Restraints Impact Analysis*
| Restraint | (~) % Impact on CAGR Forecast | Geographic Relevance | Impact Timeline |
|---|---|---|---|
| Low hybrid-seed yields due to pollinator decline | −0.6% | India, China, and North America | Short term (≤ 2 years) |
| High R&D cost of Cytoplasmic Male Sterility (CMS) restorer line development | −0.4% | Europe and North America breeding stations | Long term (≥ 4 years) |
| Counterfeit and brown-bag seed circulation in emerging markets | −0.5% | India, Kenya, Ethiopia, Nigeria, and Bangladesh | Medium term (2-4 years) |
| Stringent varietal-registration rules slowing launches | −0.3% | Europe and North America | Medium term (2-4 years) |
| Source: Mordor Intelligence | |||
Low Hybrid-Seed Yields Due to Pollinator Decline
Honeybee losses ranging from 20% to 30% in key seed production regions are projected to reduce India's onion hybrid seed output in 2025, while increasing pollination service fees. These losses are attributed to factors such as habitat destruction, pesticide use, and climate change, which collectively impact honeybee populations. In the European Union, neonicotinoid bans aim to protect bees but require seed producers to implement more expensive biological control methods, such as introducing natural predators and using organic treatments. Meanwhile, companies in the United States are experimenting with bumble bees and solitary-bee habitats to maintain stable yields, focusing on creating bee-friendly environments and enhancing pollination efficiency.
High R&D Cost of Cytoplasmic Male Sterility (CMS) Restorer-Line Development
Developing a commercial hybrid onion can cost over USD 5 million and take 8-12 years, involving extensive backcrossing and multi-location testing. This lengthy process is further complicated by the onion's 16.3-gigabase genome, which slows marker development and increases the time required for advancements. Major global players, such as Bayer AG, allocated only 8% of their vegetable seed R&D budget to onions in 2023 due to lower revenue per hectare, making it a lower-priority crop. Smaller companies frequently rely on public germplasm, which restricts their ability to differentiate products and compete effectively in the market.
*Our forecasts treat driver/restraint impacts as directional, not additive. The impact forecasts reflect baseline growth, mix effects, and variable interactions.
Segment Analysis
By Breeding Technology: Hybrids Remain Dominant While Affordable Alternatives Rise
Hybrids were the largest breeding technology segment, accounting for 85.6% of the onion seed market share in 2025, reflecting their premium performance in export and supermarket channels. Open-Pollinated Varieties and Hybrid Derivatives were the fastest-growing segment, with a 5.1% CAGR through 2031, as smallholders opt for seed they can save, trimming cash outlays. These trends are expected to drive the growth of the onion seed market size over the forecast period. Hybrids such as Russet, Jambar, and Red Coach yielded 30% to 45% more than open-pollinated checks in Ethiopian trials, yet their seed costs run four to six times higher.
Egypt still relies on farmer-saved Giza Red, Beheri, and similar cultivars on more than 90% of plantings, underscoring the affordability barrier. Bejo Zaden’s Impact Cluster in Bangladesh proved that pairing premium Dutch hybrids with polyhouse protocols can cut post-harvest loss and justify higher seed outlays. The strategic sweet spot may lie in hybrid derivatives delivering 70% of hybrid yield at roughly half the seed price, a model under active development for Sub-Saharan Africa and Southeast Asia.


Geography Analysis
The Asia-Pacific region is projected to be the largest contributor to the onion seed market in 2025, accounting for 32.4%. This dominance is supported by India's 1.62 million hectares of dedicated onion cultivation and China's extensive greenhouse operations. Protected cultivation in India grew in 2025, pushing seed replacement to near 100% and accelerating online purchases through the Pusa Beej portal, which reduced transaction costs. Yet counterfeit rates and pollinator-related seed shortages remain hurdles.
The Middle East is projected to have the fastest CAGR of 7.4% to 2031. Iran plants 44,241 hectares yet still suffers storage loss, and demand is surging for heat- and salinity-tolerant hybrids that maintain bulb firmness at summer temperatures of 45 °C. Gulf Cooperation Council importers are paying premiums for such traits, steering breeders toward climate-adapted pipelines. Europe accounted for a significant share in 2025, led by the Netherlands. The new Dutch DNA-profile rule is spurring investment in doubled-haploid breeding, while Sakata’s 2025 acquisition of a United Kingdom Allium program secured day-length genetics tailored to Northern European conditions.
Syngenta’s tie-up with Emerald Seed unlocks heat-tolerant short-day lines aimed at California and northern Mexico. Vidalia varietal rules prolong launch cycles, but demand for disease-resistant cultivars is escalating as Allium leafminer spreads. Africa and South America together face supply-chain gaps, weak varietal-testing capacity, and limited protected-cultivation infrastructure. Alliance for a Green Revolution in Africa’s Seed Sector Performance Index gave the continent an average score signaling wide room for improvement.

Competitive Landscape
The market is moderately consolidated, with multinational companies such as Bayer AG, BASF SE, Groupe Limagrain, and Sakata Seeds Corporation accounting for a significant share of global onion seed revenue. However, regional specialists like Bejo Zaden B.V., Rijk Zwaan Zaadteelt en Zaadhandel B.V., Enza Zaden Beheer B.V., Takii, and East-West Seed International B.V. maintain dominance in specific day-length niches and geographic regions. Their broad product portfolios and technical support contribute to the market's moderate level of concentration. Sakata's planned acquisition of a United Kingdom Allium program by 2025 is projected to enhance its pipeline of intermediate- and long-day products for temperate regions. Additionally, Syngenta AG's agreement with Emerald Seed secures access to early-maturing genetics tailored for hot, arid zones in the southwestern United States.
Competitive strategies revolve around three key areas, including speed (such as doubled-haploid and marker-assisted breeding), climate resilience, and compatibility with protected environments. Enza Zaden Beheer B.V.'s ping-pong method significantly reduces variety development time, enabling a rapid replacement cycle that smaller firms find challenging to compete with. Increasing intellectual property protections, such as the DNA-profile mandate in the Netherlands, giving companies with advanced sequencing capabilities a competitive advantage.
Opportunities exist in mid-priced hybrid derivatives for emerging markets and in developing cultivars suited to high-salinity or water-scarcity conditions. These cultivars are increasingly important as climate change impacts agricultural productivity in many regions. Digital seed-ordering platforms currently account for less than 5% of sales but have the potential to become a key differentiator as traceability requirements become more stringent. The adoption of these platforms could streamline supply chains and improve access to quality seeds for farmers.
Onion Seed Industry Leaders
Bayer AG
BASF SE
Groupe Limagrain
Sakata Seeds Corporation
Bejo Zaden B.V.
- *Disclaimer: Major Players sorted in no particular order


Recent Industry Developments
- September 2025: Sakata Seeds Corporation acquired Allium Seeds' UK onion and shallot business, securing intermediate-day and long-day genetics for Northern European and Irish markets after a 12-year partnership. The acquisition strengthens Sakata's breeding pipeline for temperate climates and positions the company to serve growers demanding varieties with 14 to 16 hours of day-length sensitivity and strong downy mildew resistance.
- November 2024: The African Regional Intellectual Property Organization's Arusha Protocol has entered into force, establishing a sui generis plant variety protection system that includes provisions for both farmers' and breeders' rights across member states. The protocol seeks to harmonize seed regulations and enable cross-border variety registration, which could benefit the onion market by facilitating the development and registration of improved onion varieties. However, several countries face challenges due to limited institutional capacity to conduct DUS trials.
- March 2024: Syngenta AG introduced a partnership with Emerald Seed Company, granting exclusive access to Emerald's short-day and intermediate-day onion genetics developed at a 15-hectare research facility in El Centro, California. The collaboration targets growers in the southwestern United States and northern Mexico who require early maturing hybrids that tolerate heat stress and deliver uniform bulb size for export markets.


Global Onion Seed Market Report Scope
An onion seed is a small, black, triangular reproductive unit of the Allium cepa plant used primarily for planting and agricultural cultivation.
The onion seed market is segmented by breeding technology (hybrids, open-pollinated varieties, and hybrid derivatives) and by geography (Africa, Asia-Pacific, Europe, the Middle East, North America, and South America). The market forecasts are provided in terms of value (USD) and volume (metric tons).
By Breeding Technology
| Hybrids |
| Open Pollinated Varieties and Hybrid Derivatives |
By Geography
| Africa | By Breeding Technology | |
| By Country | Egypt | |
| Ethiopia | ||
| Ghana | ||
| Kenya | ||
| Nigeria | ||
| South Africa | ||
| Tanzania | ||
| Rest of Africa | ||
| Asia-Pacific | By Breeding Technology | |
| Australia | ||
| Bangladesh | ||
| China | ||
| India | ||
| Indonesia | ||
| Japan | ||
| Myanmar | ||
| Philippines | ||
| Thailand | ||
| Vietnam | ||
| Rest of Asia-Pacific | ||
| Europe | By Breeding Technology | |
| France | ||
| Germany | ||
| Italy | ||
| Netherlands | ||
| Poland | ||
| Romania | ||
| Russia | ||
| Spain | ||
| Ukraine | ||
| United Kingdom | ||
| Rest of Europe | ||
| Middle East | By Breeding Technology | |
| Iran | ||
| Turkey | ||
| Rest of Middle East | ||
| North America | By Breeding Technology | |
| Canada | ||
| Mexico | ||
| United States | ||
| Rest of North America | ||
| South America | By Breeding Technology | |
| Argentina | ||
| Brazil | ||
| Rest of South America | ||
| By Breeding Technology | Hybrids | ||
| Open Pollinated Varieties and Hybrid Derivatives | |||
| By Geography | Africa | By Breeding Technology | |
| By Country | Egypt | ||
| Ethiopia | |||
| Ghana | |||
| Kenya | |||
| Nigeria | |||
| South Africa | |||
| Tanzania | |||
| Rest of Africa | |||
| Asia-Pacific | By Breeding Technology | ||
| Australia | |||
| Bangladesh | |||
| China | |||
| India | |||
| Indonesia | |||
| Japan | |||
| Myanmar | |||
| Philippines | |||
| Thailand | |||
| Vietnam | |||
| Rest of Asia-Pacific | |||
| Europe | By Breeding Technology | ||
| France | |||
| Germany | |||
| Italy | |||
| Netherlands | |||
| Poland | |||
| Romania | |||
| Russia | |||
| Spain | |||
| Ukraine | |||
| United Kingdom | |||
| Rest of Europe | |||
| Middle East | By Breeding Technology | ||
| Iran | |||
| Turkey | |||
| Rest of Middle East | |||
| North America | By Breeding Technology | ||
| Canada | |||
| Mexico | |||
| United States | |||
| Rest of North America | |||
| South America | By Breeding Technology | ||
| Argentina | |||
| Brazil | |||
| Rest of South America | |||


Market Definition
- Commercial Seed - For the purpose of this study, only commercial seeds have been included as part of the scope. Farm-saved Seeds, which are not commercially labeled are excluded from scope, even though a minor percentage of farm-saved seeds are exchanged commercially among farmers. The scope also excludes vegetatively reproduced crops and plant parts, which may be commercially sold in the market.
- Crop Acreage - While calculating the acreage under different crops, the Gross Cropped Area has been considered. Also known as Area Harvested, according to the Food & Agricultural Organization (FAO), this includes the total area cultivated under a particular crop across seasons.
- Seed Replacement Rate - Seed Replacement Rate is the percentage of area sown out of the total area of crop planted in the season by using certified/quality seeds other than the farm-saved seed.
- Protected Cultivation - The report defines protected cultivation as the process of growing crops in a controlled environment. This includes greenhouses, glasshouses, hydroponics, aeroponics, or any other cultivation system that protects the crop against any abiotic stress. However, cultivation in an open field using plastic mulch is excluded from this definition and is included under open field.
| Keyword | Definition |
|---|---|
| Row Crops | These are usually the field crops which include the different crop categories like grains & cereals, oilseeds, fiber crops like cotton, pulses, and forage crops. |
| Solanaceae | These are the family of flowering plants which includes tomato, chili, eggplants, and other crops. |
| Cucurbits | It represents a gourd family consisting of about 965 species in around 95 genera. The major crops considered for this study include Cucumber & Gherkin, Pumpkin and squash, and other crops. |
| Brassicas | It is a genus of plants in the cabbage and mustard family. It includes crops such as carrots, cabbage, cauliflower & broccoli. |
| Roots & Bulbs | The roots and bulbs segment includes onion, garlic, potato, and other crops. |
| Unclassified Vegetables | This segment in the report includes the crops which don’t belong to any of the above-mentioned categories. These include crops such as okra, asparagus, lettuce, peas, spinach, and others. |
| Hybrid Seed | It is the first generation of the seed produced by controlling cross-pollination and by combining two or more varieties, or species. |
| Transgenic Seed | It is a seed that is genetically modified to contain certain desirable input and/or output traits. |
| Non-Transgenic Seed | The seed produced through cross-pollination without any genetic modification. |
| Open-Pollinated Varieties & Hybrid Derivatives | Open-pollinated varieties produce seeds true to type as they cross-pollinate only with other plants of the same variety. |
| Other Solanaceae | The crops considered under other Solanaceae include bell peppers and other different peppers based on the locality of the respective countries. |
| Other Brassicaceae | The crops considered under other brassicas include radishes, turnips, Brussels sprouts, and kale. |
| Other Roots & Bulbs | The crops considered under other roots & bulbs include Sweet Potatoes and cassava. |
| Other Cucurbits | The crops considered under other cucurbits include gourds (bottle gourd, bitter gourd, ridge gourd, Snake gourd, and others). |
| Other Grains & Cereals | The crops considered under other grains & cereals include Barley, Buck Wheat, Canary Seed, Triticale, Oats, Millets, and Rye. |
| Other Fibre Crops | The crops considered under other fibers include Hemp, Jute, Agave fibers, Flax, Kenaf, Ramie, Abaca, Sisal, and Kapok. |
| Other Oilseeds | The crops considered under other oilseeds include Ground nut, Hempseed, Mustard seed, Castor seeds, safflower seeds, Sesame seeds, and Linseeds. |
| Other Forage Crops | The crops considered under other forages include Napier grass, Oat grass, White clover, Ryegrass, and Timothy. Other forage crops were considered based on the locality of the respective countries. |
| Pulses | Pigeon peas, Lentils, Broad and horse beans, Vetches, Chickpeas, Cowpeas, Lupins, and Bambara beans are the crops considered under pulses. |
| Other Unclassified Vegetables | The crops considered under other unclassified vegetables include Artichokes, Cassava Leaves, Leeks, Chicory, and String beans. |


Research Methodology
Mordor Intelligence follows a four-step methodology in all our reports.
- Step-1: IDENTIFY KEY VARIABLES: In order to build a robust forecasting methodology, the variables and factors identified in Step-1 are tested against available historical market numbers. Through an iterative process, the variables required for market forecast are set and the model is built on the basis of these variables.
- Step-2: Build a Market Model: Market-size estimations for the forecast years are in nominal terms. Inflation is not a part of the pricing, and the average selling price (ASP) is kept constant throughout the forecast period.
- Step-3: Validate and Finalize: In this important step, all market numbers, variables and analyst calls are validated through an extensive network of primary research experts from the market studied. The respondents are selected across levels and functions to generate a holistic picture of the market studied.
- Step-4: Research Outputs: Syndicated Reports, Custom Consulting Assignments, Databases, and Subscription Platforms


